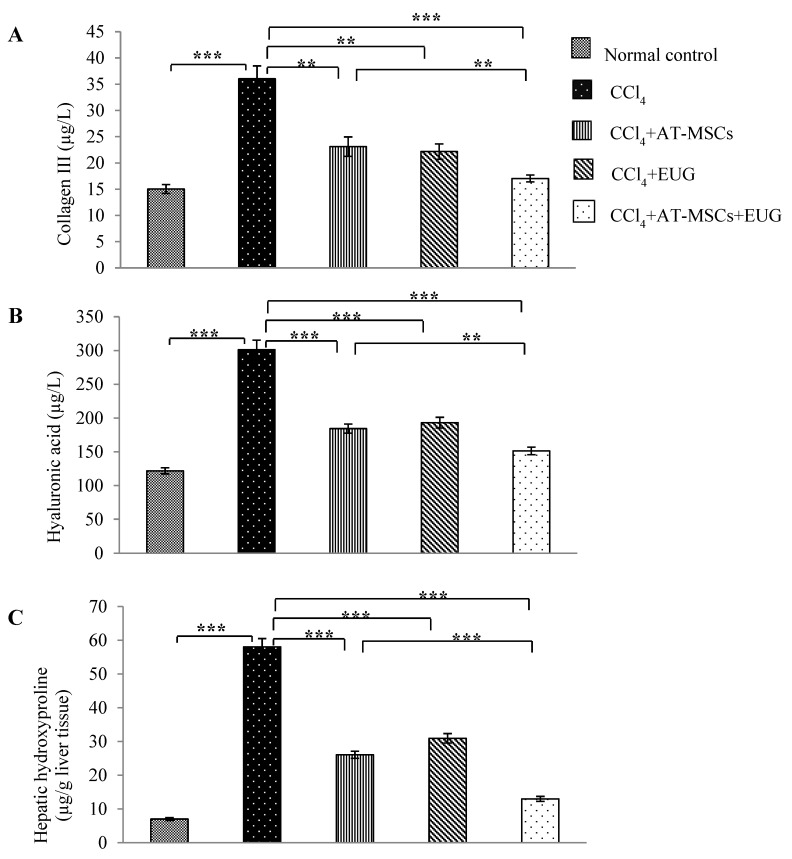
Figure 4.
Levels of type III collagen, hyaluronic acid and hepatic hydroxyproline content. Serum levels of (A) collagen III and (B) hyaluronic acid (µg/L) for the different groups. (C) Hepatic hydroxyproline content (µg/g liver protein) for the different groups. Bars represent mean ± SD. Significant difference between groups is analyzed by one-way ANOVA test, where: **; p < 0.01, ***; p < 0.001. AT-MSCs: Adipose tissue-derived mesenchymal stem cells, EUG: Eugenol.

