

Abstract
Purpose:
Manganese ion has been extensively used as a magnetic resonance imaging (MRI) contrast agent in pre-clinical studies to assess tissue anatomy, function and neuronal connectivity. Unfortunately, its use in human studies has been limited by cellular toxicity and the need to use a very low dose. The much higher sensitivity of positron emission tomography (PET) over MRI enables the use of lower concentrations of manganese, potentially expanding the methodology to humans.
Procedures:
PET tracers manganese-51 (Mn-51, t1/2 = 46 min) and manganese-52 (Mn-52, t1/2 = 5.6 days), were used in this study. The biodistribution of manganese in animals in the brain and other tissues was studied as well as the uptake in the pancreas after glucose stimulation as a functional assay. Finally, neuronal connectivity in the olfactory pathway following nasal administration of the divalent radioactive Mn-52 ([52Mn]Mn2+) was imaged.
Results:
PET imaging with the divalent radioactive Mn-51 ([51Mn]Mn2+) and [52Mn]Mn2+ in both rodents and monkeys demonstrates that the accumulation of activity in different organs is similar to that observed in rodent MRI studies following systemic administration. Furthermore, we demonstrated the ability of manganese to enter excitable cells. We followed activity-induced [51Mn]Mn2+ accumulation in the pancreas after glucose stimulation, and showed that [52Mn]Mn2+ can be used to trace neuronal connections analogous to manganese enhanced MRI neuronal tracing studies.
Conclusions:
The results were consistent with manganese enhanced MRI studies, despite the much lower manganese concentration used for PET (100 mM Mn2+ for MRI compared to ~0.05 mM for PET). This indicates that uptake and transport mechanisms are comparable even at low PET doses. This helps establish the use of manganese-based radiotracers in both pre-clinical and clinical studies to assess anatomy, function and connectivity.
Keywords: Manganese, PET, MEMRI, Mn-51, Mn-52, Neuronal connectivity, Pancreas
Introduction
Manganese enhanced magnetic resonance imaging (MEMRI) has been used in animals to image different organs including liver, kidney, pancreas, spleen, heart and brain. There have been three major uses of MEMRI. One use is to study tissue anatomy including liver, kidneys, heart and pancreas following systemic administration of manganese [1–4], as well as to image anatomy and cytoarchitecture of the brain where layers in the cortex, olfactory bulb (OB), hippocampus and cerebellum can be detected [5–6]. A second use of MEMRI is to monitor cellular activity due to the ability of Mn2+ to enter excitable cells through voltage-gated calcium channels in the brain, heart and pancreas [1, 7–9]. Increased activity in these tissues leads to an increased Mn2+ influx through calcium channels, which results in an increased signal intensity in magnetic resonance imaging (MRI). MEMRI has been used to study regional brain activity following somatosensory stimulation [7] and changes in cardiac inotropy [8]. Glucose load prior to manganese infusion increases pancreatic manganese ion uptake, which depends on the number of functioning β-cells [1]. A third use of MEMRI is to enable neuronal tract tracing following administration of Mn2+ into specific regions in the brain. This is due to the ability of Mn2+ to be transported along axons in an anterograde manner and to cross synapses to trace neuronal pathways [10]. After intranasal or intraocular manganese administration in rodents and monkeys, manganese traces olfactory and visual pathways, respectively, over a course of several days [10–14]. Other MEMRI tract tracing studies used direct injection of manganese into specific brain areas to study the song control pathway in songbirds [15], somatosensory neuronal connections in rats [16–17], and neuronal connections of the basal ganglia in rats and monkeys [14, 18–19].
The major limitation of manganese as an MRI contrast agent in humans is its cellular toxicity and therefore the need to use as low a dose as possible. Several clinical studies have used the FDA-approved agent mangafodipir (MnDPDP, Teslascan), a chelated Mn2+ contrast agent, to image healthy volunteers and patients with liver metastases, pancreatic cancer, and myocardial infarction [20–22]. This agent dissociates rapidly in the blood with most of the contrast that is detected interpreted as representing the released Mn2+. The FDA-approved label indication for detection of liver metastases did not warrant further production of this contrast agent and therefore it is no longer widely available. Furthermore, FDA-approved doses are too low for many applications.
Radioactive manganese tracers have previously been used in physiologic studies, raising the possibility of obtaining information typically derived from MEMRI by using positron emission tomography (PET) in lieu of MRI. Manganese-54, a gamma-emitter (Mn-54, t1/2 = 312.5 days) has been used to study the accumulation and retention of manganese, after dissection, of body tissues in mice and monkeys [23–24] and to trace its distribution in specific neuronal connections in the brain of rats [25–27]. In the late 1960’s Mn-54 was given intravenously to healthy human volunteers to study its whole body retention [28–29], with limited clinical use due to its long half-life and high gamma energy. Manganese-52m (Mn-52m, t1/2 = 21.1 min) was suggested as a potential PET tracer for myocardial imaging [30–31], and was shown to detect infarction in the heart of dogs [30].
In recent years, there has been a renewed interest in using radioactive manganese for PET imaging, in particular manganese-52 [32–37]. Mn-52 is a positron emitter with a long half-life of 5.6 days, which allows longitudinal biodistribution studies in the body and brain. In the present study, Mn-51 and Mn-52, positron-emitters with a physical half-life of 46.2 min and 5.6 days respectively, were used in both rats and macaque monkeys. The results show that manganese radiotracers give similar information as Mn2+ in MRI with accumulation in various tissues following systemic infusion even at low concentrations. Mn-51 PET was also used to follow activity-induced manganese accumulation in the pancreas during a glucose load. Finally, Mn-52 PET was used to trace olfactory pathways in the brain following intranasal administration in monkeys. These results add to the accumulating evidence that there will be a wide variety of potential applications for the use of manganese-based radiotracers in both pre-clinical and clinical studies to assess anatomical, functional and neuronal connectivity information by PET.
Materials and Methods
All animal studies were approved by the Animal Care and Use Committees of the National Institute of Neurological Disorders and Stroke (rats), and the NIH Clinical Center (monkeys) and were performed in accordance with the regulations of the Division of Radiation Safety, at the National Institutes of Health (Bethesda, MD, USA).
Radiotracer production
Radionuclides of Mn-51 and Mn-52 were produced on a CS30 cyclotron at the NIH Cyclotron Facility and assayed on a Capintec 127 Dose Calibrator utilizing a pot setting of 551 for Mn-51 and 710/2 for Mn-52. Radionuclidic purity was determined by spectral analysis on a Princeton Gamma-Tech HPGeLi detector.
To produce Mn-51, electroplated Cr-50 metal (3–5 mg, > 99% isotopic purity) on solid gold internal target plates were irradiated with 60–80 μA of a 14 MeV deuteron beam for 50 min. Manganese-51 was isolated using a modified method of Klein and co-workers [38]. Briefly, irradiated chromium target was taken up in hot 6 N HCl. The mixture was oxidized by the addition of 10 M NaOH and 10 M H2O2. After the addition of carrier iron the [51Mn]MnCl2 was separated on a prepared silica filter column. No further purification was necessary. The pH of the eluant of [51Mn]MnCl2 in HCl was adjusted to 8 and diluted with 1 M bicine (pH 7.2). The yield was 740–5587 MBq (20–151 mCi) of Mn-51 bicine-solution (15 ml) 90 min after End of Bombardment (EOB).
For Mn-52, pressed pellets of vanadium metal (200 mg; Alfa-Aesar, > 99.86% isotopic purity with residual as listed on Certificate of Analysis: Fe (0.04%), Al (0.0012%), C (0.04%), O (0.04%), Si (0.01%), Cr (0.03%), N (0.035%), and H (0.0008%), and no carrier manganese metal in the target material) in an aluminum target cup were irradiated with 15–20 μA of a 19 MeV He-3 beam for 28–36 h over a 4-day period. No long-lived Mn-54 was detected at EOB. Manganese-52 was isolated using a modified method of Sastri and co-workers [39]. The irradiated vanadium metal was removed from the target cup and taken up in hot HNO3. The radioisotope mixture was treated with saturated KIO3, heated to boiling, and allowed to cool. [52Mn]Mn(II) was extracted as the oxinate with a 0.1 M chloroform solution of 8-hydroxyquinoline. The extracted chloroform-hydroquinone solution containing only Mn-52 was reduced to dryness under vacuum and excess hydroquinone was removed by sublimation. The dried organic layer was back-extracted with a mixture of 0.1 N HCl and 10% v/v ethanol. The pH was adjusted and the manganese-52 solution diluted and buffered with 1 M bicine. The solution was tested for carrier manganese and pH was recorded. The yield was 11–41 MBq (0.3–1.1 mCi) Mn-52/ml.
Rat whole body MEMRI and Mn-51 imaging procedure
Male Sprague Dawley rats (250–350 g, n = 10) were used in this study. For Mn-51 administration, rats were anesthetized with isoflurane and a 22G IV catheter was inserted into the tail vein for tracer administration. Rats were then injected intraperitoneally (IP) with Inactin (Sigma-Aldrich), 100 mg/kg bodyweight in water and isoflurane was discontinued. Inactin maintains rats under stable anesthesia for 3–4 h, the duration of the PET imaging session. After assuring anesthesia was maintained, rats were positioned in the scanner and Mn-51 radiotracer, 15 – 33 MBq (0.4–0.9 mCi) in 1 ml was infused using a syringe pump at a rate of 5 ml/h (infusion time ~12 min). Mn2+ concentration in the infused solution was lower than 0.05 mM, which reflects the situation where a manganese test strip would give positive results of < 1 ppm for the presence of bulk manganese in the radiotracer solution. Although no production runs of Mn-51 (and Mn-52) solutions gave a positive test for the presence of Mn2+, we later use this concentration, 0.05 mM, for comparison with Mn2+ concentrations used in MRI. PET imaging started with the beginning of radiotracer administration to follow the course of the radiotracer in the body for 2.5 h. After imaging, while still under anesthesia, animals were euthanized with an overdose bolus of potassium chloride (KCl, 10 mg/ml), 2.0 ml/rat, via the tail vein line.
For MEMRI body imaging, rats were anesthetized with isoflurane and 25 mM MnCl2 (Sigma-Aldrich) solution, on the lower end of the concentration range typically used for systemic infusion in MEMRI, was infused through a tail vein catheter using a syringe pump (Cole-Parmer Instrument) at a rate of 5 ml/h, total volume 1 ml (infusion time ~12 min). After a baseline pre-Mn2+ scan, MEMRI imaging started with the beginning of manganese administration similar to the PET procedure for 2.5 h. During imaging rats were anesthetized with 1–2% isoflurane.
Rat Mn-52 brain and whole body imaging procedure
Mn-52 solution, 4–7 MBq (0.1–0.2 mCi), in 2 ml was infused through a tail vein catheter using a syringe pump at a rate of 5 ml/h. 24 h and 48 h after infusion, rats were given an IP injection of Inactin (100 mg/kg bodyweight in water) as previously described. After assuring anesthesia was maintained, rats were positioned in the scanner and imaged for 1 h. After imaging, while still under anesthesia, rats were euthanized with a lethal dose of KCl as described above.
Monkey Mn-51 whole body and pancreas imaging procedure
Five rhesus macaque monkeys were included in this study (9–15 years of age, weight 7–14 kg). Each underwent 1–2 whole body imaging sessions during the course of this study, with at least 6 months between imaging, for a total of 8 sessions. In each session, Mn-51 was infused intravenously at a dose of ~ 333 MBq (~9 mCi) in 12 ml over 5 min using a Harvard® pump. Two sessions were excluded from the study because the infused radiotracer dose was only 74–111 MBq (2–3 mCi). Monkeys were anesthetized with ketamine IM for IV insertion and endotracheal intubation and then transported to the PET suite. They were placed in a stereotactic head holder in the prone position in the PET/CT scanner and anesthesia was maintained with isoflurane. PET imaging started with the beginning of radiotracer administration for a total of 2 h. Before and during scanning, the vital signs, e.g. heart rate, respiration rate and body temperature, were measured continuously to check for any effects due to tracer administration. In three sessions, arterial blood samples were taken before, during and after Mn-51 infusion, through an indwelling arterial port that was placed several months earlier. Samples of 0.5 cc were drawn every 15 to 60 sec in the first 10 min and every 2 to 10 min after that until the end of scanning, and counted on a Packard COBRA® gamma counter to follow manganese clearance from the blood.
To determine if there was activity-induced manganese enhancement in the pancreas, a 50% dextrose (Hospira) solution, 0.3 g/kg bodyweight, was administered IV over 2 min prior to infusion of the radiotracer. Vital signs and blood glucose levels were taken before and after glucose injection and after Mn-51 infusion, to check for any physiologic effects of glucose or tracer administration.
Monkey Mn-52 Nasal Administration imaging procedure
In this study, 4 monkeys were used. Each monkey was anesthetized with ketamine 10 mg/kg, acepromazine 0.2 mg/kg, and glycopyrrolate 0.01 mg/kg or atropine 0.05 mg/kg (all IM), and was positioned supine with the head extended back to facilitate administration of the divalent radioactive Mn-52 ([52Mn]Mn2+) into the nose. A total of 7–22 MBq (0.2–0.6 mCi) of [52Mn]Mn2+ were administrated into both nostrils using a plastic pipette, 0.5 ml into each nostril. After radiotracer administration, each animal was either transported to the PET/CT for scanning or moved back to housing. To follow [52Mn]Mn2+ distribution in the brain at different time points, the animal had 3 scan sessions, from immediately after to up to one week after Mn-52 administration, with at least 1 day between scans. The head was scanned for 1 h followed by a whole body scan to study radiotracer distribution in the rest of the body.
PET and MRI imaging procedure
PET imaging was performed on either a Siemens High Resolution Research Tomography (HRRT) scanner, ~2.5 mm resolution (rats) or on a Siemens mCT® PET/CT scanner, ~3.5 mm resolution (monkeys). Due to the substantial positron range of Mn-51 of 4.3 mm, the effective resolution for Mn-51 studies was 5.5 mm, unlike F-18 and Mn-52, both with positron range of 0.6 mm and resolution of 3.5 mm. For dynamic whole body PET imaging (Mn-51), scanning started with injection of radiotracer and continued for up to 2.5 h. For static whole body (rats) and brain (monkeys) scanning Mn-52 images were acquired for 1 h. This is in accord with the relatively long half-life of the radiotracer (5.6 days), as well as with its relatively stable biodistribution due to the slow in vivo transport rate of manganese estimated as 2 mm/h in rodent’s brain [10]. For monkeys, a 1 h brain scan was followed by a 20 min whole body scan. For the HRRT scanner, a transmission scan was obtained with point source of Cs-137 for attenuation correction, while for the PET/CT scanner, a CT scan was performed for attenuation correction and anatomical image localization. Reconstruction of the PET images was performed using the OSEM (Ordered Subset Expectation Maximization) iterative reconstruction method; a correction for additional gamma decays was applied during Mn-52 image reconstruction.
Rat whole body MRI images were acquired on a 4.7 Tesla Bruker Avance III scanner with a 72 mm ID birdcage coil. Body manganese-enhanced MRI images were acquired using a T1 weighted fast low angle shot (FLASH) sequence with 2 mm slice thickness, 400 μm in plane resolution, TR/TE = 200/2.7 ms, 60° pulse, bandwidth = 100 kHz, FOV = 9×8 cm2, matrix size = 225×200, number of averages = 4; each scan was ~3 min long. Scanning was done for 2.5 h.
A summary of all imaging procedures is presented in Table S1.
Data Analysis
Data processing was done using Medical Image Processing, Analysis, and Visualization (MIPAV) software (NIH; http://mipav.cit.nih.gov). PET measurements were done by manually defining the ROI for each organ. For monkeys, CT scans were used to help with ROI placement. Activity measurements were obtained for each organ over time for each animal and were used to create decay-corrected time activity (TAC) curves and standardized uptake value (SUV) curves. For pancreas analysis, the pancreas for each monkey was identified by 2 independent radiologists using only the CT scan; ROIs were drawn on the CT images and then applied to the PET images for activity measurements, and pancreas ROIs from all monkeys were averaged together.
MRI measurements were performed in similar way using MIPAV. ROIs were manually drawn and intensity was measured for the heart, liver and kidneys over time. ROIs were also drawn in the muscle area, where no manganese was found to accumulate following manganese administration. Muscle ROIs were drawn at each time point on the same slices in which the organs ROIs were drawn, and were used for normalization of the signal intensity.
For studies using nasal administration of tracer, PET images were co-registered to MRI images of the same monkey (3D T1-weighted brain MRI, acquired on a 3T Philips Achieva scanner, with 1 mm slice thickness, TR/TE = 25/4.3 ms, 35° pulse, FOV = 100×100 mm2, number of averages = 2). ROIs of the different compartments of the olfactory pathway were drawn on the MRI images with the help of a monkey atlas39 and then applied to the PET images. 1% of the maximum intensity in the PET image, which was about 20–30 times above noise level, was used as threshold for tracing in these ROIs.
Results
Mn-51 whole body PET imaging
A representative maximum intensity projection (MIP) image following with the divalent radioactive Mn-51 ([51Mn]Mn2+) infusion in a rat is shown in Fig. 1a. [51Mn]Mn2+ was detected in various tissues including liver, kidneys, and heart, similar to reported MRI results following systemic infusion of manganese [2–4]. [51Mn]Mn2+ accumulation was also detected in the salivary glands. Comparison of MRI and PET images for rats following IV infusion of Mn2+ and [51Mn]Mn2+, respectively, is shown in Fig. 1b, c; 12 min of manganese infusion was used for both imaging methods. The manganese concentration used for the MRI was 25 mM, on the lower end of the concentration range typically used for systemic infusion in MEMRI. For PET, Mn2+ concentration was approximately 0.05 mM, which is about 2000 fold lower than the typical MRI dose (~100 mM). For both imaging methods, manganese accumulation is evident in various tissues. During manganese infusion, the entire heart demonstrates manganese activity, attributed to the blood flow carrying the manganese into the cardiac chambers. At the end of the infusion there is rapid clearance of the manganese from the blood pool and the tracer accumulates in the ventricular wall due to intracellular uptake of manganese. The highest manganese activity accumulation was in the liver and kidneys with lower activity accumulation in the cardiac tissue, as can be seen in the normalized intensity curve for MRI and the SUV curve for PET in Fig. 1d and e, respectively. Both time curves show a similar relative distribution of manganese in the tissues. The distribution of [51Mn]Mn2+ is also consistent with previous MRI results following systemic administration of Mn2+ [3–4]. The kidney and liver manganese accumulation were similar for MRI (Fig. 1d) but there was lower relative accumulation in the liver for MRI (Fig. 1e); this is likely due to the higher amount of Mn2+ used in MRI. The specific cause of this alteration of liver uptake could either be due to saturation of Mn2+ uptake in the liver at MRI doses, or limitations to detect further changes in T1 due to imaging parameters used in this study. This warrants further investigation.
Fig. 1.
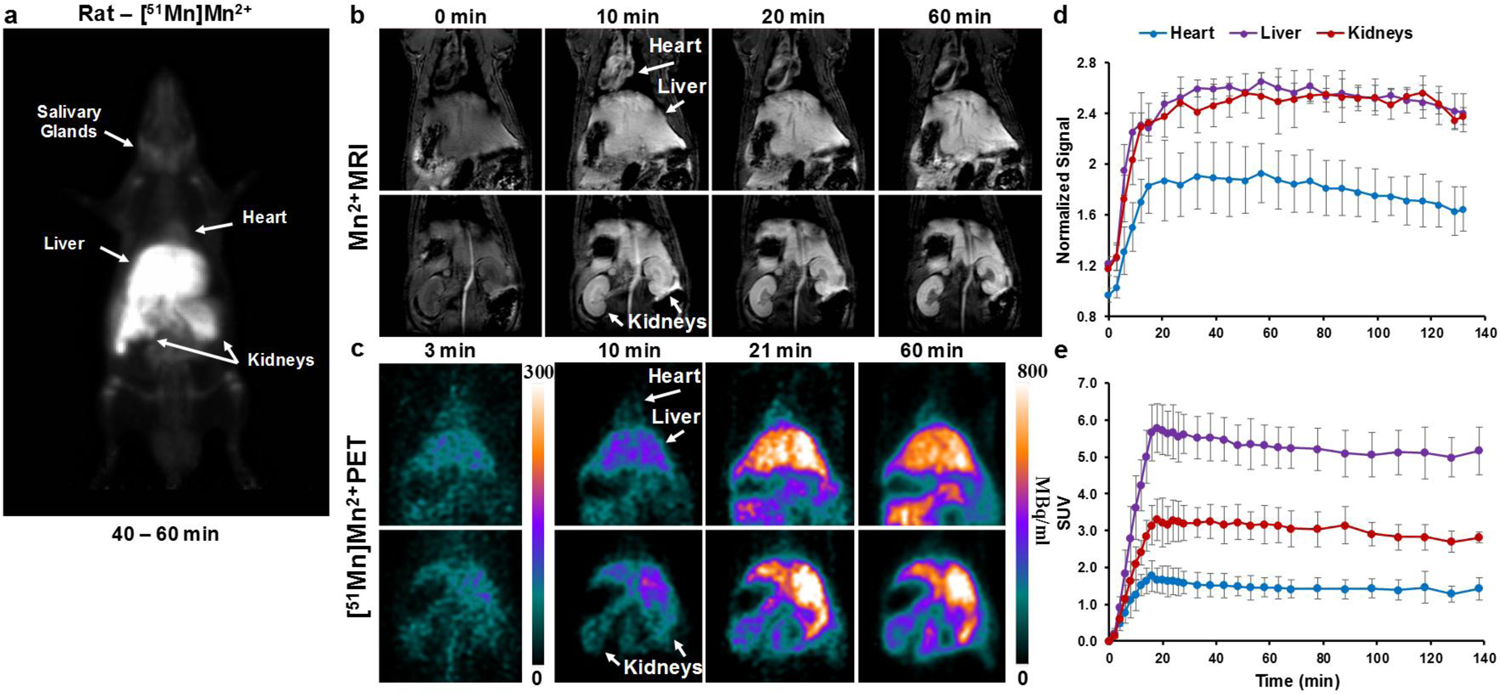
Whole body [51Mn]Mn2+ PET and Mn2+ MRI in rats a coronal MIP image of a rat 40–60 min following IV infusion of [51Mn]Mn2+ (t1/2 = 46 min). [51Mn]Mn2+ can be detected in the heart, liver, kidneys and salivary glands. b T1-weighted MRI images and c PET images of rats following IV infusion of Mn2+ and [51Mn]Mn2+ respectively, and the corresponding time intensity curve (d, MRI) and standardized uptake value (SUV) curve (e, PET). Values are average and sd, MRI n = 4, PET n = 6. The highest manganese accumulation was in the liver and kidneys followed by the heart. For both MRI and PET, manganese was infused through the tail vein for 12 min.
The relatively low resolution of PET together with the small size of the rat limits our ability to study tracer distribution; thus, the larger non-human primate (NHP) model was chosen to investigate additional aspects of Mn-PET. A MIP image following [51Mn]Mn2+ infusion in monkey is shown in Fig. 2a. Similar to biodistribution in the rat, [51Mn]Mn2+ accumulates in liver, kidneys and heart with the prostate and bone marrow also evident in the monkey. The [51Mn]Mn2+ activity in the blood was markedly decreased 10 min following the cessation of [51Mn]Mn2+ infusion (infusion time 20 min), and was reduced close to baseline 20 min after stopping the infusion (Fig. 2b). This is in agreement with previous reports showing that Mn2+ is cleared from the blood very rapidly over a course of minutes after administration [2, 24]. In the data shown in Fig. 2b, the [51Mn]Mn2+ began to clear rapidly from the blood after the tracer infusion. Dynamic studies performed on a PET/CT scanner with 5 min infusion of [51Mn]Mn2+ (Fig. 2c) show the accumulation of [51Mn]Mn2+ in liver, kidneys and heart. The SUV curve (Fig. 2d) also shows a similar relative distribution of [51Mn]Mn2+ to that in the rat. [51Mn]Mn2+ activity in the left ventricle increases in the first few minutes and decreases quickly, due to rapid clearance of manganese from the blood pool (Fig. 2e), which is similar to the blood activity curve in Fig. 2b. At the same time [51Mn]Mn2+ accumulation in the left ventricular wall showed a slower increase, which reached steady state due to intracellular uptake and retention of the manganese in the cardiac tissue. In both monkeys and rats, IV infusion of [51Mn]Mn2+ shows biodistributions similar to those previously reported in MRI studies with systemic administration of manganese.
Fig. 2.
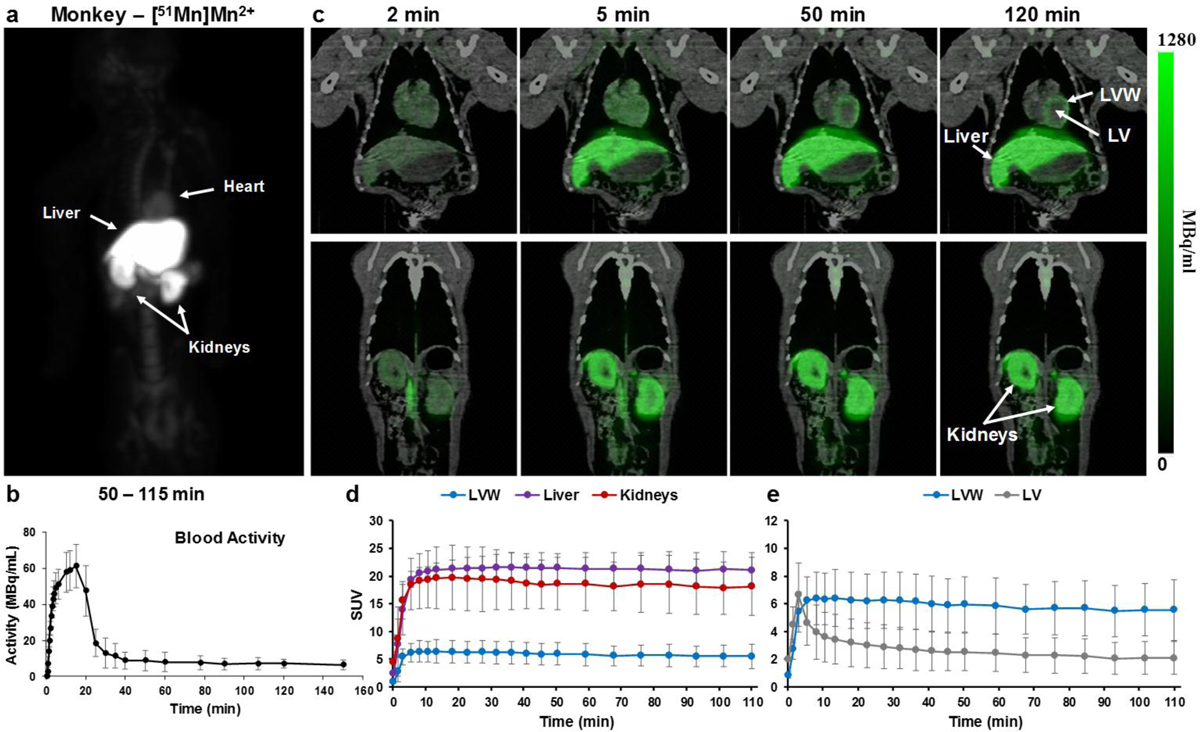
Whole body [51Mn]Mn2+ PET imaging in monkeys a coronal MIP image of a monkey 50–115 min following IV infusion of [51Mn]Mn2+. [51Mn]Mn2+ can be detected in the heart, liver, kidneys and in the bone marrow. b Blood time activity curve following [51Mn]Mn2+ infusion in monkeys (n=3); values are average and standard deviation (sd). c PET/CT images over time in the heart, liver and kidneys of a monkey following IV infusion of [51Mn]Mn2+, d the corresponding standardized uptake values (SUV) curve (average and sd, n=3) and e SUV curve for the heart (average and sd, n=3). Highest activity was detected in the liver and kidneys, and then heart, similar to rats. LV – left ventricle. LVW – left ventricular wall.
Glucose increases Mn-51 activity in the pancreas
The pancreas has been the focus of many studies relevant to diabetes mellitus for estimating β-cell mass and function. In MRI studies, stimulation with glucose prior to manganese infusion results in increased accumulation of Mn2+ in the pancreas or in isolated β-cell islets that can be detected with MRI [1, 40–41]. Here, monkeys received, on different days, infusion of either [51Mn]Mn2+ alone or [51Mn]Mn2+ following a bolus infusion of glucose (0.3 g/kg). For each monkey, the pancreas was identified by two independent radiologists using the CT scan. An ROI was drawn on the CT image and applied to the PET image for radioactivity measurements. Fig. 3a, c show a representative CT scan of the abdominal area where the pancreas was identified. PET/CT images of the same area, 3 min and 60 min after infusion of [51Mn]Mn2+ alone or [51Mn]Mn2+ after a glucose load, are shown in Fig. 3b, d respectively. The accumulation of manganese in the pancreas, kidneys and spleen can be readily detected. The corresponding time activity curves of the pancreas are shown in Fig. 3e. The average activity measured in the glucose-stimulated pancreas is almost double the levels measured in the same monkeys after only [51Mn]Mn2+. The SUV curve in various tissues after infusion of [51Mn]Mn2+ with glucose stimulation was also calculated and can be seen in Fig. S1. Glucose stimulation did not change the anatomical distribution of [51Mn]Mn2+ and any difference was not statistically significant in the liver, kidneys and heart in both cases. To further test if the increased manganese was glucose-specific to the pancreas, the ratio of manganese accumulation in the pancreas to that in the kidneys was calculated (Fig. 3f). The average ratio was ~60% higher for monkeys that received glucose stimulation. Therefore, glucose increased [51Mn]Mn2+ uptake in the pancreas.
Fig. 3.
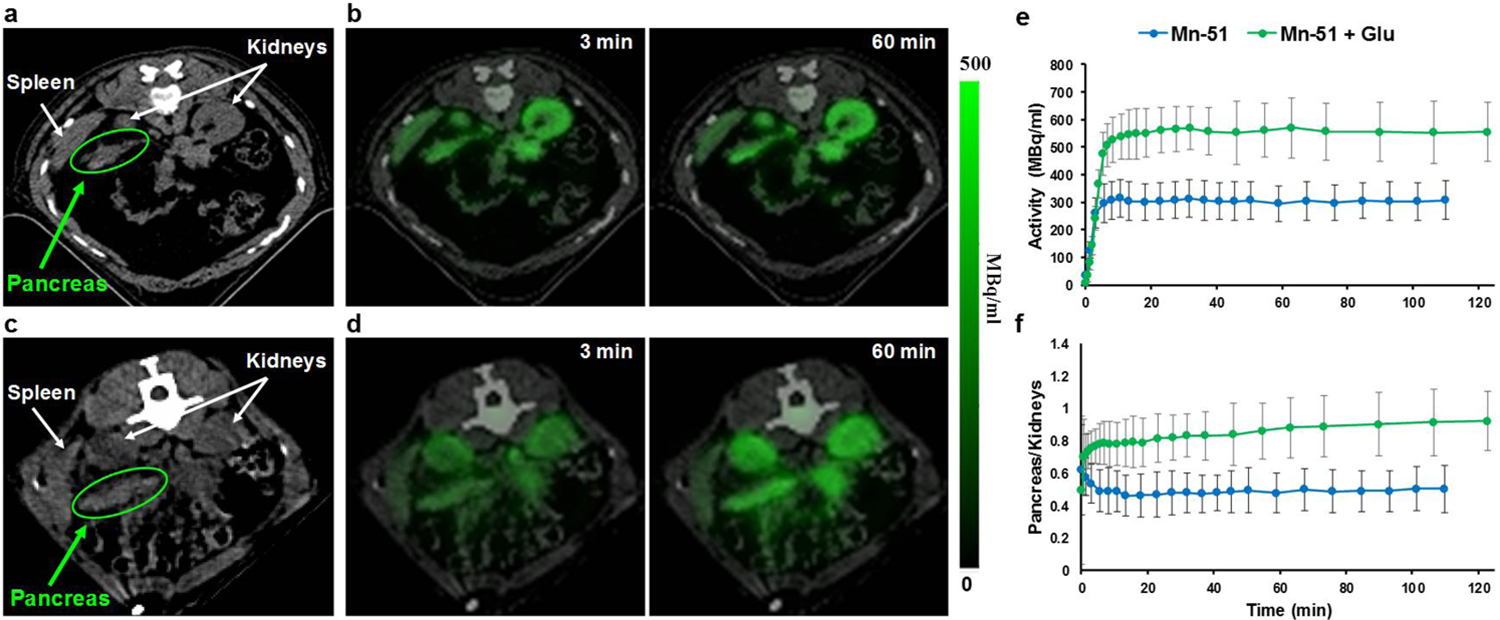
Activity-induced [51Mn]Mn2+ imaging in monkey pancreas a and c CT image of the abdominal area that shows the pancreas before IV infusion of radiotracer and the PET/CT images of the same area, 3 min and 60 min after IV infusion of b [51Mn]Mn2+, and d [51Mn]Mn2+ after bolus injection of glucose (0.3 g/kg). Manganese is detected in the pancreas and other tissues. e The corresponding time-activity curve of [51Mn]Mn2+ in the pancreas for monkeys that received only [51Mn]Mn2+ (n=3) vs. monkeys that received glucose injection before [51Mn]Mn2+ infusion (n=3), and f the pancreas to kidney ratio curve. ROIs were selected using the anatomy from the CT scan and then applied to the PET image.
Whole body imaging with Mn-52
Systemic administration of manganese results in excellent contrast in the brain 24 h later in MRI studies [5]. Due to its short half-life of 46.2 min, Mn-51 cannot be used to study manganese accumulation in different brain areas 24 h post IV administration. The half-life of Mn-52 (5.6 days) allows for imaging at longer time points following tracer infusion as seen in Fig. 4a. A MIP image of a rat 48 h after IV infusion of [52Mn]Mn2+ demonstrates accumulation of the tracer in the different organs (similar to [51Mn]Mn2+, Fig. 1a) including the brain, via the choroid plexus and the cerebrospinal fluid, similar to MEMRI results in the rodent brain [5–6]. The head area of the MIP image is shown in Fig. 4b and is compared to an MRI image projection of a rat head following Mn2+ administration, Fig. 4c. Although PET image resolution is lower than that of MRI, 2.5 mm compared to 400 μm respectively, the radiotracer can be identified in different areas in the brain and head, such as the nasal turbinates, OB, hippocampus, pituitary gland and salivary glands. Fig. 4d, e show the PET and MRI images at different slices across the head, where manganese accumulated in various areas. Thus, the long half-life [52Mn]Mn2+ allowed a visualization of relative distribution in the head and brain similar to that detected with MEMRI.
Fig. 4.
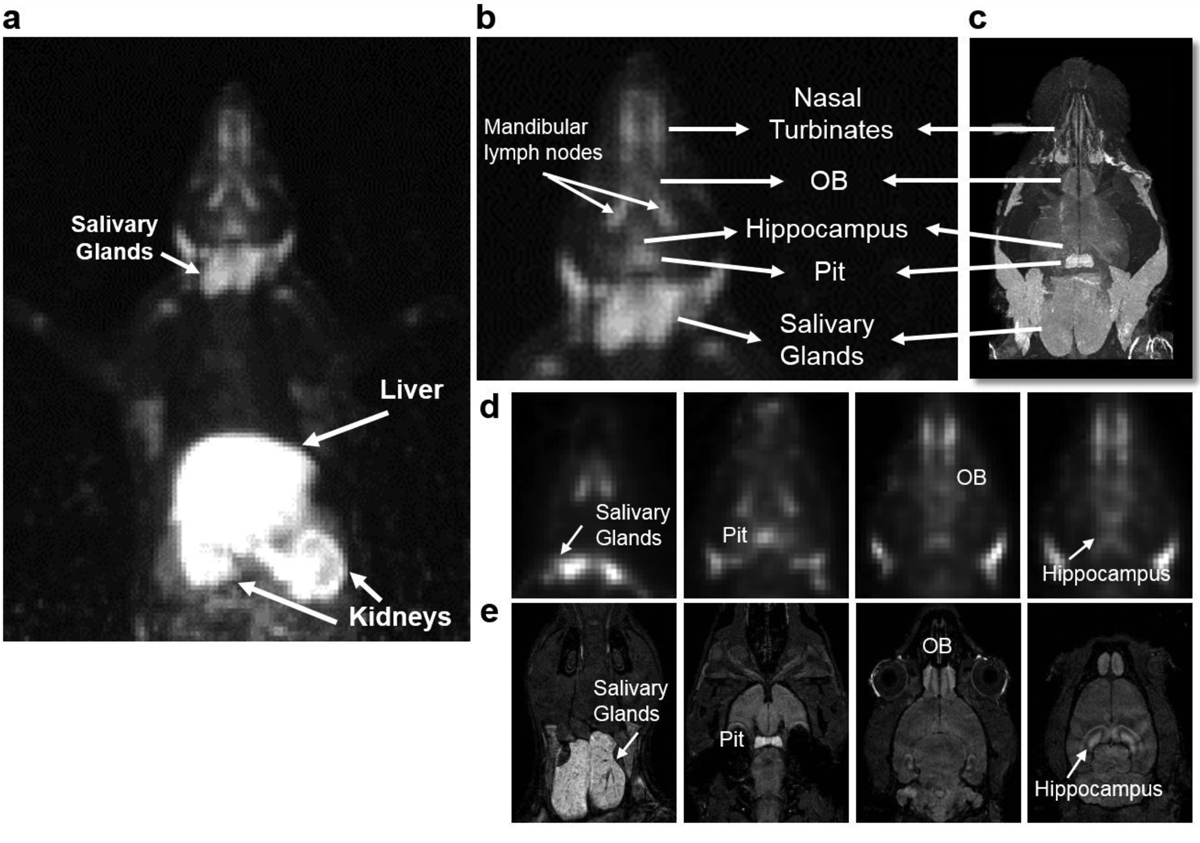
Whole body Mn-52 PET imaging in rats a whole body MIP image of a rat 48 h after IV infusion of ~7 MBq (0.2 mCi), [52Mn]Mn2+ (t1/2 = 5.6 days). Similar to [51Mn]Mn2+, [52Mn]Mn2+ is detected in the liver and kidneys. However, the longer half-life of [52Mn]Mn2+ allows visualization in the brain and head. b enlarged MIP image of the head area and c MRI image projection of rat’s head, 48 h after IV infusion of [52Mn]Mn2+ and Mn2+ respectively of two different rats. d PET and e MRI coronal images of different slices of the head. Manganese is detected in different areas of the brain: olfactory bulb (OB), pituitary gland (Pit) and hippocampus, and in salivary glands.
Mn-52 neuronal tract tracing
MEMRI has been used to track neuronal connections in the brain when administrated into specific brain areas in animals, in particular, into the nostril from which it can trace the olfactory pathway as far as the amygdala over several days [12]. [52Mn]Mn2+ was administered into the nostril of 4 monkeys at day 0 and PET images were obtained on different days and then co-registered with the corresponding MRI images. PET images on day 0 and day 7 for coronal slices going from the nose and through the brain following nasal administration of [52Mn]Mn2+ are shown in Fig. 5a. At day 0 the radiotracer is localized only in the nose. By day 7 the [52Mn]Mn2+ has traced into the brain, from the nose to the amygdala. The radiotracer follows the olfactory pathway, as can be seen in Fig. 5b with the comparison to the corresponding atlas slices [42]. The [52Mn]Mn2+ is traced to the olfactory bulb, the olfactory tract, olfactory nucleus, piriform cortex, the amygdala, and frontal cortex. This is in accordance with the olfactory pathway in the old world monkey previously described using electrophysiological studies [43] (see Fig. 49).
Fig. 5.
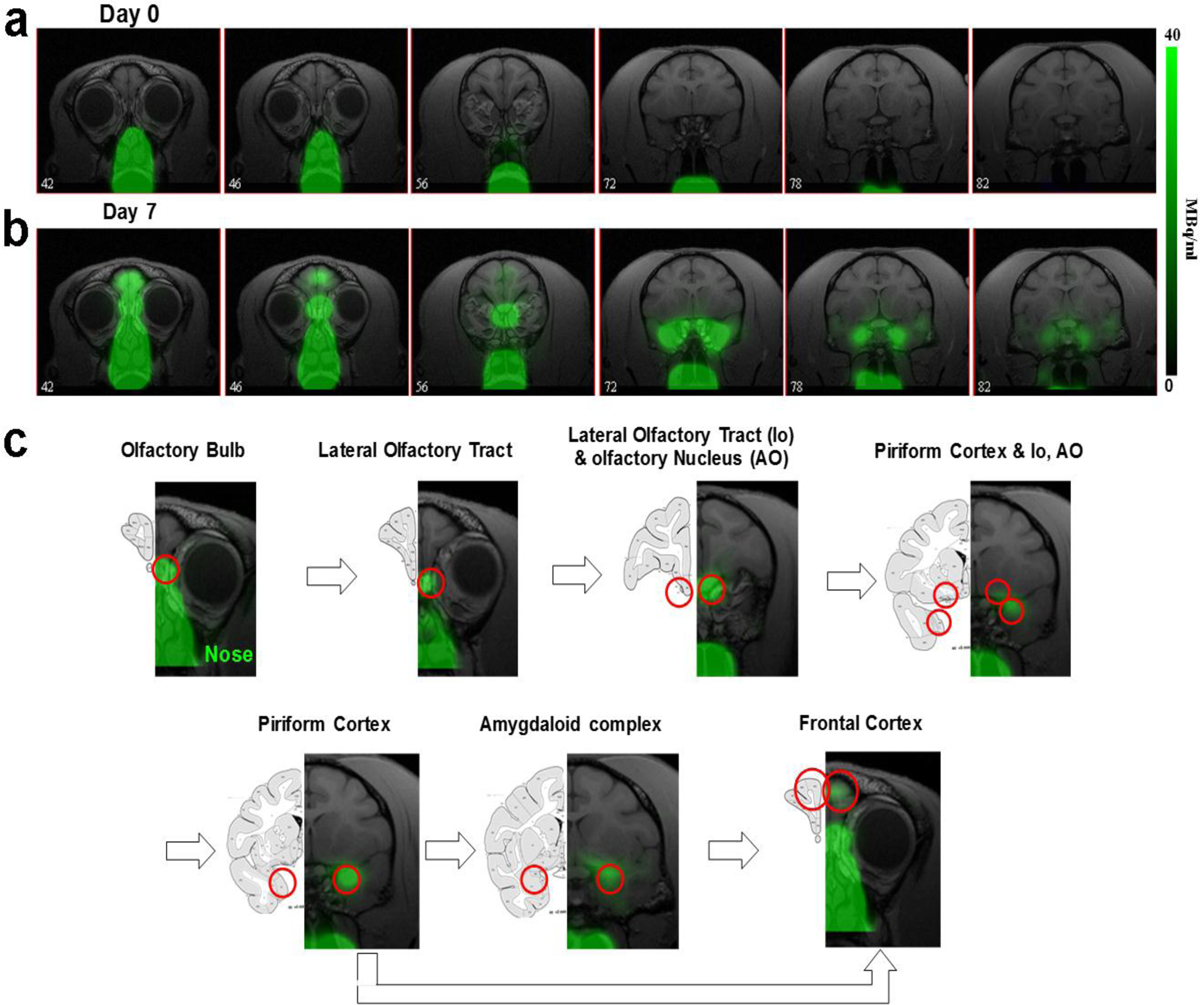
Mn-52 nasal administration in monkeys a PET images co-registered with MRI images from front to back immediately after (day 0) and 7 days after nasal administration of [52Mn]Mn2+. [52Mn]Mn2+ solution of 7–22 MBq (0.2–0.6 mCi) was administered to both nostrils on day 0 (total volume 0.5 ml). Immediately after [52Mn]Mn2+ administration the radioactivity is localized only to the nose area. By day 7 the [52Mn]Mn2+ traced into the brain from the nose to the amygdala. b Olfactory pathway in monkeys. PET images co-registered with MRI images following [52Mn]Mn2+ administration into the nostrils and the corresponding monkey atlas images [42]. [52Mn]Mn2+ administration to the nostrils traces the olfactory pathway from the nose to the OB, then to the olfactory tract, olfactory nucleus, piriform cortex, amygdala and the frontal cortex.
At the same PET scanning session, whole body PET imaging was also performed on each monkey to follow radiotracer distribution in the rest of the body, as shown in Fig. S2. Immediately after [52Mn]Mn2+ administration the radiotracer is localized in the nose area; however, some of the tracer was also swallowed and progressed along the esophagus to the stomach. One day later the majority of the swallowed manganese is cleared from the body via the digestive system and bladder with a small amount of manganese detectable in the liver and kidneys. Manganese continues to be cleared from the body through the digestive system and, by day 7, only a small amount can be detected in the liver and kidneys.
Fig. 6a shows the temporal progress of the radiotracer into the brain starting immediately after [52Mn]Mn2+ administration into the nostril until 7 days later, across all the monkeys studied. Immediately following administration, the tracer is visualized only in the nose. By day 1 it is seen in the OB, olfactory tract and olfactory nucleus. By day 3 it can be detected in the piriform cortex and by day 4 it has reached the amygdala. The intensity of tracer accumulation further increases in the piriform cortex and amygdala at days 6 and 7, when tracer is also detected in the frontal cortex. A summary of the results from the 4 studies is shown in Fig. 6b, where each study is represented by a different color. Over time, the [52Mn]Mn2+ moves deeper through the olfactory pathway.
Fig. 6.
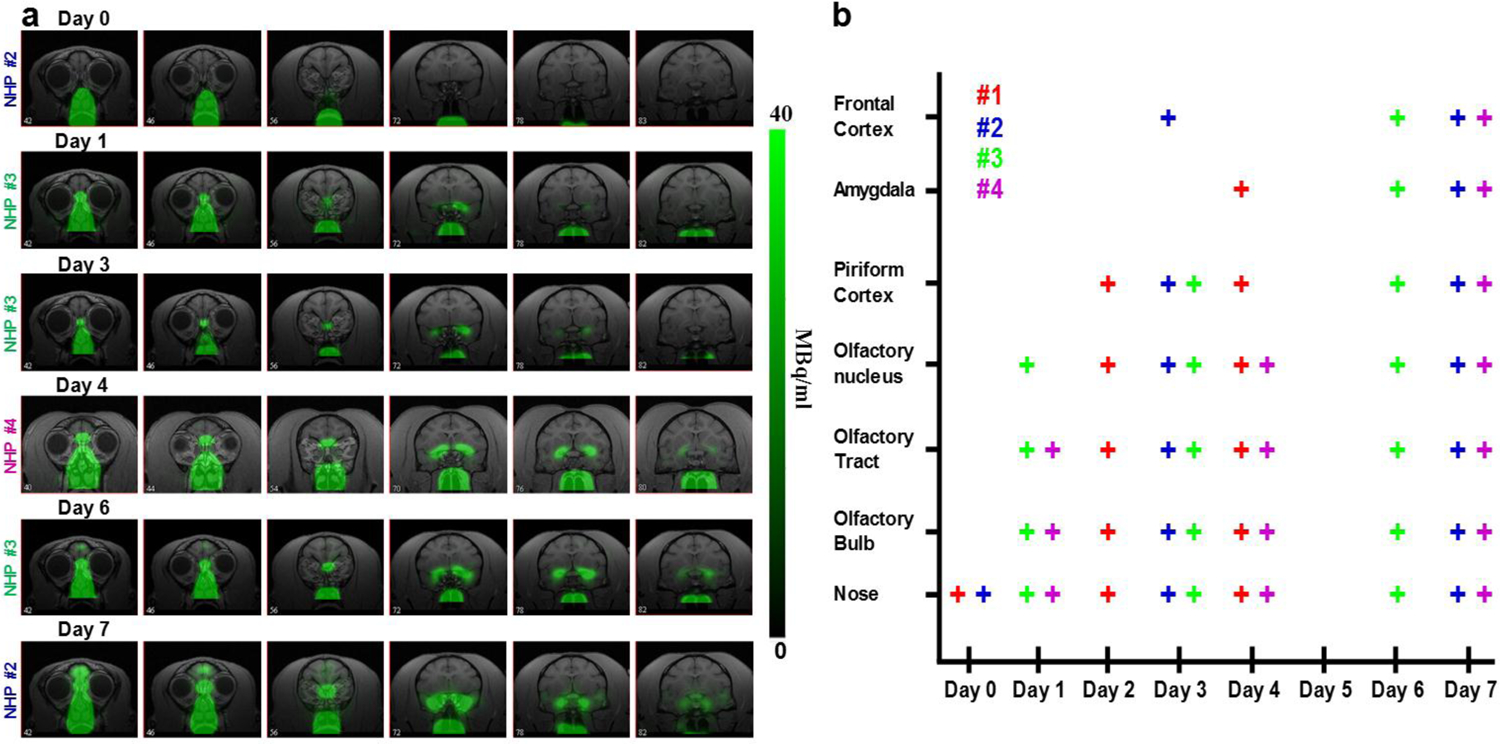
[52Mn]Mn2+ tracing of the olfactory pathway in monkeys a PET images co-registered with MRI images at different days, from day 0 to 7 days after [52Mn]Mn2+ administration into the nostrils of monkeys. At day 0, immediately after administration, the radiotracer is localized in the nose area with no activity in the brain. At day 1 it can be seen in the OB, olfactory tract and olfactory nucleus. By Day 3 it was detected in the piriform cortex and by day 4 it traced into the amygdala. The intensity of the tracer increased in the piriform cortex and amygdala at day 6 and 7, when the tracer was also detectable in the frontal cortex. b Summary of the tracing results for the 4 monkey studies. Each study is represented by a different color and each monkey was scanned on 3 different days between day 0, immediately after [52Mn]Mn2+ nasal administration, to day 7. ROIs were drawn on the relevant area of the brain and each + sign represents tracing above a threshold of 1% of the maximum intensity in the image, which was about 20–30 times above noise level. Note that monkeys were not all scanned on each day after day 0.
Discussion
This study demonstrates that manganese-based PET radiotracers behave in a manner similar to that of manganese when used as a contrast agent in MRI. This is true despite the 2000 fold lower concentration used (~100 mM Mn2+ for MRI compared to ~0.05 mM for PET). This indicates that the uptake and transport mechanisms are comparable. PET imaging with both [51Mn]Mn2+ and [52Mn]Mn2+ in rodents and monkeys demonstrated that the relative accumulation of radioactivity in different organs is similar to that observed in rodent MRI studies following systemic administration [1–4]. Furthermore, we have demonstrated the ability of [51Mn]Mn2+ to enter excitable cells and follow activity-induced accumulation in the pancreas after glucose stimulation and that [52Mn]Mn2+ can be used to trace neuronal connections analogous to MEMRI neuronal tract tracing studies [10, 12–13].
In this work, IV infusion of [51Mn]Mn2+ in both rats and monkeys shows high accumulation of the radiotracer in numerous body tissues, with the highest radioactivity in the liver, kidneys and then in the heart, with very little accumulation in the brain. These results are consistent with previous MRI studies in rodents [3–4]. Systemic administration of Mn-54 (t1/2 = 312.5 days) in mice and monkeys was also reported to result in high accumulation of manganese in the kidney, liver, heart, pancreas and salivary glands in the days following administration [23–24]. Interestingly, the pancreas showed the highest level of radiotracer after 24 h in mice and monkeys [24]. Recent studies with [52Mn]Mn2+ and [51Mn]Mn2+ also showed similar distribution of the radiotracer in the rodent body [33, 35, 44]. In the heart, the initial high activity in the cardiac chambers reflects blood pool activity. The clearance of manganese from the blood occurs over the course of few minutes [2, 24] which results in the manganese being visualized in the ventricular wall (Fig. 2).
The high uptake of manganese in the liver and kidneys following systemic administration of [51Mn]Mn2+ opens the possibility for functional imaging of these organs and study of hepatic and biliary clearance, the main pathway of manganese clearance [45]. Similar to MRI, Mn-PET may be useful for detecting metastases and tumors as cold spots in the liver, since they are not expected to show manganese uptake, and to study renal function and manganese excretion from the kidneys.
The pancreas is an organ that accumulates significant amounts of manganese following systemic administration of Mn2+ in MRI and in manganese radiotracer studies [4, 23–24]. β-cell function has been the focus of many studies due to the importance of this cell type in diabetes. The β-cells in the pancreas are responsible for the synthesis and secretion of insulin in response to the presence of glucose and their destruction or dysfunction is the cause of type 1 and type 2 diabetes. MEMRI studies have shown that infusion of glucose prior to manganese infusion increases manganese uptake in the pancreas and that the amount of manganese uptake depends on the amount of functioning β-cells in the pancreas [1]. Manganese enters β-cells through calcium channels and is taken up by glucose-activated β-cells [40–41]. Here we show in NHPs that when [51Mn]Mn2+ infusion followed a glucose infusion, tracer uptake increased in the pancreas. Glucose administration did not affect the accumulation of manganese in other organs, e.g. liver, kidneys and heart (see Fig. S1). This is in agreement with previously reported MRI results [1, 46]. The use of [51Mn]Mn2+ after glucose load for PET imaging may enable the detection of changes in β-cell function in diabetes. A simple activity ratio of pancreas to a reference tissue (such as kidney) may help assess β-cell function. A recent paper showed that [52Mn]Mn2+-PET can be used to follow manganese uptake in the mouse similar to MEMRI [35]. [52Mn]Mn2+ pancreatic uptake in a type 1 diabetes mouse model decreased significantly compared to control mice while no effect on [52Mn]Mn2+ uptake was seen in other organs. In the pre-type 2 diabetes mouse model, that exhibits a higher functional β-cells mass, a significant increase in [52Mn]Mn2+ uptake was observed. Future studies will incorporate the shorter half-life radiotracer [51Mn]Mn2+ to study the loss of β-cells in the pancreas of animal models of diabetes as well as glucose response, to further explore the applications of Mn-PET for imaging of pancreatic function. The use of Mn-51, with its much shorter half-life compare to that of Mn-52 (46 min vs. 5.6 days), will facilitate rapid repeat scans with lower radiation exposure, especially in humans.
The ability of [51Mn]Mn2+ to image increased activity of pancreatic β-cells suggests a variety of functional studies in other organs. For example, manganese distribution in the heart was previously used to monitor inotropic states and to study cardiac viability using MRI [2, 8]. As Mn2+ primarily enters cardiac cells through voltage-gated calcium channels, the rate of influx into the heart can be altered under conditions that increase or decrease myocardial calcium influx. Thus, β-adrenergic agents were shown to increase signal intensity enhancement due to the increased calcium influx. Conversely, calcium channel blockers were shown to decrease the signal intensity enhancement in mice [8]. Moreover, the rapid blood pool clearance of the radiotracer and its long retention in the myocardium make it an attractive candidate tracer for PET myocardial imaging. [51Mn]Mn2+ may be used to evaluate heart function and viability under different conditions such as ischemia. It should also be possible to infuse [51Mn]Mn2+ during a stress test in one clinical setting and then transfer the patient to the PET for imaging of cardiac distribution. Indeed, Mn-52m (t1/2 = 21.1 min) was suggested as a potential myocardial imaging agent for PET [30–31] and was shown to detect infarct areas in the dog heart [30].
MEMRI studies in rodents has shown that the final distribution of manganese inside the brain following systemic administration is achieved after about 24 h [5, 47]. Therefore, due to its relatively short half-life of 46.2 min, Mn-51 cannot be used to study manganese accumulation in the brain. This was seen in both rat and monkey, where almost no activity was detected in the first 2 h (Fig. 1a and Fig. 2a). However, Mn-52 is suitable for detecting brain structures, due to its 5.6 days half-life, and can be used to image brain anatomy and function and to study pathophysiological conditions. [52Mn]Mn2+ infusion in the rat showed that in addition to the tracer accumulation in the body, [52Mn]Mn2+ was visualized in the brain and head. There was high accumulation of tracer in the nasal turbinates, pituitary, OB, hippocampus and salivary glands. However, due to the low resolution of PET imaging and the small size of the rat, a more detailed distinction of brain areas was not possible. In an in vivo [52Mn]Mn2+ PET imaging study, Brunnquell et.al [33] measured brain uptake of [52Mn]Mn2+ only 4 hours after IV infusion in rats, which remained visible 3 days later. However, their measurements were performed on the whole brain. This included activity in the pituitary gland, which is known to accumulate manganese in the first few hours following Mn2+ administration, due to its lack of blood brain barrier (BBB) [5]. Studies with Mn-54 in monkey showed high accumulation of the tracer in pituitary and salivary glands within 2 hours after administration, while tissues in the brain retained the Mn-54 for the longest time compare to most other tissues [23].
[52Mn]Mn2+ administration into the nostrils of monkeys demonstrates that Mn-PET can be used to trace neuronal pathways in a manner similar to MEMRI. Tjalve et al [26] used nasal administration of Mn-54 in rats to study the neuronal uptake of manganese through the olfactory pathway over several days. They showed that the olfactory pathway is a route through which manganese can access the brain, by uptake via the olfactory neurons and its migration via secondary and tertiary olfactory pathways into downstream areas. However, the use of Mn-54 required dissecting the brain. Nasal administration of manganese at MRI doses allowed for in vivo imaging of the olfactory pathway [10]. Here it is shown that nasal [52Mn]Mn2+ administration in monkeys allows tracing of the olfactory pathway over the course of a few days [10, 12]. After administration, manganese is evident only in the nose area with no uptake in the brain. Subsequent radiotracer accumulation in the brain is the result of tracing of neuronal connections along the olfactory pathway. Four days after administration, the manganese could be traced to the amygdala similar to MEMRI results [12]. Connections to the prefrontal areas could also be detected after a few days. In a recent paper, Mn-52 was used to image the dopaminergic and striatonigral pathways in rats 24 h after tracer injection into the ventral tegmental area and the dorsal striatum, respectively [37]. The ability to follow neuronal connections in the brain following targeted administration of [52Mn]Mn2+ to a specific area can be expanded to many other neuronal pathways that have been demonstrated with MEMRI, e.g. visual pathway or basal ganglia pathways [10–11, 14].
Nasal administration of manganese indirectly demonstrated the ability to image the clearance of Mn2+ from the body. After [52Mn]Mn2+ nasal administration, some of the radiotracer was apparently swallowed and moved along the esophagus to the stomach. It is possible that [52Mn]Mn2+ was taken into the circulatory system through the nose as well. It would be beneficial to minimize the amount of tracer swallowed either by reducing the volume of tracer solution or by using a better delivery system such as nasal spray used to deliver pharmacological drugs in humans. Most of the swallowed radiotracer was cleared from the monkey’s body through the digestive system by 3 days after administration (Fig. S2). As the main pathway of manganese clearance from the body is through the biliary system and the intestines, whole body Mn-52 PET imaging following swallowing of manganese may be of interest for future studies of clearance of manganese from the body.
The major limitation of manganese as an MRI contrast agent in humans is its cellular toxicity and therefore the need to use as low a dose as possible. The FDA-approved doses of Mn2+ contrast agents limit the use of MRI. Here we showed that the higher sensitivity of PET over MRI enables the use of lower concentrations of manganese that may be applied for human studies. However, future use of Mn-PET in human studies may be limited by the dose and availability of the radiotracers. A recent study with Mn-51 reported dosimetry calculations of the effective dose equivalent (EDE) for standard adult male and female. For IV injection of the typical clinical dose of 370 MBq (10 mCi), Mn-51 was found to have an EDE of ~15 mSv, which is comparable to the average dose used in FDG studies, of 14.1 mSv [44]. For local administration of Mn-52, more calculations are needed and dosimetry studies will be performed in the future. Despite the long half-life of Mn-52 it should be feasible for clinical use as it is similar to I-124 and I-131, with half-life of 4 and 8 days, respectively, which are used in humans specifically for thyroid applications, and as there is currently no other way to unambiguously trace direct connections in the human brain, making it interesting to pursue the use of Mn-52. Moreover, as opposed to the commonly used F-18 and C-11 radiotracers, manganese radionuclides are harder to produce, due to both the low availability of the target materials and the higher cyclotron energy and longer time needed to produce them. This may influence mostly studies with Mn-51, that need to be performed close to tracer production centers. Due to its longer half-life, Mn-52 can be shipped over long distance from the production center to imaging sites. However, further dosimetry calculations need to be performed to move these manganese radiotracers to clinical settings.
Another disadvantage of manganese radiotracers for PET compared to manganese as an MRI contrast agent is the lower resolution of PET. Together with partial volume effects and the small size of the rat, the relatively low resolution of PET limits our ability to study tracer distribution in rodents, especially for small organs such as the pancreas and specific areas in the brain. Thus, the larger NHP model was chosen to investigate additional aspects of Mn-PET. However, even in the NHPs partial volume effect is common especially for small organs like the pancreas. Mn-51 PET’s effective resolution is about 5.5 mm while the cross section of the NHP pancreas was about 10 mm as measured from the CT. The lower resolution of PET also prevents our ability to detect cytoarchitecture and fine structure in the brain and other organs in the body.
There is recent interest in PET/MRI systems that can be used for high resolution MRI image registration with PET. In particular, it can be beneficial for brain imaging in humans, where it may be possible for Mn-52 to be used to detect morphological and neuronal connection changes associated with neurodegenerative diseases over time. For example, Mn-52 PET can be used for brain imaging in multiple sclerosis patients, where the BBB in affected areas is disrupted; this allows Mn2+ to enter the brain tissue faster and enhances manganese accumulation in lesions. Moreover, tracing from the lesion may quantitate the extent of tissue damage, as less manganese is expected to transport along damaged neuronal connections. In patients with traumatic brain injury it may be useful both to assess the integrity of areas of BBB and to study the effects on brain connectivity after injury. Mn-PET may also potentially be used to map [52Mn]Mn2+ uptake in active brain areas after stimulation in a manner that can give complementary information for fMRI studies. Rodent studies with long stimulation times in the presence of Mn2+ prior to imaging, showed high activity in stimulated areas such as motor cortex and auditory area, which were similar to BOLD fMRI results [48–49].
Conclusions
Low manganese concentration doses of the radiotracers, [51Mn]Mn2+ and [52Mn]Mn2+, for PET imaging behave, in both rats and monkeys, in a manner similar to manganese ions in MEMRI studies that use much higher doses. This opens a wide variety of potential applications for their use in both pre-clinical and clinical studies to determine anatomy, function and neuronal connectivity. This includes the detection of heart ischemia, liver metastases, tumors, and the assessment of renal and pancreatic function as well as imaging of neurodegeneration by tracking changes in neuronal connections.
Supplementary Material
Acknowledgments
This research was supported (in part) by the Intramural Research Program of the NIH, NINDS. We thank Nadia Bouraoud and Kathy Sharer for assistance with animal procedures and animal handling. We thank the NIH PET Department for providing excellent technical support and for production of the PET radiotracers. We thank Dr. Baris Turkbey and Dr. Dima Hammoud for their help with CT registration.
Footnotes
conflict of interest statement
The authors declare that they have no conflict of interest.
References
- 1.Antkowiak PF, Tersey SA, Carter JD, et al. (2009) Noninvasive assessment of pancreatic beta-cell function in vivo with manganese-enhanced magnetic resonance imaging. Am J Physiol Endocrinol Metab 296:E573–578. [DOI] [PMC free article] [PubMed] [Google Scholar]
- 2.Hu TC, Christian TF, Aletras AH, Taylor JL, Koretsky AP, Arai AE (2005) Manganese enhanced magnetic resonance imaging of normal and ischemic canine heart. Magn Reson Med 54:196–200. [DOI] [PubMed] [Google Scholar]
- 3.Kang YS, Gore JC (1984) Studies of tissue NMR relaxation enhancement by manganese. Dose and time dependences. Invest Radiol 19:399–407. [DOI] [PubMed] [Google Scholar]
- 4.Ni Y, Petre C, Bosmans H, et al. (1997) Comparison of manganese biodistribution and MR contrast enhancement in rats after intravenous injection of MnDPDP and MnCl2. Acta Radiol 38:700–707. [DOI] [PubMed] [Google Scholar]
- 5.Aoki I, Wu YJ, Silva AC, Lynch RM, Koretsky AP (2004) In vivo detection of neuroarchitecture in the rodent brain using manganese-enhanced MRI. Neuroimage 22:1046–1059. [DOI] [PubMed] [Google Scholar]
- 6.Watanabe T, Natt O, Boretius S, Frahm J, Michaelis T (2002) In vivo 3D MRI staining of mouse brain after subcutaneous application of MnCl2. Magn Reson Med 48:852–859. [DOI] [PubMed] [Google Scholar]
- 7.Aoki I, Tanaka C, Takegami T, et al. (2002) Dynamic activity-induced manganese-dependent contrast magnetic resonance imaging (DAIM MRI). Magn Reson Med 48:927–933. [DOI] [PubMed] [Google Scholar]
- 8.Hu TC, Pautler RG, MacGowan GA, Koretsky AP (2001) Manganese-enhanced MRI of mouse heart during changes in inotropy. Magn Reson Med 46:884–890. [DOI] [PubMed] [Google Scholar]
- 9.Lin YJ, Koretsky AP (1997) Manganese ion enhances T1-weighted MRI during brain activation: an approach to direct imaging of brain function. Magn Reson Med 38:378–388. [DOI] [PubMed] [Google Scholar]
- 10.Pautler RG, Silva AC, Koretsky AP (1998) In vivo neuronal tract tracing using manganese-enhanced magnetic resonance imaging. Magn Reson Med 40:740–748. [DOI] [PubMed] [Google Scholar]
- 11.Watanabe T, Michaelis T, Frahm J (2001) Mapping of retinal projections in the living rat using high-resolution 3D gradient-echo MRI with Mn2+-induced contrast. Magn Reson Med 46:424–429. [DOI] [PubMed] [Google Scholar]
- 12.Chuang KH, Koretsky AP (2009) Accounting for nonspecific enhancement in neuronal tract tracing using manganese enhanced magnetic resonance imaging. Magn Reson Imaging 27:594–600. [DOI] [PMC free article] [PubMed] [Google Scholar]
- 13.Cross DJ, Minoshima S, Anzai Y, et al. (2004) Statistical mapping of functional olfactory connections of the rat brain in vivo. Neuroimage 23:1326–1335. [DOI] [PubMed] [Google Scholar]
- 14.Murayama Y, Weber B, Saleem KS, Augath M, Logothetis NK (2006) Tracing neural circuits in vivo with Mn-enhanced MRI. Magn Reson Imaging 24:349–358. [DOI] [PubMed] [Google Scholar]
- 15.Van der Linden A, Verhoye M, Van Meir V, et al. (2002) In vivo manganese-enhanced magnetic resonance imaging reveals connections and functional properties of the songbird vocal control system. Neuroscience 112:467–474. [DOI] [PubMed] [Google Scholar]
- 16.Allegrini PR, Wiessner C (2003) Three-dimensional MRI of cerebral projections in rat brain in vivo after intracortical injection of MnCl2. NMR Biomed 16:252–256. [DOI] [PubMed] [Google Scholar]
- 17.Tucciarone J, Chuang KH, Dodd SJ, Silva A, Pelled G, Koretsky AP (2009) Layer specific tracing of corticocortical and thalamocortical connectivity in the rodent using manganese enhanced MRI. Neuroimage 44:923–931. [DOI] [PMC free article] [PubMed] [Google Scholar]
- 18.Saleem KS, Pauls JM, Augath M, et al. (2002) Magnetic resonance imaging of neuronal connections in the macaque monkey. Neuron 34:685–700. [DOI] [PubMed] [Google Scholar]
- 19.Pautler RG, Mongeau R, Jacobs RE (2003) In vivo trans-synaptic tract tracing from the murine striatum and amygdala utilizing manganese enhanced MRI (MEMRI). Magn Reson Med 50:33–39. [DOI] [PubMed] [Google Scholar]
- 20.Federle MP, Chezmar JL, Rubin DL, et al. (2000) Safety and efficacy of mangafodipir trisodium (MnDPDP) injection for hepatic MRI in adults: results of the U.S. multicenter phase III clinical trials (safety). J Magn Reson Imaging 12:186–197. [DOI] [PubMed] [Google Scholar]
- 21.Skjold A, Amundsen BH, Wiseth R, et al. (2007) Manganese dipyridoxyl-diphosphate (MnDPDP) as a viability marker in patients with myocardial infarction. J Magn Reson Imaging 26:720–727. [DOI] [PubMed] [Google Scholar]
- 22.Schima W, Fugger R, Schober E, et al. (2002) Diagnosis and staging of pancreatic cancer: comparison of mangafodipir trisodium-enhanced MR imaging and contrast-enhanced helical hydro-CT. AJR Am J Roentgenol 179:717–724. [DOI] [PubMed] [Google Scholar]
- 23.Dastur DK, Manghani DK, Raghavendran KV (1971) Distribution and fate of 54Mn in the monkey: studies of differnnt parts of the central nervous system and other organs. J Clin Invest 50:9–20. [DOI] [PMC free article] [PubMed] [Google Scholar]
- 24.Lyden A, Larsson BS, Lindquist NG (1983) Autoradiography of manganese: accumulation and retention in the pancreas. Acta Pharmacol Toxicol (Copenh) 52:205–210. [DOI] [PubMed] [Google Scholar]
- 25.Sloot WN, Gramsbergen JB (1994) Axonal transport of manganese and its relevance to selective neurotoxicity in the rat basal ganglia. Brain Res 657:124–132. [DOI] [PubMed] [Google Scholar]
- 26.Tjalve H, Henriksson J, Tallkvist J, Larsson BS, Lindquist NG (1996) Uptake of manganese and cadmium from the nasal mucosa into the central nervous system via olfactory pathways in rats. Pharmacol Toxicol 79:347–356. [DOI] [PubMed] [Google Scholar]
- 27.Takeda A, Kodama Y, Ishiwatari S, Okada S (1998) Manganese transport in the neural circuit of rat CNS. Brain Res Bull 45:149–152. [DOI] [PubMed] [Google Scholar]
- 28.Mena I, Marin O, Fuenzalida S, Cotzias GC (1967) Chronic manganese poisoning. Clinical picture and manganese turnover. Neurology 17:128–136. [DOI] [PubMed] [Google Scholar]
- 29.Mahoney JP, Small WJ (1968) Studies on manganese. 3. The biological half-life of radiomanganese in man and factors which affect this half-life. J Clin Invest 47:643–653. [DOI] [PMC free article] [PubMed] [Google Scholar]
- 30.Atkins HL, Som P, Fairchild RG, et al. (1979) Myocardial positron tomography with manganese-52m. Radiology 133:769–774. [DOI] [PubMed] [Google Scholar]
- 31.Chauncey DM Jr., Schelbert HR, Halpern SE, et al. (1977) Tissue distribution studies with radioactive manganese: a potential agent for myocardial imaging. J Nucl Med 18:933–936. [PubMed] [Google Scholar]
- 32.Topping GJ, Schaffer P, Hoehr C, Ruth TJ, Sossi V (2013) Manganese-52 positron emission tomography tracer characterization and initial results in phantoms and in vivo. Med Phys 40:042502. [DOI] [PubMed] [Google Scholar]
- 33.Brunnquell CL, Hernandez R, Graves SA, et al. (2016) Uptake and retention of manganese contrast agents for PET and MRI in the rodent brain. Contrast Media Mol Imaging 11:371–380. [DOI] [PMC free article] [PubMed] [Google Scholar]
- 34.Graves SA, Hernandez R, Fonslet J, et al. (2015) Novel Preparation Methods of (52)Mn for ImmunoPET Imaging. Bioconjug Chem 26:2118–2124. [DOI] [PMC free article] [PubMed] [Google Scholar]
- 35.Hernandez R, Graves SA, Gregg T, et al. (2017) Radiomanganese PET Detects Changes in Functional beta-cell Mass in Mouse Models of Diabetes. Diabetes. [DOI] [PMC free article] [PubMed] [Google Scholar]
- 36.Topping GJ, Yung A, Schaffer P, et al. (2017) Manganese Concentration Mapping in the Rat Brain with MRI, PET, and Autoradiography. Med Phys. [DOI] [PubMed] [Google Scholar]
- 37.Napieczynska H, Severin GW, Fonslet J, et al. (2017) Imaging neuronal pathways with 52Mn PET: Toxicity evaluation in rats. Neuroimage 158:112–125. [DOI] [PubMed] [Google Scholar]
- 38.Klein ATJ, Rosch F, Coenen HH, Qaim SM (2002) Production of the positron emitter Mn-51 via the Cr-50(d, n) reaction: targetry and separation of no-carrier-added radiomanganese. Radiochimica Acta 90:167–177. [Google Scholar]
- 39.Sastri CS, Petri H, Kueppers G, Erdtmann G (1981) Production of Mn-52 of High Isotopic Purity by He-3-Activation of Vanadium. International Journal of Applied Radiation and Isotopes 32:246–247. [Google Scholar]
- 40.Gimi B, Leoni L, Oberholzer J, et al. (2006) Functional MR microimaging of pancreatic beta-cell activation. Cell Transplant 15:195–203. [DOI] [PubMed] [Google Scholar]
- 41.Leoni L, Serai SD, Haque ME, Magin RL, Roman BB (2010) Functional MRI characterization of isolated human islet activation. NMR Biomed 23:1158–1165. [DOI] [PubMed] [Google Scholar]
- 42.Martin RF, Bowden DM (2000) Primate Brain Maps: Structure of the Macaque Brain. Elsevier © 2000 University of Washington. [Google Scholar]
- 43.Takagi SF (1986) Studies on the olfactory nervous system of the Old World monkey. Prog Neurobiol 27:195–250. [DOI] [PubMed] [Google Scholar]
- 44.Graves SA, Hernandez R, Valdovinos HF, et al. (2017) Preparation and in vivo characterization of 51MnCl2 as PET tracer of Ca2+ channel-mediated transport. Sci Rep 7:3033. [DOI] [PMC free article] [PubMed] [Google Scholar]
- 45.Aschner M, Erikson KM, Dorman DC (2005) Manganese dosimetry: Species differences and implications for neurotoxicity. Critical Reviews in Toxicology 35:1–32. [DOI] [PubMed] [Google Scholar]
- 46.Nagata M, Kagawa T, Koutou D, Matsushita T, Yamazaki Y, Murase K (2011) Measurement of manganese content in various organs in rats with or without glucose stimulation. Radiol Phys Technol 4:7–12. [DOI] [PubMed] [Google Scholar]
- 47.Lee JH, Silva AC, Merkle H, Koretsky AP (2005) Manganese-enhanced magnetic resonance imaging of mouse brain after systemic administration of MnCl2: dose-dependent and temporal evolution of T1 contrast. Magn Reson Med 53:640–648. [DOI] [PubMed] [Google Scholar]
- 48.Yu X, Zou J, Babb JS, Johnson G, Sanes DH, Turnbull DH (2008) Statistical mapping of sound-evoked activity in the mouse auditory midbrain using Mn-enhanced MRI. Neuroimage 39:223–230. [DOI] [PMC free article] [PubMed] [Google Scholar]
- 49.Eschenko O, Canals S, Simanova I, Beyerlein M, Murayama Y, Logothetis NK (2010) Mapping of functional brain activity in freely behaving rats during voluntary running using manganese-enhanced MRI: implication for longitudinal studies. Neuroimage 49:2544–2555. [DOI] [PubMed] [Google Scholar]
Associated Data
This section collects any data citations, data availability statements, or supplementary materials included in this article.