Abstract
Aging causes a decline in tissue regeneration due to a loss of function in adult stem and progenitor cell populations1. An important example is the deterioration of the regenerative capacity of the widespread and abundant population of central nervous system (CNS) multipotent stem cells known as oligodendrocyte progenitor cells (OPCs)2. A relatively overlooked potential source for this loss of function is the stem cell niche, a source of cell-extrinsic cues including chemical and mechanical signalling3,4. In this study, we show that the OPC microenvironment stiffens with age, and that this stiffening is sufficient to cause age-related OPC loss of function. Using biological and novel synthetic scaffolds to mimic the stiffness of young brain we find that isolated aged OPCs (aOPCs) cultured on these scaffolds are molecularly and functionally rejuvenated. When we disrupt mechanical signalling, OPC proliferation and differentiation rates are increased. We identify the mechanoresponsive ion channel Piezo1 as a key mediator of OPC mechanical signalling. Inhibition of Piezo1 overrides mechanical signals in vivo and allows OPCs to maintain activity in the aging CNS. We also show that Piezo1 plays an important role in regulating cell number during CNS development. Thus, we show that tissue stiffness is an important regulator of aging in OPCs, and provide new insights into how adult stem and progenitor cell function changes with age. These findings are of fundamental importance not only for the development of regenerative therapies but also for understanding the aging process itself.
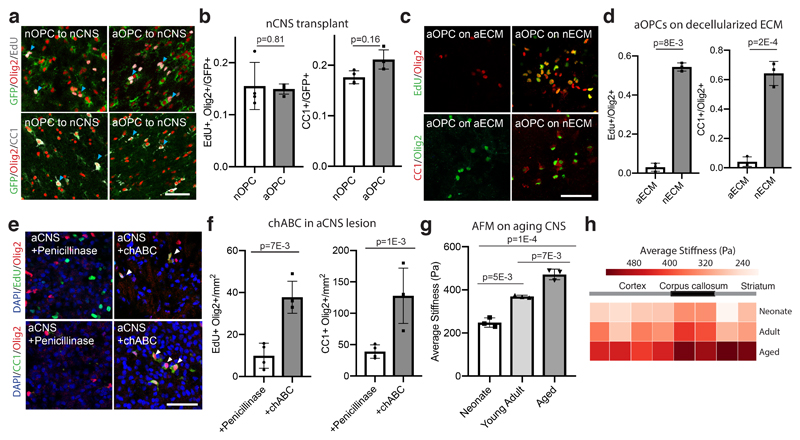
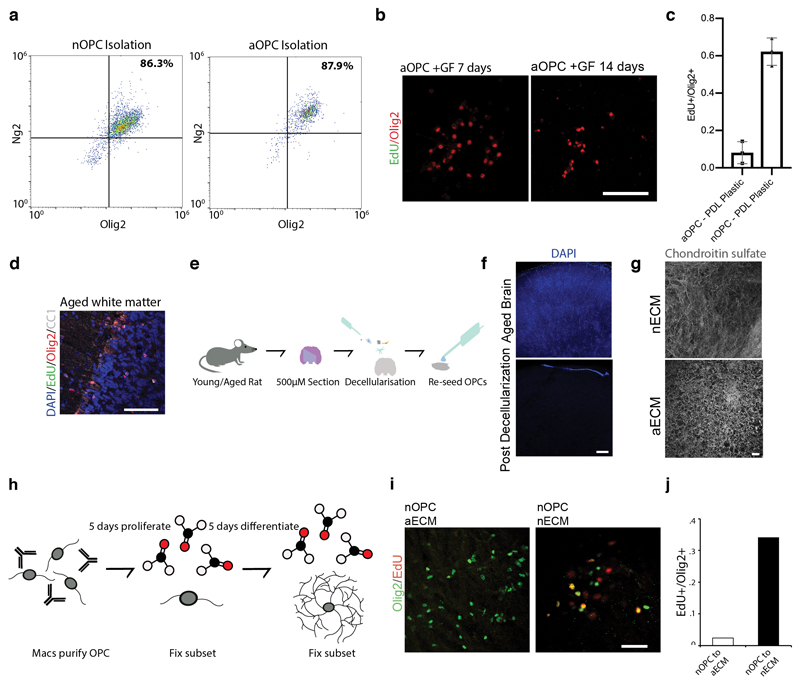
It is widely thought that loss of growth factor exposure underlies progenitor cell quiescence in aging5. To test this, we purified neonatal and aged adult rat OPCs (nOPCs and aOPCs, Extended Data Fig. 1a) and cultured them in conditions known to enable self-renewal of nOPCs6. After long term culture, in contrast to nOPCs that showed high levels of proliferation, aOPCs showed very low levels of proliferation (Extended Data Fig. 1b-c). To determine whether this loss of function in aOPCs is reversible, we transplanted aOPCs into the prefrontal cortex of neonatal rats and found that aOPCs gained the capacity to both proliferate and differentiate at rates comparable to transplanted neonate controls (Fig. 1a-b). By comparison, there were few proliferating progenitors in the CNS of the aged litter-mates (Extended Data Fig. 1d). Thus, aOPCs can become activated in the neonatal niche, but not in their native niche.
Figure 1. The CNS niche stiffens with aging and the neonate niche restores the function of aOPCs.
a-b, Representative images and quantifications of the proliferation and differentiation rates of transplanted nOPCs and aOPCs in N=3 neonate prefrontal cortex 14 days following transplantation. Blue arrows highlight example positive cells. c-d, Representative images and quantifications of the proliferation and differentiation rates of aOPCs seeded onto both nECM and aECM. e-f, Representative images of proliferating and differentiating cells per mm2 of CCP lesion cores 14 days post lesion and 7 days post direct injection of penicillinase/chABC into N=4 aged females. g-h, Global stiffness K (Pa) of brains at different ages determined by AFM indentation measurements. Means of 3 sections from 3 animals each are shown. Regional mean stiffness values calculated by mapping AFM measurements to brain slice. Averages represent the mean of biological replicates, error bars represent standard deviation, and p-value is calculated by one-way ANOVA. Throughout figure, scale bars represent 50μM.
The niche is a factor in OPC aging3,7; therefore, we next asked if changes in the tissue microenvironment underlie the observed differences in OPC age state. To address this, we seeded aOPCs on both neonatal and aged decellularized brain extracellular matrix (nECM and aECM, Extended Data Fig. 1e-h). aOPCs seeded on nECM showed a 10-fold increase in proliferation rate and ability to differentiate compared to aOPCs seeded on aECM (Fig. 1c-d). Conversely, nOPCs lost their proliferative capacity when seeded on aECM (Extended Data Fig. 1i-j). These results indicate that the aging ECM has an important role in impairing the function of aging OPCs. Thus, we hypothesized that digesting the ECM of the aCNS using chondroitinase ABC (chABC)7 would activate aOPCs. To test the effect on differentiation in aged rats, we used a well-established model of focal areas of demyelination (Supplementary Information). Following injection of chABC, there was a ~3-fold increase in both OPC proliferation and differentiation (Fig. 1e-f), further underlining the importance of the niche in OPC aging.
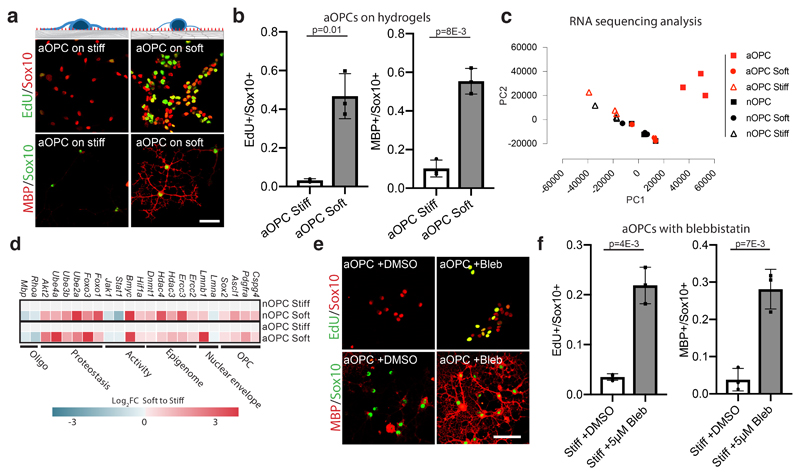
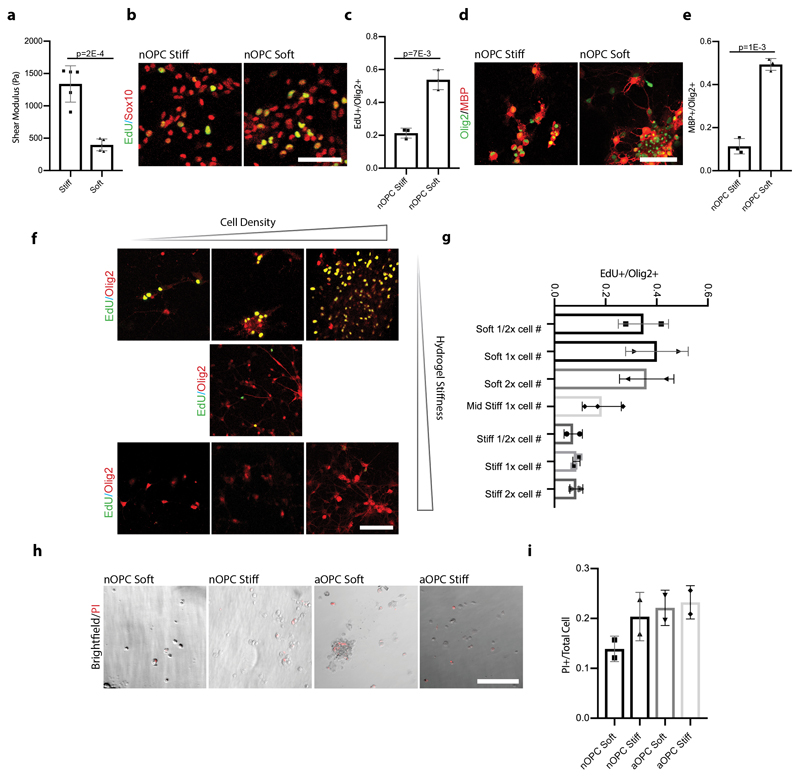
We then hypothesized that ECM stiffness might play a role in OPC loss-of-function. First, we confirmed with atomic force microscopy (AFM) that the prefrontal cortex progressively stiffened with aging (Fig. 1g-h). We then developed polyacrylamide hydrogels to mimic the stiffening of the ECM with age. These novel hydrogels were invented to decouple ECM composition and stiffness, enabling the investigation of cellular changes due to mechanical signals alone. As expected, aOPCs proliferated and differentiated poorly on stiff hydrogels. However, proliferation and differentiation of aOPCs plated on soft hydrogels increased more than ten-fold (Fig. 2a-b, Extended Data Fig. 2). In contrast, nOPCs lost their capacity to proliferate and differentiate on stiff substrates (Extended Data Fig. 2b-e). Taken together, these results suggest that the ‘cellular activity’ of OPCs is predominantly regulated not by the age of the cell or ECM chemistry, but by ECM stiffness.
Figure 2. A soft environment mimicking the stiffness of neonatal CNS tissue alone can restore the function of aOPCs.
a-b, Schematic represents OPCs cultured on stiffness-tuned hydrogels, along with representative images and quantifications of the proliferation and differentiation rates of aOPCs seeded on the substrates. Scale bar represents 40μm. c, Principal component analysis (PCA) for RNA sequencing differential gene expression analysis. The PCA was performed on the FPKM values for N=3 each of the six biological conditions, which are indicated in sidebar of panel. d, Analysis for genes involved in OPC and stem cell activation, proteostasis, and genetic and epigenetic stability as shown by mean FKPM of individual genes. e-f, Representative images and quantifications of N=3 biological replicates of the effects of blebbistatin on the proliferation and differentiation rates of aOPCs in vitro. Scale bar represents 50μm. Averages represent the mean of biological replicates, error bars represent standard deviation, and p-value is calculated by one-way ANOVA.
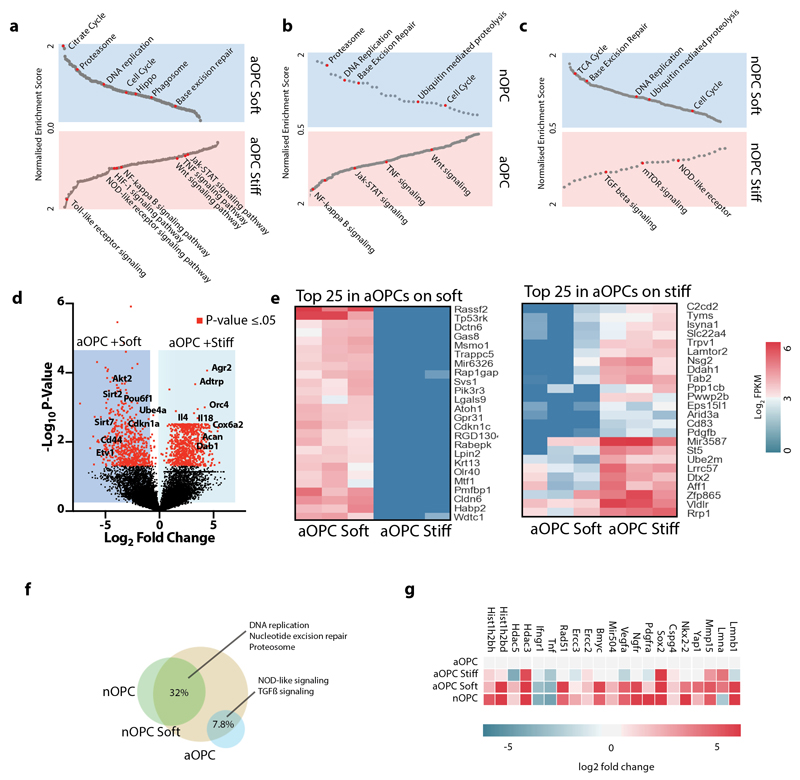
To further investigate if the soft environment pushes the identity of aOPCs closer to that of nOPCs, we performed RNA sequencing of aOPCs and nOPCs that were either acutely isolated or seeded on hydrogels. We found that aOPCs and nOPCs cultured on soft hydrogels transcriptomically resembled freshly isolated nOPCs more closely than aOPCs and nOPCs cultured on stiff hydrogels (Fig. 2c). We also found that enriched pathways overlap with pathways involved in aging such as metabolism, cell cycle, inflammation, and DNA stability1 (Extended Data Fig. 3a-c). Furthermore, the gene sets most significantly increased in expression in OPCs seeded on soft over stiff hydrogels were involved in known age-related pathways such as proteostasis, metabolism, DNA replication, and DNA repair (Fig. 2d, Extended Data 3d-g). Thus, a soft environment holistically reinstates transcriptional programs associated with reversal of the aging process. Together with the increase in proliferation and differentiation on soft hydrogels, our results show that a soft environment rejuvenates aOPCs.
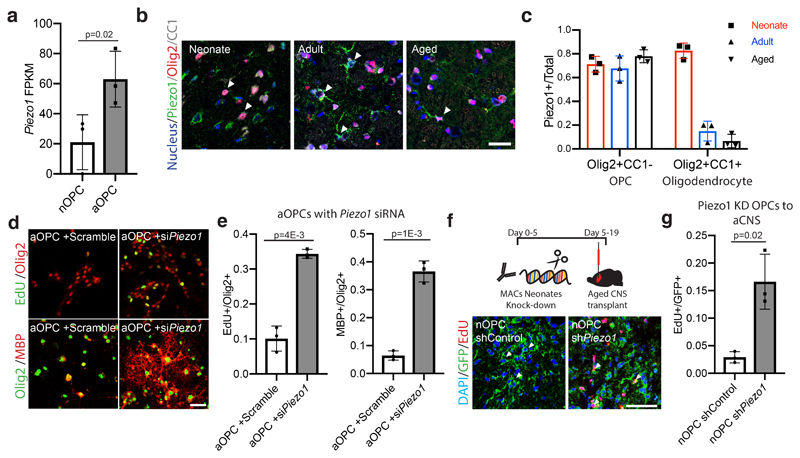
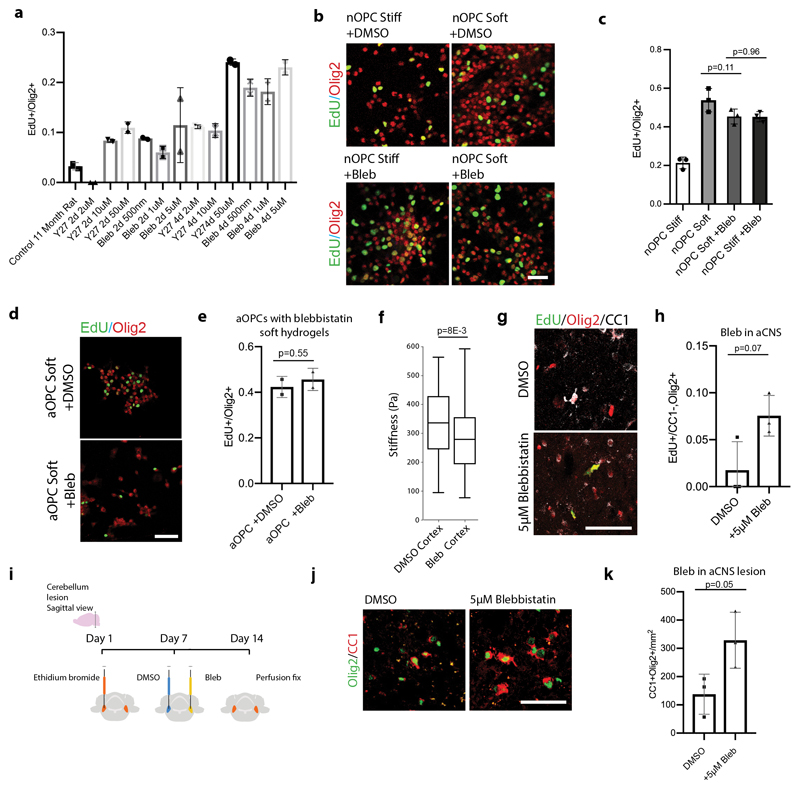
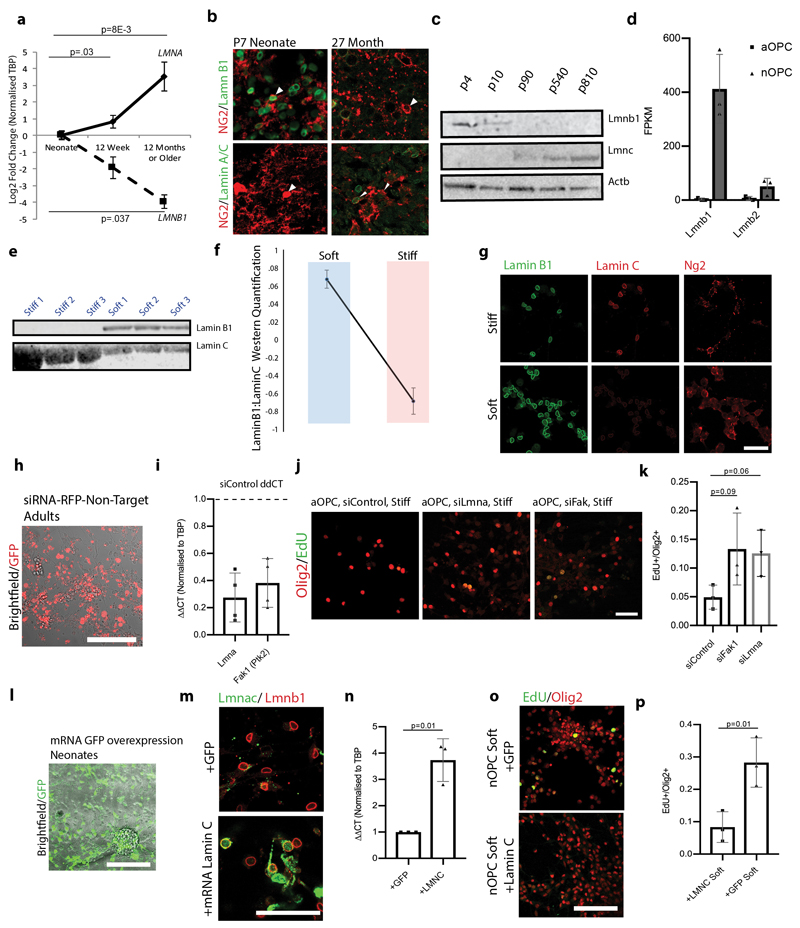
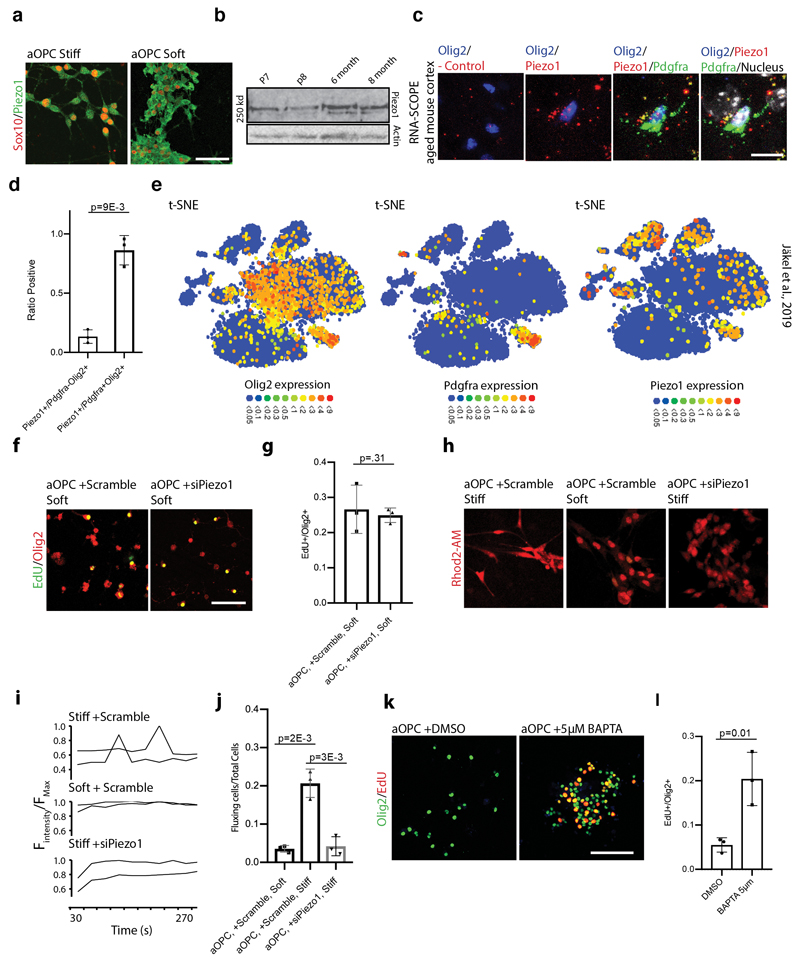
To further solidify the role of mechanics in OPC aging, we next investigated mechanotransduction of aOPCs using inhibitors of actomyosin contractility (Extended Data Fig. 4a). We found that these inhibitors increased proliferation and differentiation rates by 5 fold when applied to aOPCs on stiff substrates (Fig. 2e-f and Extended data 4b-e). We also investigated the effect of blocking actomyosin contractility in vivo (Extended Data Fig. 4f-k), as well as other potential mechanotransduction factors, such as the ‘mechanostat’ Lamin A/C4 (Extended Data Fig. 5), on the activity state of OPCs. These factors had varying levels of positive effect on the activity state of aOPCs. However, these are all relatively downstream factors; therefore, we sought an initial mechanosensor to silence as a means to ‘deceive’ OPCs into functioning as if they were in a soft environment. One such candidate is the mechanosensitive ion channel, Piezo1, which is known to regulate cell density and stem cell activation by tuning the influx of the secondary messengers such as calcium8–10. Attenuating Piezo1 activity leads to reduced sensitivity to mechanical signals11,12. We showed that Piezo1 gene and Piezo1 protein expression increases significantly with age (Fig 3a, Extended Data Fig. 6a-b) and that Piezo1 is highly expressed in OPCs (Fig. 3b-c, Extended Data Fig. 6c-d), including human (Extended Data Fig. 6e)13.
Figure 3. Piezo1 mitigates response of OPC activity to the stiffening CNS niche.
a, FPKM values of Piezo1 from neonatal and aged acutely isolated OPCs. b-c, Representative images and quantifications of the proportion of Piezo1 expressing OPCs (Olig2+CC1-) and oligodendrocytes (Olig2+CC1+) in the CNS grey matter in the rat of N=3 P7, N=3 3 month-olds, and N=3 14-month old animals. Scale bar represents 25μm. White arrows highlight example of Piezo1 expressing OPC. d-e, Representative images and quantifications of N=3 biological replicates of the proliferation and differentiation rates of aOPCs cultured on stiff hydrogels transfected with siScramble or siPiezo1. Scale bar represents 25μm. f-g, nOPCs were transfected with Cas9-mediated knock-in shRNA construct 24 hours following MACs sorting. Representative images and quantifications of GFP-expressing, EdU labelled cells in the grey matter of N=4 female rats. Arrows represent example quantified cells. Scale bar represents 50μM. Averages represent the mean of biological replicates, error bars represent standard deviation, and p-value is calculated by one-way ANOVA.
To examine the role of Piezo1 in OPC activity, we transfected Piezo1 siRNA into aged rat OPCs and found that they proliferated and differentiated ~4-5-fold more than the control on stiff hydrogels (Fig. 3d-e, Extended Data Fig. 6f-g). As Piezo1 gives rise to calcium transients, we next used imaging to investigate if substrate mechanics impacted intracellular calcium dynamics. OPCs regularly demonstrated calcium transients on stiff hydrogels, while OPCs on soft hydrogels had virtually no calcium fluxes. Moreover, transfection with Piezo1 siRNA abolished calcium transients on stiff hydrogels (Extended Data Fig. 6h-j). We also found that treating aOPCs with a calcium chelating agent caused an increase in the proportion of aOPCs entering cell cycle (Extended Data Fig. 6k-l).
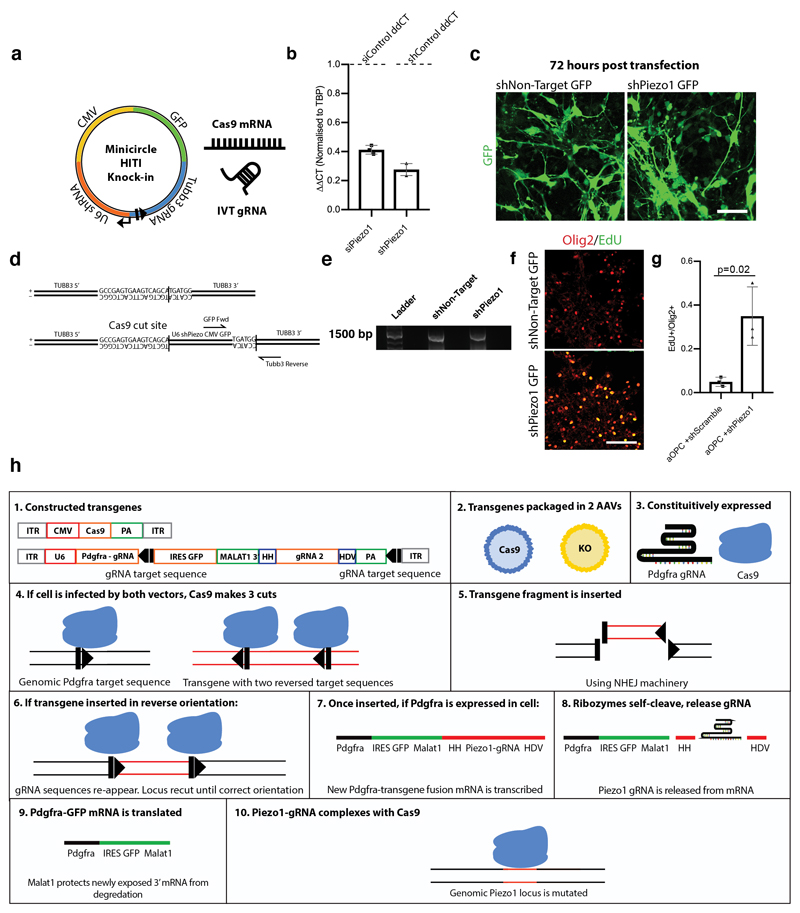
We next asked if Piezo1 could be silenced to eliminate the age-related loss of function in OPCs in vivo. To do this, we generated a Cas9-based system to efficiently knock in a Piezo1 shRNA-GFP overexpression cassette (Extended Data Fig. 7a-g)14. We transfected Piezo1-targeting and non-targeting control constructs into nOPCs, and transplanted them into the aged prefrontal cortex. As predicted, the control nOPCs lost their capacity to proliferate in the aged cortex (Fig. 3f-g). On the other hand, OPCs expressing the Piezo1 knockdown continued to proliferate, indicating a high level of OPC activity despite residing in an aged microenvironment.
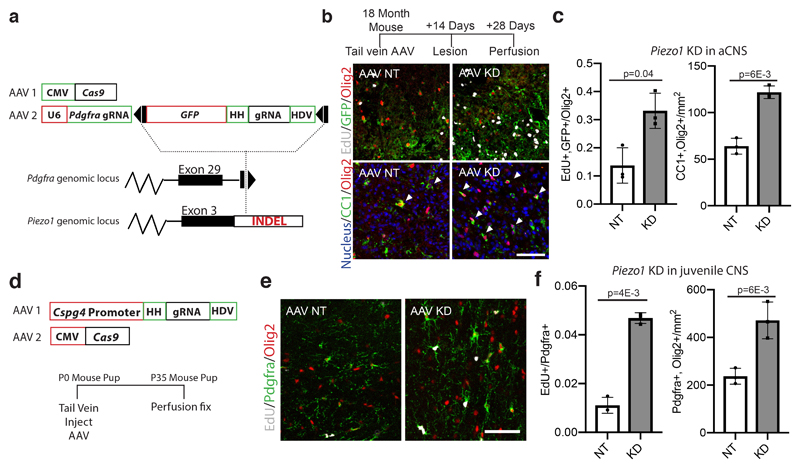
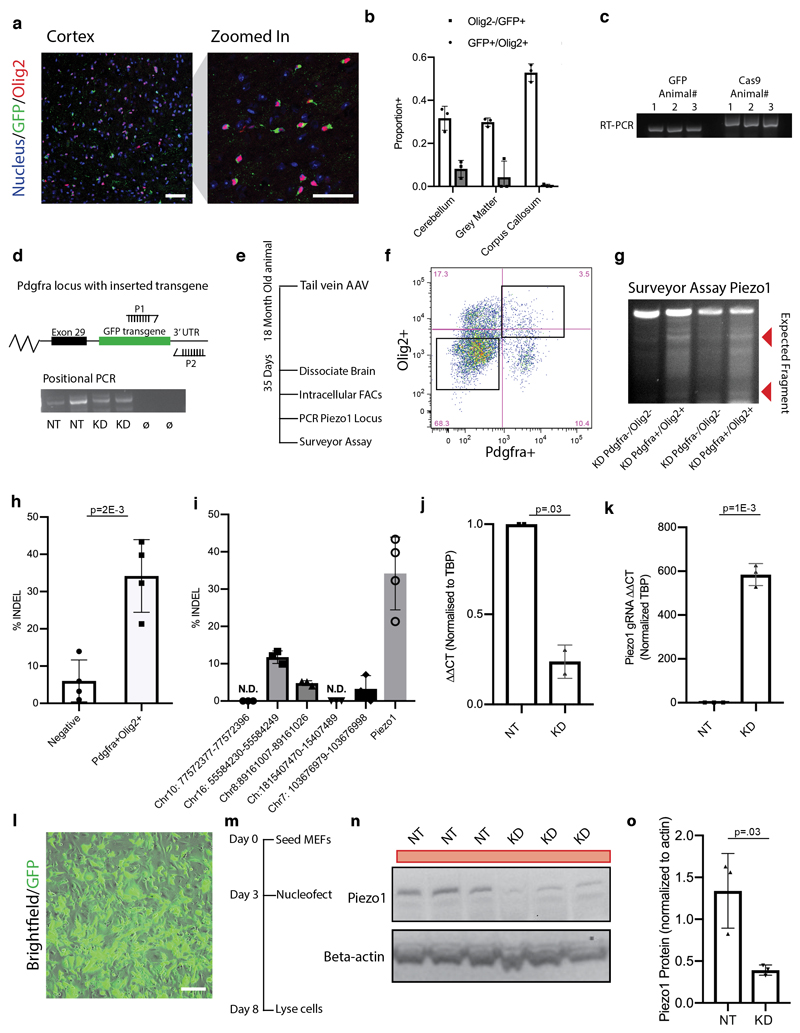
We then investigated the role of Piezo1 in regeneration. We did this by combining multiple in vivo genome engineering strategies, adapting an approach of knocking GFP and a ribozyme flanked Piezo1 gRNA into the Pdgfra 3’ UTR using NHEJ, and packaging it into the recombinant PHP-EB AAV vector14–16 (Fig. 4a, Extended data 7h). This way, Pdgfra expressing OPCs also express GFP and a gRNA for the Piezo1 locus. We tail vein-injected this vector along with CMV-Cas9 into an aged mouse. We showed that this approach is not only highly specific to OPCs, but it is also very efficient at creating Piezo1 mutations with negligible off-target mutations. The approach also reduces Piezo1 by ~75% at the mRNA and protein level (Extended Data Fig. 8a-o).
Figure 4. Piezo1 regulates OPC activity in an aged CNS lesion and in the developing CNS.
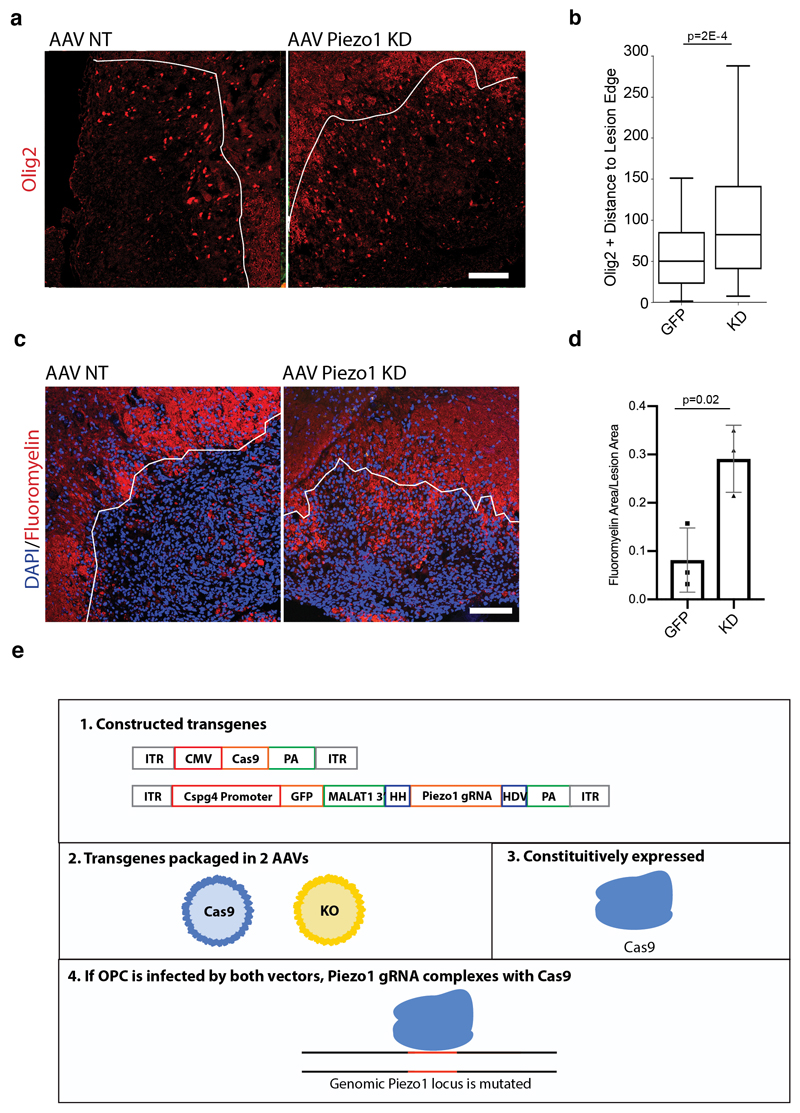
a, Schematic of a CRISPR system designed to both knock down Piezo1 and label the modified OPCs in a wild-type 18 month-old aged animal. A non-homologous end-joining mediated knock-in of a construct is inserted into a gene specific to a given cell type. This construct contains a ribozyme flanked second gRNA, targeting Cas9-mediated gene knockdown to a second locus. Animals were infected with both AAVs, lesioned 14 days later, and perfusion fixed 14 days after the lesion. b-c, Representative images and quantifications of EdU incorporation into Olig2/GFP expressing cells in the lesion core of N=3 mice. Representative images and quantifications of the number of CC1+/Olig2+ per mm2 of lesion area in N=3 control (non-targeting, NT) or Piezo1 knockdown animals. d, A schematic outlining the CRISPR-based method for knocking down Piezo1 activity in vivo. Both a Cas9 and a Piezo1-targetting gRNA under the Cspg4 promoter were packaged separately into the PHP-EB AAV. HH is an abbreviation for Hammerhead ribozyme, HDV for hepatitis delta virus ribozyme. e-f, Representative images of the corpus callosum and quantifications of N=3 biological replicates of mice 35 days after being infected at birth with both the Cas9 and OPC-specific Piezo1 or NT gRNA construct. Throughout figure, scale bars represent 100μm. Averages represent the mean of biological replicates, error bars represent standard deviation, and p-value is calculated by one-way ANOVA.
We then induced focal demyelination in the white matter of aged mice following AAV injection. In animals infected with a construct encoding a non-targeting gRNA, the GFP expressing cells were primarily found at the lesion periphery and demonstrated poor proliferation and differentiation capacity. In the Piezo1 knockdown animals, however, Olig2-expressing cells were present within the lesion core and had substantially greater rates of proliferation as well as differentiation, consistent with enhanced remyelination (Fig. 4b-c, Extended Data Fig. 9a-d). These results show that OPC-specific Piezo1 inhibition in an aged animal significantly improves the regenerative capacity of OPCs, associated with restored function17.
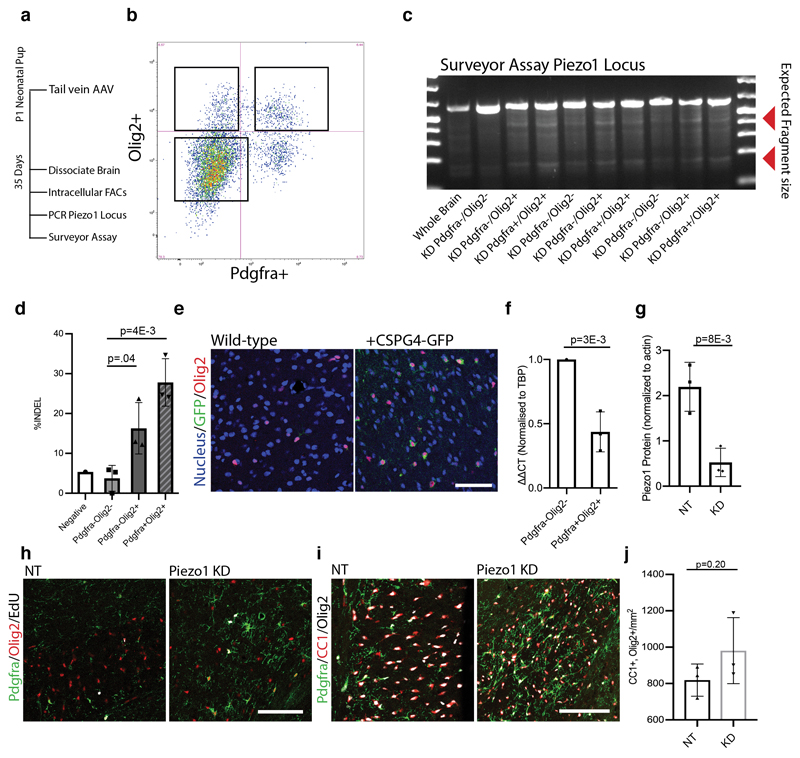
Since Piezo1 is deleterious to OPC function with age, we asked what its purpose in OPCs might be. Since Piezo1 provides negative feedback for proliferation, it could potentially inhibit an excess of OPCs during development. To test this, we synthesized a vector that expressed GFP and a ribozyme-flanked Piezo1 gRNA from a previously described Ng2 promoter18 (Fig. 4d, Extended data 9e). We injected viruses of both the Piezo1-gRNA and a CMV-Cas9 vector into neonate mouse pups, finding high specificity and efficiency for OPCs (Extended Data Fig. 10a-g), thereby achieving cell-specific knockdown without using transgenics. We observed a five-fold increase in proliferation and two-fold increase in the total density of OPCs without a corresponding change in differentiation (Fig. 4e-f, Extended Data Fig. 10h-j), indicating that Piezo1 plays a role in regulating OPC cell numbers. This finding suggests that Piezo1-mediated mechanical signalling is essential for an appropriate interaction with the niche in growth and development, but then becomes refractory to regeneration with aging.
We have shown that adult CNS progenitor cells acquire properties that reflect the features of their mechanical environment. This age-related loss-of-function can be reversed either by softening the ECM or by manipulating the cells, via abrogation of Piezo1, into functioning as if they are in a softer environment. We also found that young progenitors transplanted into aged environments lose optimal regenerative properties, indicating that tissue mechanics are likely to be an important determinant of the success of cell-based therapies that aim to treat age-related diseases. Furthermore, we identified a means to mitigate the negative response to the aged environment by decreasing the mechanical responsiveness of the CNS progenitor cells, notably using a novel progenitor cell-specific in vivo CRISPR strategy. Other aging pathways should now be considered in the context of the mechanical microenvironment. Our findings raise the possibility that niche mechanics – not cell-intrinsic factors – may be a general factor driving ageing in other adult stem cell systems.
Materials and Methods
Oligodendrocyte progenitor cell isolation protocol isolation protocol
Neonate and adult OPCs were dissected from wild-type Sprague-Dawley rats sacrificed using overdose of pentobarbital; dissected whole brains were placed immediately in Hibernate A Low Fluorescence media (HALF; prepared in-house) and placed on ice. Throughout the text, for rat, neonatal age range is ≤p7, adult age range is between 3-5 months of age, aged age range is between 14-18 months of age. The meninges were removed and the dissected brains were minced using a scalpel. The HALF containing the tissue was placed into a 15mL falcon tube and spun for 2 minutes at 150g. The HALF media was aspirated, and the pelleted brain tissue was re-suspended in activated filtered dissociation media, added in equal volume to the volume of the pelleted tissue. The brains were then placed on a 55 RPM orbital shaker at 35° C for 30 minutes. The tissue was then centrifuged at 200g for 5 minutes, the papain was removed, and the brains were re-suspended in HALF media containing 2mM sodium pyruvate (Thermo Fisher; 11360070), and 2% B27 (Thermo Fisher; 17504-001). Using a 5mL pipette, the dissected brains were gently titurated 10 times. Using fire polished pipettes of decreasing diameter, the brains continued to be titurated until appearing as a single cell suspension. The cell suspension was then passed through 70μM filter (Corning; 352350) to remove any remaining clumps of cells. To further remove debris from the cell suspension, 1 part 90% Percoll (GE; 17-0891-01), diluted in 10x PBS was added to 3 parts cell suspension. The cell suspension was then spun at 800g for 20 minutes, re-suspended in Miltenyi washing buffer (MWB; prepared in-house), and counted. After being spun again for 7 minutes at 250g, the pelleted cells were re-suspended in 500μL MWB buffer and 2.5μL A2B5 antibody (Millipore; MAB312) per 1x10⁷ cells. After a 30-minute incubation on a gentle rocker at 4° C, 5 times the volume of the cell suspension of MWB was added, and the cell suspension was spun at 250g for 7 minutes. The pelleted cells were then re-suspended in 80μL MWB and 20μL MACs beads (Miltenyi; 130-047-302). After a 30-minute incubation on a gentle rocker at 4° C, the cell suspension was centrifuged at 250g for 7 minutes and re-suspended in 1mL MWB. The cell suspension (max 5x10⁸ cells) was placed in a MS column (Miltenyi; 130-042-201) on a MiniMACS Separator (Miltenyi; 130-042-102), and washed 3 times with 500μL MWB buffer, waiting each time for the liquid to pass completely through the column. In one swift move, 1mL of MWB buffer was added to the column, the column was removed from the stand and placed atop a new collection tube, and the liquid was plunged through the column. The purified population of OPCs was then diluted and counted.
Maintenance and Differentiation of OPCs
OPCs were plated at a density of 10,000 cells per 96-well (scaling linearly according to plate format) and fed on alternate days with OPC media (see media section) supplementing with 30ng/mL bFGF (Peprotech; 100-18b) and 30ng/mL PDGF (Peprotech; 100-13a). The cells were kept in an incubator at 37° C and 5% O2.
To differentiate the cells, media was aspirated off the cells, and replaced with OPC media supplemented with 40ng/mL Triiodo-L-Thyronine (Sigma, T2877). Media was replaced on alternate days for 7-10 days.
Medias used for OPC isolation and maintenance are composed of the following:
100mL of OPC Media: 100mL of DMEM/F12 (Thermo Fisher; 11039-021), 2mL sodium pyruvate (Thermo Fisher; 11360-070), 5mg apo-transferrin (Sigma; T2036), 1.35mL 10% D(+) glucose (Sigma; G8644), 1mL SATO Stock Solution (see section below on SATO), 250μL insulin (Thermo Fisher; 12585-014).
50mL of SATO Stock Solution: 50mL DMEM/F12, 33mg/mL BSA fraction V (Sigma; A4919), 4μg/mL Selenite (Sigma; S5261), 1.61 mg/mL Putrescine (Sigma; P7505), 4μg/mL Progesterone (Sigma; P0130).
5L HALF Isolation Medium: 150.1mg Glycine (Sigma; G6201), 9.8MG L-ALANINE (SIGMA; A7627), 420.7MG L-Arginine hydrochloride (Sigma; A92600), 4.12mg L-Asparagine-H2O (Sigma; A0884), 12.06mg L-Cysteine hydrochloride-H2O (Sigma; C7880), 209.6mg L-Histidine hydrochloride-H2O (Sigma; H8125), 526.1mg L-Isoleucine (Sigma; I2752), 526.1mg L-Leucine (Sigma; L8000), 583.3mg L-Lysine hydrochloride (Sigma; L5626), 149.9mg L-Methionine (Sigma; M9625), 330.4mg L-Phenylalanine (Sigma; P2126), 38.569 L-Proline (Sigma; P0380), 210mg L-Serine (Sigma; S4500), 474.8mg L-Threonine (Sigma; T8625), 79.6mg L-Tryptophan (Sigma; T0254), 360.6mg L-Tyrosine disodium salt dihydrate (Sigma; T1145), 470.6mg L-Valine (Sigma; V0500), 19.55mg Choline Chloride (Sigma; 26980), 9.53mg D-Calcium pantothenate (Sigma; C8731), 18.3mg Niacinamide (Sigma; 1462006), 20.6mg Pyridoxine hydrochloride (Sigma; P9755), 16.9mg Thiamine hydrochloride (Sigma; T4625), 36mg i-Inositol (Sigma; I5125), .5mg Ferric Nitrate (Sigma; 254223), 1997.9MG Potassium Chloride (Sigma; P3911), 369.9 Sodium Bicarbonate (Sigma; S5761), 25810mg Sodium Chloride (Sigma; S9888), 543.6mg Sodium Phosphate dibasic anhydrous (Sigma; 71640), .9633mg Zinc Sulfate (Sigma; Z4750), 22525mg D-Glucose (Sigma; g8270), 124.9 Sodium Pyruvate (Sigma; P2256), and 13465mg MOPS (Sigma M1254). Media was pH adjusted to 7.30 and filtered sterilized (Millipore; SCVPU02RE).
MWB Washing Buffer: 10x PBS (Thermo Fisher; 70011-044), 2mM Sodium Pyruvate, 2mM EDTA (Thermo Fisher; 15575-020), 10μg/mL Insulin.
Generation of varying stiffness polyacrylamide gels
Glass coverslips were washed sequentially in dH2O, 70% EtOH (Sigma; 459836), and 0.2M NaOH. Bottom cover slips were air-dried and pre-coated in 1.2% bind silane (Sigma; GE17-1330-01) in 95% EtOH and 5% glacial acetic acid (Fisher Scientific; 64-19-7), air dried, and subsequently polished with lint free cloths. Top coverslips were submerged in 15% Sigmacote (Sigma; SL2-25ML) diluted in chloroform (Sigma; 288306) and incubated for 1 hour. Top coverslips were removed from the Sigmacote solution and polished with a lint free cloth. To make a soft hydrogel 7% acrylamide (Sigma; A4058), 6% bis-acrylamide (Sigma; 146072), and 48 mM 6-Acrylamidohexanoic acid were combined in dH2O. To make stiff hydrogels, 14% acrylamide and 12% bis-acrylamide were combined with 48 mM 6-Acrylamidohexanoic acid. The incorporation of 6- Acrylamidohexanoic acid is a novel step that allows for the independent control of ECM tethering and hydrogel stiffness. The gels were formed by adding a final concentration of 0.004 g/mL TEMED (Sigma; T9281) and of 0.001 g/mL ammonium persulfate (Sigma; A3678) to the acrylamide solution. Acrylamide solution was rapidly pipetted onto the bottom glass coverslips and the hydrophobic top coverslip was placed on top. After 5 minutes, the top coverslip was removed with a scalpel and the bottom coverslip with the now polymerized hydrogel was washed 2 times in methanol. The hydrogels were rehydrated in PBS.
To activate the hydrogels, they were incubated in 10mM MES hydrate (Sigma; M5287) with 500mM NaCl (Sigma; S9888) in dH2O (pH 6.1) for 10 minutes. To activate the functional group in the hydrogels, the gels were incubated for 30 minutes in 480mM N-Hydroxysuccinimide (Sigma; 130672) combined with 200mM N-(3-Dimethylaminopropyl)-N′-ethylcarbodiimide hydrochloride (Sigma; E7750) added to the Mes Hydrate solution. The gels were washed 1x in 60% MeOH in PBS and then covered overnight in 50μg/mL laminin (Sigma; L2020) diluted in pH 8.2 HEPES (Sigma; H3375).
Atomic force microscopy
Rats of different ages, neonate (~7 days post natum), young adult (~120 days), and an aged brain (~455 days post natum), were anesthetized with 5% isoflurane and sacrificed by intraperitoneal (I.P.) injection of a lethal dose of pentobarbitone sodium (Euthatal). The brain was dissected out and placed into cold slicing artificial cerebrospinal fluid19 (s-aCSF). One half of the brain was then glued onto a vibratome platform (VT1000 S; Leica Microsystems) using superglue. 500 μm thick coronal sections of the brain were cut in cold s-aCSF bubbled with 95% O2 and 5% CO2 using one half of a Gillette 7 O' Clock double edged razor blade. The frequency was set to 75 Hz and the forward speed to ~50 μm/s. Brain sections were transferred to a Cell-Tak-coated (Corning; 354240) 35 mm glass-bottom petri dish and covered with cold measuring artificial cerebrospinal fluid (m-aCSF). Subsequently, the samples were mounted on an inverted microscope (Zeiss; Axio Observer.A1) and constantly perfused with fresh m-aCSF bubbled with 95% O2 and 5% CO2.
For blebbistatin treated AFM brains, fresh aged CNS was vibratomed as described and transferred into a 24-well plate containing m-aCSF and either DMSO or 5μM blebbistatin. The slices were then transferred into an incubator for 30 minutes and subsequently measured.
AFM indentation measurements were performed as previously described. In brief, force distance curves were recorded using a JPK Nanowizard Cellhesion 200 (JPK Instruments AG) in a raster scan (stepsize = 100-200 μm) using tipless silicon cantilevers (rat brains: Arrow-TL1, spring constant = 0.03 – 0.05 N/m; hydrogels: Sicon-TL, spring constant = 0.2-0.3 N/m; both from NanoWorld) with polystyrene beads (d = 37 μm; microParticles GmbH) glued to them. The maximum force was set to 7 nN for brain measurements and 15nN for hydrogels, and the approach speed to 10 μm/s. Images were taken using a sCMOS camera (Zyla 4.2, Andor) mounted on a Zeiss Axio Zoom.V16 on top of the AFM setup. Using a custom algorithm20 data was analyzed for maximum indentation by fitting the force-distance curves to the Hertz model21–23.
with = F applied force, E = Young’s modulus, 𝜈 = Poisson’s ratio, r = radius of the probe, δ = indentation depth, and apparent elastic modulus K = E/(1 – ν2). Intact brain and decellularized brain curves were analyzed for the full indentation depth at F = 7 nN, and curves from hydrogel measurements for 0.5μm indentation depth. The shear modulus G of the polyacrylamide gels was calculated using24
assuming 𝜈PAA ~ 0.5 25.
Sequencing and analysis of RNA
RNA was extracted from neonatal cultured OPCs (≤p7) and aged cultured OPCs (14-18 months) according to the Directzol RNA MicroPrep Kit (Zymo Research; R2061) with the optional DNase treatment. RNA quality was assessed with a Bioanalyzer to ensure all samples had a RIN value of ≥ 8. DNA libraries were constructed using the SMARTer® Stranded Total RNA-Seq Kit - Pico Input Mammalian kit with multiplexed barcodes (Takara; 635005). 150 bp paired-end directional sequencing was performed on an Illumina HiSeq 4000.
Multiplexed samples were filtered, aligned to the rat UCSC rn6 assembly, normalized, and quantified using Trimmomatic, Hisat2, Stringtie, and Ballgown using a previously published protocol27. Dendrogram clustering, t-distributed stochastic neighbour embedding, gene set enrichment analysis, and heatmaps were generated in ipython notebook using the libraries pandas, matplotlib, numpy, seaborn, gseapy, and scikit-learn.
Single cell sequencing analysis of pre-existing data was performed using the open source single cell-sequencing database: https://castelobranco.shinyapps.io/MSCtrl_CCA_18/.
EdU incorporation assay, immunofluorescence, and imaging
For the EdU incorporation assay, 10μM EdU was added into the cell culture medium for five hours, followed by the protocol provided by the Click-iT Plus EdU Alexa Fluor 647 Imaging Kit (Thermo Fisher; C10640). Otherwise, in vitro tissue culture cells were fixed in 4% Paraformaldehyde (Thermo Fisher; 10131580) for 20 minutes at room temperature. The cells were then washed once in PBS (Thermo Fisher; BP3994) and then blocked in PBS with 0.1% Triton X-100 (Sigma; T8787) and 5% Donkey Serum (Sigma; D9663) for 30 minutes at room temperature.
Fixed in vivo tissue sections were cryo-protected overnight in 20% sucrose (Sigma; S0389), embedded in OCT (VWR; 361603E), flash frozen in dry ice and cut in 12μM sections on a cryostat. Tissue was allowed to dry on a SuperFrost Plus slide (VWR; 48311-703). Slides were either stored at – 80° C until use. To stain, slides were brought to room temperature and were placed in a slide chamber containing 1x Citrate buffer (Sigma; C9999). The slide chamber was brought to 100° C for 30 minutes for antigen retrieval. Slides were then allowed to cool to room temperature and they were washed once in PBS.
Primary antibodies diluted appropriately (see table of antibodies) in PBS with 0.1% Triton X-100 and 5% Donkey Serum were then added to each well or slide and they were stained overnight at 4° C. For most proliferation and differentiation assays, the antibodies for Olig2 and MBP were used. In cases when antibody species clashed, the Olig2-activated transcription factor Sox10 was used to identify oligodendrocyte lineage cells.
The cells or slides were then washed twice for 10 minutes in PBS with .1% Triton X-100. For one hour, cells or slides were incubated in fluorescent secondary antibodies diluted appropriately in PBS with 0.1% Triton X-100 and 5% Donkey Serum. Cells or slides were again washed twice for 10 minutes in PBS with 0.1% Triton X-100. For 10 minutes, cells were incubated with Hoechst 33342 (Thermo Fisher; H1399) diluted 1:10000 in PBS. Samples incubated in FluoroMyelin were done so in accordance with the kit protocol (Thermo Fisher; F34652). Slides were then mounted in mounting media with DAPI (Vectashield; H-1500). Cells and slides were stored in PBS at 4° C.
Fixed, fluorescent cells or slides were imaged using the Zeiss Axio Observer or the Leica TCS SP5 confocal microscope. As indicated, quantifications were performed either by eye or using high-content imaging and quantification, where appropriate. To perform high content analysis, 96 well plates were imaged using the GE InCell 2000. Fluorescence intensity thresholds for each stain were set from control samples and 42 images were randomly captured from each well. To process the images, pre-set protocols from the open source software Cell Profiler were calibrated so that the software would not identify false positives. Quantifications were averaged across triplicate technical replicates. Automated quantifications were further validated and corroborated by manual quantifications of subsets of images.
Flow cytometry analysis of primary isolated OPCs was performed by fixing OPCs in suspension for 20 minutes in 4% PFA. Following fixation, cell suspension was spun at 800g for 5 minutes, and the PFA was aspirated. The cell pellet was re-suspended in 0.1% Triton X-100 and 5% donkey serum in PBS and placed for 30 minutes on ice. The suspension was spun again and incubated in primary antibody diluted 1:300 overnight at 4° C. The cell suspension was washed twice by spinning the cell suspension, incubating it in 0.1% Triton X-100 in PBS for 10 minutes, and spinning again. After the second wash-spin, the cell pellet was re-suspended in secondary antibodies diluted 1:500 in 0.1% Triton X-100 and 5% donkey serum diluted in PBS and incubated on ice for 2 hours. The cell suspension was washed twice again for 10 minutes each and re-suspended in PBS. Flow cytometry was performed on the Attune NxT Flow Cytometer (Thermo Fisher).
Fluorescence multiplex in situ RNA hybridisation
Fluorescence in situ RNA hybridisation (FISH) on cryosections from 18-month-old aged mice was automated on a BOND RX robotic stainer (Leica). After manual post-fixation, epitope retrieval and dehydration, cryosections were processed for 2 gene FISH using the RNAScope LS Multiplex Assay (ACD). The assay was performed according to the manufacturer’s instructions. In brief, samples were initially permeabilized with heat and protease treatment to improve probe penetration and hybridisation. For heat treatment, samples were incubated in BOND ER2 buffer (pH 9.0, Leica) at 95°C for 2 minutes. For protease treatment, samples were incubated in ACD protease reagent at 42°C for 10 minutes. Prior to probe hybridisation, samples were incubated in hydrogen peroxide for 10 minutes to inactivate endogenous peroxidases and ACD protease. Samples were then incubated in target Pdgfra and Piezo1 z-probe mixtures for 2 hours at 42°C. Each slide wash flushed three times in order to obtain optimal hybridisation to transcripts. Following hybridisation, branched DNA amplification trees were built through sequential incubations in AMP1, AMP2 and AMP3 reagents for 15-30 minutes each at 42°C with LS Rinse buffer (Leica) high stringency washes between incubation steps. After amplification, probe channels were detected sequentially via HRP-TSA labeling. Here, samples were incubated in channel-specific HRP reagents for 15 minutes at 42°C, TSA fluorophores for 30 minutes and HRP blocking reagent for 15 minutes at 42°C. Probes were labeled using Opal 520 (1:2500) and Opal 570 (1:1000) fluorophores (Perkin Elmer). Slides were subsequently stained for nuclear marker Olig2 as described in previous section.
qPCR and Western Blots
Immediately following OPC isolation protocol, RNA was isolated from purified OPCs according to the Directzol RNA MicroPrep Kit (Zymo Research; R2061). RNA was stored at -80° C. cDNA was generated from the RNA according to the QuantiTect Reverse Transcription Kit’s instructions (Qiagen; 205310). For the RT-qPCR data, pre-designed primers (see table of primers used) were used at a concentration of 400μM and an efficiency of greater than ~98% were determined for each primer pair using serial dilutions of OPC cDNA. cDNA, primers, and the SYBR Green Master Mix (Qiagen; 204141) were combined according to the kit’s instructions, and RT-qPCR and melting curve analysis were performed on Life Technologies’ Quantstudio 6 Flex Real-Time PCR System.
Immediately following OPC isolation protocol, protein was isolated from purified OPCs using CelLytic M (Sigma; C2978) protein extraction solution and a protease inhibitor (Sigma; P8340). Isolated whole protein content was measured using a BSA gradient kit (Bio-Rad; 500-0206), and gradient intensity was quantified using Tecan’s Infinite 200 Pro Microplate Reader. 10μg of isolated protein was combined with 4X Bolt® LDS Sample Buffer (Thermo Fisher; B0007), brought to 95° C for 10 minutes and with the SeeBlue Protein Ladder (Thermo Fisher; LC5925) was run on Bolt 4-12% Bis-Tris Plus Gels (Thermo Fisher; NW04120BOX) in MES buffer (Thermo Fisher; B0002) for 35 minutes at 165 V. Protein was transferred for 90 minutes at 100 V to a PDVF membrane (Millipore; IPSN07852) in transfer buffer (Bio-Rad; 161-0732) with 20% methanol (Sigma; 322415). PDVF membranes were blocked for 30 minutes with 50% Odyssey blocking buffer (Licor; 927-40100) in TBS (Thermo Fisher; BP24711) and 0.1% TWEEN 20 (Sigma; P2287). Primary antibodies were added at the proper dilution (see table of antibodies) to the blocking buffer, and membranes were left overnight in primary antibodies and blocking buffer at 4° C. Membranes were washed twice in TBS with TWEEN 20 for ten minutes each wash and near infrared species-appropriate secondary antibodies were added (see table of antibodies). Membranes were stained for two hours, washed twice in TBS with 0.1% TWEEN 20, and imaged on the Licor Odyssey Fc.
Transplantation of labelled OPCs into Neonate
Neonatal (p1-p3) and aOPCs (14-18 months of age) were isolated in parallel using previously described MACs isolation protocol. Immediately following cell isolation, cells were labelled with Bacmam 2.0 CMV-GFP (Thermo Fisher; B10383) as per the manufacturer guidelines, and 300,000 cells were transplanted into the prefrontal cortex of p1-p3 neonate rat pups using previously published coordinates26. For proliferation analysis, 9 days following original transplantation, 75 μg/g EdU (Abcam; ab146186) was injected intraperitoneally (I.P.) 14-16 hours prior to perfusion fixation.
Creating demyelinating focal lesions in vivo and delivery of small molecules
Bilateral focal demyelinating white matter lesions were created by injecting 4μL of 0.01% ethidium bromide into the caudal cerebral peduncles of aged female rats (≥15 months) as described previously27. After 7 days post lesion, 4μL of 50 U/mL chABC (Sigma; C3667), 50 U/mL of penicillinase (Sigma; P0389), or 5μM blebbistatin was injected into the lesion site using animal-specific injection-site coordinates. For proliferation analysis, 75 μg/g EdU was injected I.P. 14-16 hours prior to perfusion fixation.
Mouse spinal cord lesions were created by injecting 1% lysolecithin in PBS into the ventral white matter tract of the spinal cord, as described previously28. For proliferation analysis, 75 μg/g EdU was injected I.P. 14-16 hours prior to perfusion fixation.
For histological cryosections, animals were perfusion fixed with 4% paraformaldehyde at 21-days post lesion. For Toluidine blue stain and electron microscopy sections, animals were perfusion fixed with 4% glutaraldehyde (Sigma; 340855), and sectioned into 1.5mm thick coronal sections. The sections were post-fixed in 1% osmium tetroxide (Sigma; 201030), dehydrated in graded concentrations of ethanol, and subsequently embedded in TAAB resin. The brains were sectioned into 1μM sections using a microtome and stained with Toluidine Blue O (Sigma; T3260) according to the manufacturer’s instructions.
siRNAs, modified mRNA synthesis and transfection
From cDNA, primers were generated containing the T7 promoter on the 5’ end of the Lmnb1 and Lmna transcript and the Kozak sequence, and performed a standard 35 cycle polymerase chain reaction according to the Phusion Polymerase kit (Thermo Fisher; F530S). Using the PCR product, we then synthesized the RNA using the synthesized DNA and HiScribe T7 ARCA mRNA Kit with Tailing (NEB; E2060S) with the addition of 5-Methylcytidine (Trilink; N-1014) and Pseudouridine (NEB; 1019). To determine fragment size of the synthesis product, we used the Quantitect Reverse Transcription Kit and ran the cDNA on a 1% Agarose gel (Thermo Fisher; 16500) at 100 volts for 30 minutes.
For a transfection of 1 well of a 96-plate-wells, each plated with 10,000 cells, 0.5 pmol of siRNA (GE; D-001960-01-05) was combined with 1.5μL of Opti-MEM media (Thermo Fisher; 31985062). In a separate tube, 1.5μL of Opti-MEM media was combined with 0.15μL of Lipofectamine RNAiMAX reagent (Thermo Fisher; 13778030). The diluted RNAiMAX was then combined with the diluted RNA and incubated at room temperature for 20 minutes. Following the incubation, 3μL of the transfection combination was added to each well.
For the transfection of modified mRNA a transfection of 1 well of a 96-plate-well plate, each plated with 10,000 cells per well, 25 ng per well of modified RNA was combined with 1.25μL of Opti-MEM media (Thermo Fisher; 31985062). In a separate tube, 1.25μL of Opti-MEM media was combined with 0.0375μL of Lipofectamine Messenger Max reagent (Thermo Fisher; 13778030). The diluted lipofectamine was then combined with the diluted RNA and incubated at room temperature for 5 minutes. Following the incubation, 2.5μL of the transfection combination was added to each well.
Generation of decellularized CNS scaffold
CNS tissue of neonatal (p7) and aged rats (between 14 and 18 months of age) was dissected and immediately vibratomed in 500μM coronal sections in HALF medium on ice. Brains were decellularized using an adapted protocol from previous reports29. Sections were immediately flash frozen at -80°C in dH2O. Sections were rapidly thawed at 37°C. Individual sections were transferred to a 24 well plate with 4% sodium deoxycholate (Sigma; D7650) for 2 hours and placed on an orbital shaker at 105 RPM. Sections were washed in 1x PBS with 1% penstrep (Sigma; P4333) for fifteen minutes on the orbital shaker. PBS was removed and 3% Triton X-100 in PBS was added onto the sections, again shaking for 1 hour on the orbital shaker at 105 RPM. Triton X-100 was then removed and replaced with PBS. These steps (sodium deoxycholate to PBS to Triton X to PBS) were repeated 3 times. Finally, the sections were transferred into an 8μm pore cell culture insert (Corning; 353097) coated with Poly-D-Lysine (Sigma; P6407) and were incubated overnight in PBS with 1% penstrep with DNAse I (Sigma; 11284932001). The following day, the sections were washed 3 times more with PBS with 1% penstrep and finally the sections were incubated in OPC media with growth factors. Freshly isolated OPCs were pipetted into the insert.
Calcium Imaging
Cells were loaded with 1μm Rhod2-am (ab142780) as per the manufacturers guidelines for 30 minutes. Cells were washed 2x in PBS, supplied with fresh media with growth factors and equilibrated in the incubator for an additional 20 minutes. Images were acquired every 20 seconds for the duration of ten minutes to examine spontaneous calcium flux.
Generation and transfection of minicircle vectors with Cas9, and transplantation into aged CNS
Competent minicircle bacteria strain were generated from ZYCY10P3S2T minicircle bacteria (System Biosciences; MN900A-1). Using Phusion polymerase (Thermo Fisher; F530S), PCR fragments with 20 basepair overlaps using the primers listed below and the pSpCas9(BB)-2A-GFP and pAi14-GFPNLS-MC plasmids were assembled using NEBBuilder HiFi DNA Assembly (NEB; E2621S) and gel extracted (Qiagen; 28704). pSpCas9(BB)-2A-GFP (PX458) was a gift from Feng Zhang (Addgene plasmid # 48138). pAi14-GFPNLS-MC was a gift from Juan Belmonte (Addgene plasmid # 87114). Minicircles were generated using previously described methods30 and plasmids were isolated with a Midi kit (Machery-Nagel; 740410.10). Plasmid sequences were confirmed using Sanger sequencing.
Capped Cas9 mRNA with modified base pairs (TriLink; L-7206), Tubb3 targeting crRNA:tracrRNA (Dharmacon), and minicircle constructs containing reverse-strand Tubb3 target sequence were transfected into MACs sorted nOPCs 24 hours after isolation using Lipofectamine LTX with plus reagent (Thermo Fisher; 15338100). To test whether vector was successfully knocked-in, a U6 forward primer along with 5’ flanking Tubb3 forward primer and a 3’ flanking Tubb3 reverse primer were mixed with genomic DNA isolated using QIAamp DNA Mini Kit (Qiagen; 51304) and fragments were assessed using gel electrophoresis.
OPCs were dissociated from PDL plastic 96 hours following transfection using TrypLE Express (Thermo Fisher; 12604013), re-suspended in HBSS, and 400,000 cells were slowly injected into 14 month-old females into grey matter in the prefrontal cortex using a Hamilton syringe and a stereotactic frame. 13.5 days following transplantation, animals were injected with I.P. with 75μg/g body weight of EdU and on day 14 were perfusion fixed.
Generation of in vivo CRISPR Plasmids
AAV-CMVc-Cas9 was a gift from Juan Belmonte (Addgene plasmid # 106431). pCAG-Cre-IRES2-GFP was a gift from Anjen Chenn (Addgene plasmid # 26646). pUCmini-iCAP-PHP.eB was a gift from Viviana Gradinaru (Addgene plasmid # 103005). pHelper plasmid was a gift from the Cancer Research United Kingdom viral core facility. Using the AAV-CMVc-Cas9 plasmid backbone and AAV2 ITR sequences, we cloned in the CRISPR system using NEBBuilder HiFi DNA Assembly. U6, gRNA, and Ribozyme containing sequences were ordered from Integrated DNA Technologies (see Sequence table), and cloned as previously described. All plasmids will be made available on request.
Virus production protocol and in vitro, in vivo transfection, and spinal cord lesions
AAV production and purification followed the previously described protocol (Challis et al., 2018). In brief, HEK293 cells were grown in 15mm plastic dishes and triple transfected with the pHelper plasmid, the PHP-EB capsid plasmid, and the transgene plasmid. Five days later cells were lysed and virus was isolated using Optiprep density gradient medium (Sigma; D1556) and ultra-centrifuged at 350000g. Viral layer was isolated and concentrated using Amicon Ultra-15 Centrifugal Filter Units (Sigma; Z648043-24EA). AAV titer was determined using SYBR green qPCR. For in vivo administration of the virus, aged mice were restrained and 5E11 viral genomes per virus were injected into the tail vein 18 month-old C57/Bl6 mice. Neonatal mice received 5e10 viral genomes for each virus.
In vivo surveyor assay and Indel quantification
Fresh CNS tissue was collected, dissociated, and spun in Percoll as described above. Cells were fixed in cold 4% PFA for 20 minutes on ice and stained intracellularly for FACs as described above. Sorted cells were lysed in QuickExtract DNA extraction solution (Lucigen; QE09050) and the mutated locus was PCR amplified using primers flanking the mutation site (See Table of Primers) and Phusion polymerase. To determine the off-target effects of the Piezo1 targeting gRNA, the top 5 genomic regions predicted in silico by Benchling were PCR amplified from the FACs sorted PCR (See Table of Primers). PCR products were purified (Qiagen; 28104) and the surveyor assay was performed as directed from the Engen Mutation Detection Kit (NEB; E3321S). Samples were subsequently run on a 2% agarose gel and band intensity was measured using ImageJ.
For qPCR assays, RNA was extracted using Directzol RNA MicroPrep Kit following FACs sorting and was reverse transcribed using QuantiTect Reverse Transcription Kit. For gRNA qPCR. Reverse transcription was performed using a custom gRNA-specific RT primer (See Table of Primers).
MEF transfection and Western blot
5e5 mouse embryonic fibroblasts were seeded in a 6 well plate and cultured in 10% FBS in DMEM/F12. On day 3, cells were dissociated with TrypLE Express and nucleofected in the 4-d Nucleofector System (Lonza) using the p4 Nucleofector kit with 3μg of each DNA plasmid construct (Lonza; V4XP-4012). The media was changed at 48 hour intervals and protein was extracted 5 days following electroporation. Western blots were performed as described above.
In vivo animal work
C57BL6 mice and Sprague Dawley rats were obtained from Charles River (Margate, UK). The animals were maintained as breeding or ageing colonies in standard facility for rodents at the University of Cambridge (individually vented cages, controlled temperature and humidity and 12 h light/dark cycle) until the age required, at least 10 days before experiments. The animals were randomly divided into control and treatment groups, both sexes have been used. The experiments and analyses were conducted blindly. This research has been regulated under the Animals (Scientific Procedures) Act 1986 Amendment Regulations 2012 following ethical review by the University of Cambridge Animal Welfare and Ethical Review Body (AWERB). All procedures were conducted strictly following the relevant protocols defined in Home Office Project Licence PC0C0F291.
Extended Data
Extended data Fig. 1. Dynamics of OPC activation, in vitro and in vivo.
a, Representative flow cytometry analysis on MACs purified OPCs confirm that we are able to isolate a pure population of Olig2+/Ng2+ OPCs from both neonate and aged brains. b, EdU labelling of OPCs after 1 and 2 weeks in vitro. Scale bar represents 25μM. c, Quantifications of N=3 replicates of neonatal and aOPCs in proliferation conditions on PDL coated tissue culture plastic after 5 days, showing that aOPCs proliferate poorly even in the presence of growth factors. d, Representative image of 16-month old female white matter and gray matter with triple labelling of Olig2, EdU, and CC1, showing that aOPCs also proliferate poorly in vivo. Scale bar represents 50μM. e, Schematic overview of the decellularization protocol. f, A DAPI staining following the decellularization protocol shows no remaining nuclear DNA, indicating complete cell removal. Scale bar represents 200μM. g, Rat brains of different ages were decellularized, fixed, and stained for chondroitin sulfate proteoglycans (CSPGs), showing that ECM remains intact following the decellularization protocol. Scale bar represents 20μM. h, A schematic of the re-cellularization protocol. OPCs are MACs-purified using the OPC surface marker A2B5, cultured for 5 days in proliferation conditions. A subset of these brain ECM cultures are fixed with PFA and the remaining brain ECM cultures are placed into differentiation conditions for 5 days. i-j, Representative images and a quantification of nOPCs seeded on neonatal and aged matrix, showing that nOPCs on aged ECM proliferate poorly. a, d, f, and g portray representative quantifications/images from ≥N=3 biological replicates. Averages represent the mean of biological replicates, error bars represent standard deviation, and p-value is calculated by one-way ANOVA.
Extended data Fig. 2. OPCs grown in progressively stiff environments lose their proliferation and differentiation capacity.
a, Mean shear moduli determined by AFM of our fabricated ‘soft’ and ‘stiff’ hydrogels. b-c, MACs purified nOPCs cultured on stiff hydrogels lose their ability to proliferate following 5 days in proliferation conditions. nOPCs cultured on soft hydrogels, however, continue to proliferate. Scale bar represents 40μm. d-e, Similarly, nOPCs cultured on stiff hydrogels differentiate into oligodendrocytes very inefficiently following 5 days in differentiation conditions. Conversely, nOPCs differentiated on soft hydrogels efficiently differentiate into oligodendrocytes. Scale bar represents 100μm. f-g, Representative images and quantifications of N=3 replicates of EdU labelled OPCs seeded at 0.5x, 1x, and 2x cell seeding densities on increasingly stiff hydrogels after 120 hours in culture show cell-density independent, stiffness-dependent OPC activation. Scale bar represents 100μM. h-i, Labelling and quantifications of N=3 assays of OPC viability of both neonatal and aged progenitor cells on soft and stiff hydrogels after 48 hours in culture with propidium iodide (PI), showing that the stiffness effect is not dependent on proliferation. Averages represent the mean of biological replicates, error bars represent standard deviation, and p-value is calculated by one-way ANOVA.
Extended data Fig. 3. Gene expression profiling show stiffness-driven changes in OPCs.
a-c, GSEA analysis reveal a number of aging-related pathways differentially regulated between aged and neonatal freshly harvested OPCs and between cultured OPCs grown on soft hydrogels versus those grown on stiff hydrogels. d, Volcano plot of differential expressed genes between aOPCs cultured on soft versus stiff hydrogels. Red dots show the 1300 significantly upregulated expressed genes as determined from N=3 biological replicates per condition (p < .05). e, Heatmaps showing the log2 FPKM expression of the 25 genes with highest fold increase in expression between N=3 biological replicates of aOPCs cultured on soft versus stiff hydrogels and of the 25 genes with highest fold increase in expression between aOPCs cultured on soft versus stiff hydrogels. ECM related genes such as Dab1, Acan, and Plxnd1 were upregulated in aOPCs cultured on stiff hydrogels while cell-cycle and DNA repair genes such as Cdk1na and Sirt7, OPC activation genes such as Etv1, and hippo pathway genes such as Rassf2 were amongst the most upregulated genes in aOPCs cultured on soft hydrogels. All genes shown are significantly differentially expressed with a p-value of ≤ 0.05. f, Venn diagram shows that similar gene sets to those enriched in neonates are also enriched in nOPCs grown on soft hydrogels. g, Specific genes involved in genomic and epigenomic stability and in the activation of OPCs are upregulated both in nOPCs and in aOPCs grown on soft hydrogels.
Extended data Fig. 4. Small molecules modulating cell cytoskeleton promote proliferation of aOPCs.
a, Using the 96 well plate format, the GE Incell, and cell profiler for quantification, we optimized the dosing and timing for the small molecules Y27632 and blebbistatin. Averages represent mean proportion of Edu+/Olig2+ cells in N=3 technical replicates for N = 3 biological replicates. b-c, Representative images and quantifications from N=3 biological replicates of the rates of proliferation of nOPCs cultured on soft and stiff hydrogels in the presence of 5μm Blebbistatin, showing that treatment with blebbistatin promotes proliferation in OPCs similarly to soft hydrogels. Scale bar represents 50μm. d-e, Representative images and quantifications of N=3 adult OPCs on soft hydrogels treated with blebbistatin or DMSO show no change in rates of proliferation, indicating that there is no stiffness-independent effect of blebbistatin. Scale bar represents 50μM. f, Box and whisker plots of AFM data from N=3 aged vibratomed cortex treated with DMSO or 5μM blebbistatin, indicating that the cortex softens significantly with treatment of blebbistatin. P-value was calculated using a two-way Mann-Whitney test for two independent samples. g-h, Representative images and quantifications of EdU labelled Olig2+CC1- OPCs 7 days following the injection of 5μM blebbistatin into the grey matter of N=3 14 month-old females.i-k, Schematic and quantifications of the differentiation rates of aOPCs following the injection of 5μM of blebbistatin at 14 days post lesion in in vivo-toxin-induced lesions. The data represents N=3 15 month-old age male rats. Differentiated oligodendrocytes are quantified as the proportion of CC1+ Olig2+ co-positive cells per mm2 of lesioned area. Scale bars represent 50μM. Averages represent the mean of biological replicates, error bars represent standard deviation, and, unless otherwise stated, p-value is calculated by one-way ANOVA.
Extended data Fig. 5. The nuclear lamina composition of OPCs changes both with aging and in response to niche stiffness.
a, qPCR on OPCs reveal a loss of Lmnb1 and gain of Lmna with aging. Values represent averages of OPCs from N=3 animals for each time point and are the Log2 ΔΔCT values normalized to Tbp. b, Representative images of in vivo cerebellar grey matter cryo-sections from N=3 biological replicates confirm nuclear lamina changes that occur with aging. Scale bar represents 50μm. White arrows highlight c, Representative Western blot of Lamin B1 and Lamin C from freshly isolated OPCs of different ages confirms qPCR data. Similar results were obtained for N=3 biological replicates for each age group. d, RNA-sequencing data of nuclear Lmnb2 in neonatal and aged OPCs show low levels of expression in both age groups. e-f, Western blot quantifications of aged OPCs grown on soft and stiff hydrogels. g, Representative images from N=3 biological replicates of nuclear lamina changes in OPCs on different stiffness hydrogels. Scale bar represents 50μM. h, Representative image from N=3 biological replicates of RFP-conjugated non-targeting siRNA shows high efficiency siRNA transfection. Scale bar represents 100μM. i, qPCR on adult OPCs 48 hours following transfection with siRNAs showing efficient knockdown of Lmna and Fak1. Values represent averages of OPCs from N=3 animals and are the Log2 ΔΔCT values normalized to Tbp. j-k, Representative images and quantifications of the proliferation of N=3 aOPCs in growth factors on stiff hydrogels following transfection with siRNAs for Lmna and Fak1. Scale bars represent 50μM. l, Representative image from N=3 biological replicates of GFP encoding mRNA in neonatal OPCs shows high efficiency transfection. Scale bar represents 100μM. m, Representative image from N=3 biological replicates showing efficient transfection, high translation, and proper protein localization of Lamin C in aOPCS. Scale bar represents 25μM. n, qPCR data 5 days post-transfection from RNA isolated from transfected OPCs. Means represent log2 ΔΔCT means across from N=2 biological replicates. o-p, Representative images and quantifications of N=3 replicates in nOPCs on soft hydrogels show loss of proliferative capacity 120 hours following Lmnc mRNA overexpression. Scale bar represents 100μM.
Extended data Fig. 6. Piezo1, which mediates calcium flux, is highly expressed in OPCs but not other cells of oligodendrocyte lineage.
a, Representative images of aOPCs on soft and stiff hydrogels showing that Piezo1 is expressed in rat OPCs in vitro. Scale bar represents 100μm. b, Western blot for Piezo1 in acutely isolated OPCs show modest increase in protein expression from neonates to adults. c-d, Representative images and quantifications of in situ hybridizations in aged mouse cortex for Piezo1 and Pdgfra using RNA-scope, showing expression of Piezo1 in aged mouse OPCs. Negative control is included. Scale bar represents 10μm. e, t-SNE plots from human single cell-sequencing study (Jäkel et al., 2019) show that Pdgfra/Olig2 co-expressing OPCs of the adult CNS also highly express Piezo1 in adult white matter. f-g, Representative images and quantifications of aOPCs transfected with a control siRNA or with a Piezo1 siRNA and placed in proliferation conditions for 5 days, indicating no stiffness-independent effect of Piezo1. Scale bar represents 100μm. h, Representative Rhod-2 AM-stained live cell images from N=3 biological replicates of aOPCs on soft and stiff hydrogels transfected with siScramble or siPiezo1. i, Representative traces from N=3 biological replicates of individual cells fluxing with calcium (ΔF) over 270 seconds. Fluorescence was normalized to the maximum fluorescence intensity per cell over the acquisition time. j, Quantifications of the proportion of cells that fluxed calcium ≥1 time throughout the 540 second image acquisition period, showing that either seeding OPCs on soft hydrogels or overexpressing Piezo1 inhibits the calcium flux. k-l, Representative images and proliferation quantifications from N=3 biological replicates of aOPCs cultured in proliferation conditions for 5 days on a stiff hydrogel in the presence of 5μM BAPTA, showing a boost in proliferation with calcium chelation. Scale bar represents 100μm. Averages represent the mean of biological replicates, error bars represent standard deviation, and p-value is calculated by one-way ANOVA.
Extended data Fig. 7. In vivo Piezo1 knockdown strategies.
a, Schematic for Cas9-mediated genomic manipulation using in vitro transcribed (IVT) gRNA, Cas9 mRNA, and in-house-made minicircle vectors overexpressing Piezo1-targeting shRNAs. This Cas9-mediated knock-in of shRNA-GFP has the benefit of having a characterizable monotonic knock-down across the pool of cells expressing the GFP. b, qPCR data 48 hours post-transfection of adult OPCs with Piezo1 siRNA and Piezo1 shRNA construct from RNA isolated from transfected OPCs show 80% transcript knockdown of Piezo1 mRNA. Means represent log2 ΔΔCT means from N=3 biological replicates. c, Representative images from N=3 biological replicates show high rates of co-transfection of minicircle with Cas9 mRNA and IVT gRNA. Scale bar represents 25μM. d-e, PCR design and appropriate fragment length of correctly knocked-in Minicircle fragment construct, representative of results from N=3 replicates. f-g, Representative images and quantifications show Cas9 knock-in of shPiezo1 fragments in aOPCs on stiff hydrogels phenocopies the effect of the siRNA Piezo1 in aOPCs. Scale bars represent 100μM. Averages represent the mean of biological replicates, error bars represent standard deviation, and p-value is calculated by one-way ANOVA. h, In order to knock down Piezo1 in endogenous OPCs in the aged mouse, we developed a strategy outlined in the schematic. A non-homologous end-joining mediated knock-in of a construct is inserted into a gene specific to a given cell type. This construct contains a ribozyme flanked second gRNA, targeting Cas9-mediated gene knockdown to a second locus. HH is an abbreviation for Hammerhead ribozyme, HDV for hepatitis delta virus ribozyme, PA for poly-adenylation sequence, and ITR for an internal terminal repeat sequence. Square and triangle represent gRNA target sequence.
Extended data Fig. 8. Nested CRISPR system efficiently labels OPCs with GFP and subsequently mutates Piezo1 locus.
a-b, Representative images and quantifications of GFP and Olig2 co-expressing cells across multiple regions of the CNS. <5% of GFP expressing cells expressing a marker other than Olig2 Data taken from N=3 control knock-down animals. Scale bars represent 50μm. c, RT-PCR shows Cas9 and GFP mRNA expression from whole brain homogenate in N=3 animals. d, A schematic and a DNA gel of N=2 biological replicates of the Pdgfra locus following CRISPR/Cas9-mediated knock-in confirms construct knock-in in the correct position. P1 signifies forward primer while P2 represents the reverse primer used for the PCR. e, Outline of experimental strategy to confirm efficacy of in vivo nested CRISPR approach. In brief, 5 x 10¹¹ of each viral vector was tail vein-injected into 18 month old animals. At 5 weeks, brains were dissociated, and cells were sorted by flow cytometry based on their expression of Pdgfra and Olig2. f, Representative FACs plot from N=3 biological replicates shows gating of sorted Pdgfra+/Olig2+ OPC population from whole mouse brain. g-h, Representative agarose gel of surveyor assay using T7 endonuclease I assay and quantifications from N=4 18 month old animals show ~35% INDEL rate specific to FACs sorted oligodendrocyte-lineage cells. i, Quantification of the off-target INDELs from N=3 FACs sorted OPCs from brains 3 weeks following AAV infection. N.D. signifies ‘non-detected’. j-k qPCR results showing ΔΔCT from N=3 biological replicates of Pdgfra/Olig2 sorted cells from the in vivo infected aged CNS shows a 75% reduction of Piezo1 INDEL-spanning mRNA and high expression of Piezo1 gRNA. l, Representative image from n=3 biological replicates of GFP plasmid electroporation in mouse embryonic fibroblasts (MEFs) demonstrating high efficiency of transfection. Scale bar represents 50μm. m-o, Schematic Western Blot, and quantifications of Piezo1 protein levels in MEFs 5 days following electroporation of both the Pdgfra-knock-in Piezo1 gRNA construct. Quantifications represent average from N=3 replicate transfections for each of the 4 in vivo CRISPR constructs. N.T. demarcates the control constructs containing a non-targeting gRNA. Averages represent the mean of biological replicates, error bars represent standard deviation, and p-value is calculated by one-way ANOVA.
Extended data Fig. 9. In vivo knock-down of Piezo1 in an aged lesion enhances OPC regeneration.
a-b, Representative images and box whisker plot quantification of white matter lesion stained only for Olig2 show increased OPC infiltration into the lesion site following Piezo1 knock-down. Lesion site indicated by white line. c-d, Fluoromyelin staining and quantifications of ratio of lesion area with positive fluoromyelin staining from N=3 biological replicates show increased myelin deposition in Piezo1 knock-down animals. e, In order to show the role of Piezo1 in development, we generated an additional in vivo CRISPR system. The diagram depicts GFP and a ribozyme flanked Piezo1 gRNA under the OPC specific Cspg4 promoter. HH is an abbreviation for Hammerhead ribozyme, HDV for hepatitis delta virus ribozyme, PA for poly-adenylation sequence, and ITR for an internal terminal repeat sequence. Square and triangle represent gRNA target sequence. Throughout figure, scale bars represent 100μm. Averages represent the mean of biological replicates, error bars represent standard deviation, and p-value is calculated by one-way ANOVA.
Extended data 10. A cell-type specific CRISPR knockout of Piezo1 in OPCs in development increases both OPC proliferation and total cell number.
a, Outline of experimental strategy to confirm efficacy of in vivo CRISPR approach. In brief, 5 x 10¹⁰ of each viral vector was tail vein-injected into p1 pups. At 5 weeks, brains were dissociated, and cells were sorted by flow cytometry based on their expression of Pdgfra and Olig2. b, Representative FACs plot shows gating of sorted Pdgfra+/Olig2+ OPC population from whole mouse brain. c-d, Agarose gel of surveyor assay using T7 endonuclease I assay and quantifications from N=3 p35 neonatal pups show ~30% INDEL rate specific to oligodendrocyte-lineage cells. e, Representative images from N=3 biological replicates showing transgene specificity for Olig2 expressing OPCs. f, qPCR results showing ΔΔCT from N=3 biological replicates of Pdgfra/Olig2 sorted cells from the in vivo infected neonatal CNS shows a ~55% reduction of Piezo1 INDEL-spanning mRNA. Representative lower power images of EdU labelling of corpus callosum of Pdgfra/Olig2 expressing cells. Scale bar represents 100μm. g, Quantifications of Piezo1 protein levels in MEFs 5 days following electroporation of the Piezo1-gRNA construct under control of the Cspg4 promoter sequence. Quantifications are from N=3 biological replicates. h-j, Representative images and quantifications from N=3 animals of total density of oligodendrocyte lineage cells, as labelled by Olig2/Pdgfra or Olig2/CC1 co-expression in p35 mouse corpus callosum. Scale bars represent 100μm. Averages represent the mean of biological replicates, error bars represent standard deviation, and p-value is calculated by one-way ANOVA.
Supplementary Material
Acknowledgements
We thank Daniel Morrison for technical assistance and Ewa Paluch for helpful discussions and help with the manuscript. The work was supported by the ERC 772798 (K.J.C.) and 772426 (to K.F.), UK Multiple Sclerosis Society (R.J.M.F.), BBSRC BB/M008827/1 (K.J.C and R.J.M.F.), The Adelson Medical Research Foundation (R.J.M.F. and D.H.R.), a Royal Society University Research Fellowship (K.J.C.), and a core support grant from the Wellcome Trust and Medical Research Council to the Wellcome Trust - Medical Research Council Cambridge Stem Cell Institute.
Footnotes
Data Accessibility Statement
Raw and processed sequencing data has been deposited at the NCBI gene expression omnibus (GEO) with the accession number GSE133886. Source data includes final quantifications from the in vivo animal work.
Author contributions M.S., R.J.M.F. and K.J.C. designed the study and wrote the manuscript. R.J.M.F and K.J.C. supervised the study. M.S., B.N., C.V., C.Z., M.H., and G.G. carried out animal experiments and quantifications, including transplantations and in vivo CRISPR experiments. M.S., I.W., K.F., and A.J.T. designed, performed, and analysed the AFM. experiments. A.Y. performed molecular biology associated with experiments. B.N., A.S., and M.S. did the in vitro OPC culturing experiments. B.N. developed and optimised the neonatal and aged in vitro OPC isolation protocol. M.S., S.H., and D.H.R performed the RNAscope imaging and analysis. C.C.A and K.J.C. invented the hydrogels.
Reprints and permissions information Reprints and permissions information is available at www.nature.com/reprints.
Competing interests The authors declare no competing interests.
References
- 1.Goodell MA, Rando TA. Stem cells and healthy aging. Science. 2015;350:1199–1204. doi: 10.1126/science.aab3388. [DOI] [PubMed] [Google Scholar]
- 2.Sim FJ, Zhao C, Penderis J, Franklin RJM. The age-related decrease in CNS remyelination efficiency is attributable to an impairment of both oligodendrocyte progenitor recruitment and differentiation. J Neurosci. 2002;22:2451–2459. doi: 10.1523/JNEUROSCI.22-07-02451.2002. [DOI] [PMC free article] [PubMed] [Google Scholar]
- 3.Gopinath SD, Rando TA. Stem Cell Review Series: Aging of the skeletal muscle stem cell niche. Aging Cell. 2008;7:590–598. doi: 10.1111/j.1474-9726.2008.00399.x. [DOI] [PubMed] [Google Scholar]
- 4.Swift J, et al. Nuclear Lamin-A Scales with Tissue Stiffness and Enhances Matrix-Directed Differentiation. Science. 2013;341:1240104–1240104. doi: 10.1126/science.1240104. [DOI] [PMC free article] [PubMed] [Google Scholar]
- 5.Hinks GL, Franklin RJ. Delayed changes in growth factor gene expression during slow remyelination in the CNS of aged rats. Mol Cell Neurosci. 2000;16:542–556. doi: 10.1006/mcne.2000.0897. [DOI] [PubMed] [Google Scholar]
- 6.Tang DG, Tokumoto YM, Apperly JA, Lloyd AC, Raff MC. Lack of replicative senescence in cultured rat oligodendrocyte precursor cells. Science. 2001;291:868–871. doi: 10.1126/science.1056780. [DOI] [PubMed] [Google Scholar]
- 7.Keough MB, et al. An inhibitor of chondroitin sulfate proteoglycan synthesis promotes central nervous system remyelination. Nat Commun. 2016;7 doi: 10.1038/ncomms11312. 11312. [DOI] [PMC free article] [PubMed] [Google Scholar]
- 8.He L, Si G, Huang J, Samuel ADT, Perrimon N. Mechanical regulation of stem-cell differentiation by the stretch-activated Piezo channel. Nature. 2018;555:103–106. doi: 10.1038/nature25744. [DOI] [PMC free article] [PubMed] [Google Scholar]
- 9.Eisenhoffer GT, et al. Crowding induces live cell extrusion to maintain homeostatic cell numbers in epithelia. Nature. 2012;484:546–549. doi: 10.1038/nature10999. [DOI] [PMC free article] [PubMed] [Google Scholar]
- 10.Li J, et al. Piezo1 integration of vascular architecture with physiological force. Nature. 2014;515:279–282. doi: 10.1038/nature13701. [DOI] [PMC free article] [PubMed] [Google Scholar]
- 11.McHugh BJ, et al. Integrin activation by Fam38A uses a novel mechanism of R-Ras targeting to the endoplasmic reticulum. J Cell Sci. 2010;123:51–61. doi: 10.1242/jcs.056424. [DOI] [PMC free article] [PubMed] [Google Scholar]
- 12.McHugh BJ, Murdoch A, Haslett C, Sethi T. Loss of the integrin-activating transmembrane protein Fam38A (Piezo1) promotes a switch to a reduced integrin-dependent mode of cell migration. PLOS ONE. 2012;7:e40346. doi: 10.1371/journal.pone.0040346. [DOI] [PMC free article] [PubMed] [Google Scholar]
- 13.Jäkel S, et al. Altered human oligodendrocyte heterogeneity in multiple sclerosis. Nature. 2019;79:726. doi: 10.1038/s41586-019-0903-2. [DOI] [PMC free article] [PubMed] [Google Scholar]
- 14.Suzuki K, et al. In vivo genome editing via CRISPR/Cas9 mediated homology-independent targeted integration. Nature. 2016;540:144–149. doi: 10.1038/nature20565. [DOI] [PMC free article] [PubMed] [Google Scholar]
- 15.Nissim L, Perli SD, Fridkin A, Perez-Pinera P, Lu TK. Multiplexed and programmable regulation of gene networks with an integrated RNA and CRISPR/Cas toolkit in human cells. Mol Cell. 2014;54:698–710. doi: 10.1016/j.molcel.2014.04.022. [DOI] [PMC free article] [PubMed] [Google Scholar]
- 16.Chan KY, et al. Engineered AAVs for efficient noninvasive gene delivery to the central and peripheral nervous systems. Nature Neuroscience. 2017;20:1172–1179. doi: 10.1038/nn.4593. [DOI] [PMC free article] [PubMed] [Google Scholar]
- 17.Duncan ID, Brower A, Kondo Y, Curlee JF, Schultz RD. Extensive remyelination of the CNS leads to functional recovery. Proc Natl Acad Sci USA. 2009;106:6832–6836. doi: 10.1073/pnas.0812500106. [DOI] [PMC free article] [PubMed] [Google Scholar]
- 18.Sellers DL, Maris DO, Horner PJ. Postinjury Niches Induce Temporal Shifts in Progenitor Fates to Direct Lesion Repair after Spinal Cord Injury. Journal of Neuroscience. 2009;29:6722–6733. doi: 10.1523/JNEUROSCI.4538-08.2009. [DOI] [PMC free article] [PubMed] [Google Scholar]
- 19.Koser DE, Moeendarbary E, Hanne J, Kuerten S, Franze K. CNS Cell Distribution and Axon Orientation Determine Local Spinal Cord Mechanical Properties. Biophysical Journal. 2015;108:2137–2147. doi: 10.1016/j.bpj.2015.03.039. [DOI] [PMC free article] [PubMed] [Google Scholar]
- 20.Christ AF, et al. Mechanical difference between white and gray matter in the rat cerebellum measured by scanning force microscopy. Journal of Biomechanics. 2010;43:2986–2992. doi: 10.1016/j.jbiomech.2010.07.002. [DOI] [PubMed] [Google Scholar]
- 21.Franze K, et al. Spatial mapping of the mechanical properties of the living retina using scanning force microscopy. Soft Matter. 2011;7:3147–3154. [Google Scholar]
- 22.Hertz H. Über die Berührung fester elastischer Körper. Journal für die reine und angewandte Mathematik; 1882. [Google Scholar]
- 23.Koser DE, et al. Mechanosensing is critical for axon growth in the developing brain. Nature Neuroscience. 2016;19:1592–1598. doi: 10.1038/nn.4394. [DOI] [PMC free article] [PubMed] [Google Scholar]
- 24.Moshayedi P, et al. Mechanosensitivity of astrocytes on optimized polyacrylamide gels analyzed by quantitative morphometry. Journal of Physics: Condensed Matter. 2010;22 doi: 10.1088/0953-8984/22/19/194114. 194114. [DOI] [PubMed] [Google Scholar]
- 25.Boudou T, et al. An extended modeling of the micropipette aspiration experiment for the characterization of the Young‘s modulus and Poisson’s ratio of adherent thin biological samples: Numerical and experimental studies. Journal of Biomechanics. 2006;39:1677–1685. doi: 10.1016/j.jbiomech.2005.04.026. [DOI] [PubMed] [Google Scholar]
- 26.Khazipov R, et al. Atlas of the Postnatal Rat Brain in Stereotaxic Coordinates. Front Neuroanat. 2015;9:161. doi: 10.3389/fnana.2015.00161. [DOI] [PMC free article] [PubMed] [Google Scholar]
- 27.Woodruff RH, Franklin RJM. Demyelination and remyelination of the caudal cerebellar peduncle of adult rats following stereotaxic injections of lysolecithin, ethidium bromide, and complement/anti-galactocerebroside: A comparative study. Glia. 1999;25:216–228. doi: 10.1002/(sici)1098-1136(19990201)25:3<216::aid-glia2>3.0.co;2-l. [DOI] [PubMed] [Google Scholar]
- 28.Jeffery ND, Blakemore WF. Remyelination of mouse spinal cord axons demyelinated by local injection of lysolecithin. J Neurocytol. 1995;24:775–781. doi: 10.1007/BF01191213. [DOI] [PubMed] [Google Scholar]
- 29.De Waele J, et al. 3D culture of murine neural stem cells on decellularized mouse brain sections. Biomaterials. 2015;41:122–131. doi: 10.1016/j.biomaterials.2014.11.025. [DOI] [PubMed] [Google Scholar]
- 30.Kay MA, He C-Y, Chen Z-Y. A robust system for production of minicircle DNA vectors. Nat Biotechnol. 2010;28:1287–1289. doi: 10.1038/nbt.1708. [DOI] [PMC free article] [PubMed] [Google Scholar]
Associated Data
This section collects any data citations, data availability statements, or supplementary materials included in this article.


