Shear stress imparted by blood flow on arteries is critical for vascular development and homeostasis but can also be an instigator of atherosclerosis1. Endothelial cells (ECs) lining the vasculature use molecular mechanosensors to directly detect shear stress profiles that will ultimately lead to atheroprotective or atherogenic responses2. Plexins are key cell-surface receptors for the Semaphorin family of cell-guidance signalling proteins and can regulate cellular patterning by modulating the cytoskeleton and focal adhesion structures3–5. However, a role for Plexins in mechanotransduction has not been examined. Here, we demonstrate a hitherto unrecognised role of Plexin D1 (PlxnD1) in mechanosensation and mechanically-induced disease pathogenesis. PlxnD1 is required for the EC response to shear stress in vitro and in vivo and regulates the site-specific distribution of atherosclerotic lesions. PlxnD1 is a direct force sensor in ECs and forms a mechano-complex with Neuropilin-1 (NRP1) and VEGFR2 that is necessary and sufficient for conferring mechanosensitivity upstream of the junctional complex and integrins. PlxnD1 achieves its binary functions as either a ligand or force receptor by populating two distinct molecular conformations. Our results establish a novel mechanosensor in ECs that regulates cardiovascular pathophysiology and provide a mechanism by which a single receptor can exhibit a binary biochemical nature.
ECs are constantly exposed to the haemodynamic forces of blood flow, including the frictional force of fluid shear stress that, depending on the vessel geometry, can be protective or pathogenic. While disturbed or atheroprone flow patterns found in curvatures and bifurcations are associated with upregulation of pro-inflammatory genes and deposition of atherosclerotic lesions, uniform or atheroprotective shear stress induces cytoskeleton remodelling and alignment of ECs in the direction of flow 1,6. The critical importance of shear stress in cardiovascular development and function has fuelled intense investigation into the identification of endothelial mechanosensors, as they are the first responders to changes in the mechanical environment 2.
Plexins are cellular receptors that play a range of important roles in axon guidance, tumour progression and immune cell regulation7. To date, Plexins are known to work primarily by binding to semaphorin ligands, cell-bound or free in solution, along with other co-receptors, resulting in intracellular signalling events that lead to large scale changes in the cytoskeleton and cell adhesion 3,4. Here, we show that the guidance receptor PlxnD1 moonlights as a novel mechanosensor in ECs, regulating vascular function and the site-specific distribution of atherosclerosis.
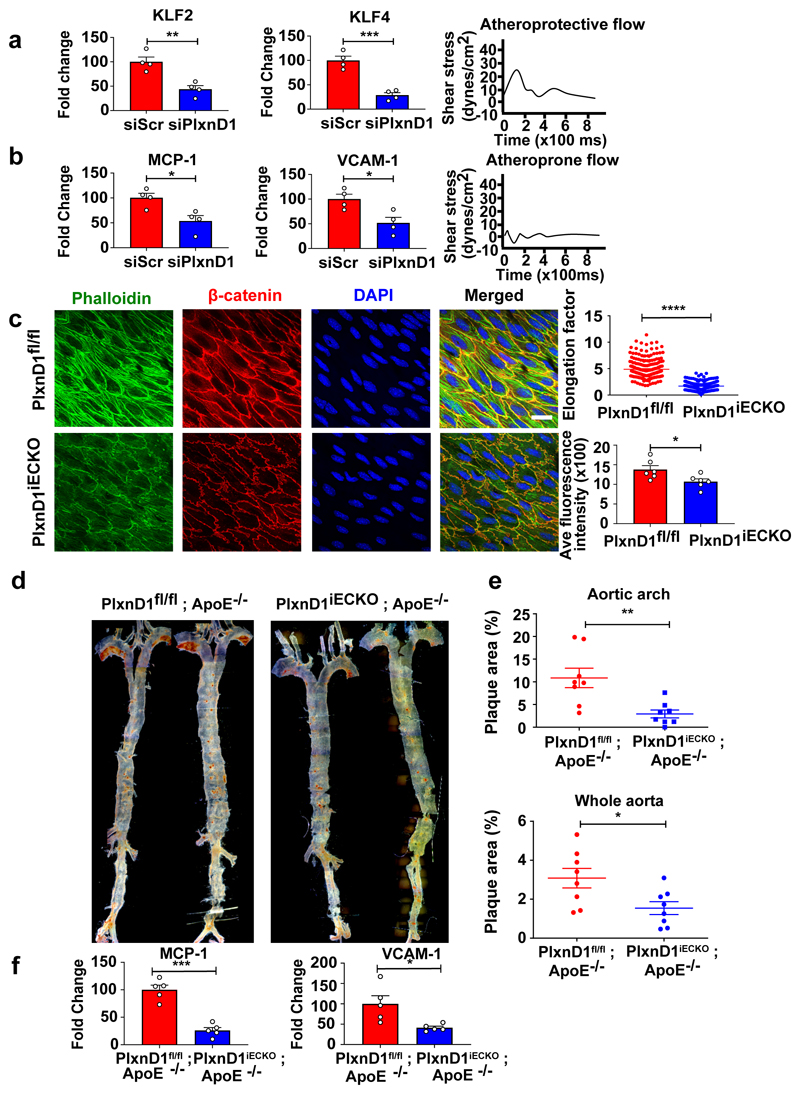
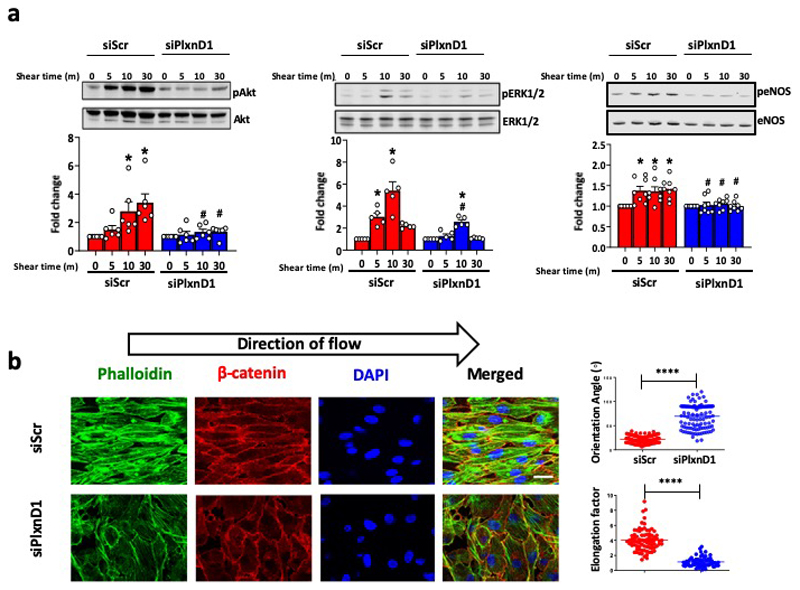
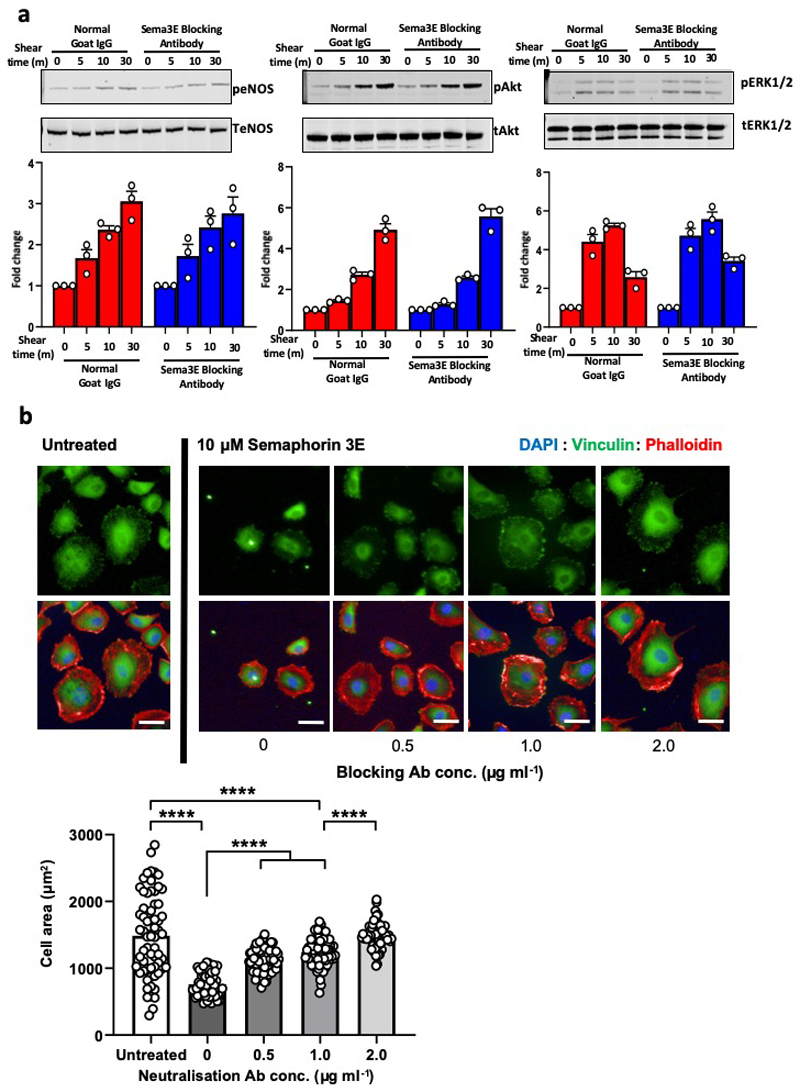
To determine the role of PlxnD1 under flow conditions, we transfected bovine aortic ECs (BAECs) with either Scrambled (Scr) or PlxnD1 siRNAs (Extended Fig. 1a), and subjected them to shear stress. Knockdown of PlxnD1 attenuated shear stress-induced activation of key signalling mediators Akt, ERK1/2 and eNOS (Extended Fig. 2a). PlxnD1-dependent mechanotransduction is independent of its ligand Sema3E, as incubation with a Sema3E function blocking antibody did not affect the flow-induced activation of signalling cascades (Extended Fig. 3). Next, we examined the role of PlxnD1 in the hallmark response to atheroprotective shear stress by examining alignment in the direction of flow. EC alignment with flow direction is highly correlated with atheroresistant regions of arteries and plays an important role in the activation of anti-inflammatory pathways. PlxnD1-depleted ECs showed a striking failure to align in response to shear stress and displayed fewer and more disorganised actin stress fibres (Extended Fig.2b). Quantification of alignment by measuring the orientation angle and the elongation factor indicate that PlxnD1 is required for EC alignment with flow. We also examined levels of Kruppel-like factors KLF2 and KLF4, key anti-inflammatory transcription factors which are known to be upregulated by atheroprotective shear stress.8,9 Congruently, we found that knockdown of PlxnD1 attenuated flow-induced upregulation of both these genes compared to control cells. (Fig. 1a). We then asked if PlxnD1 could mediate the endothelial response to disturbed shear stress. We subjected ECs to atheroprone flow for 24h and examined mRNA levels of pro-inflammatory genes Monocyte Chemoattractant Protein-1 (MCP-1) and Vascular Cell Adhesion Molecule-1 (VCAM-1)10. We noted that knockdown of PlxnD1 in ECs with siRNA significantly reduced the upregulation of both genes in response to atheroprone shear stress (Fig. 1b). Combined, these data demonstrate that PlxnD1 is a critical mediator of key shear stress responses in ECs.
Figure 1. PlxnD1 mediates the endothelial cell response to fluid shear stress and regulates the site-specific distribution of atherosclerosis.
(a.b) Mouse ECs were transfected with either Scr or PlxnD1 siRNA and exposed to either atheroprotective or atheroprone flow for 24 hours, using a cone and plate viscometer. Q-PCR was performed for KLF2 and KLF4 on samples subjected to atheroprotective flow, and inflammatory markers MCP-1 and VCAM-1 on samples subjected to atheroprone flow; n=4 biological replicates (c) The descending thoracic aorta was isolated and prepared en face from PlxnD1fl/fl and PlxnD1iECKO mice and stained for β-catenin, phalloidin and DAPI to visualise the cell junctions, actin stress fibres and nuclei. Quantification of alignment was performed using ImageJ; 3-5 images (each image has n≤100 cells) taken from three regions along the length of descending aorta collected from 5 animals of each genotype (for exact n, please refer to source data). (d) Representative en face preparations of whole aortas showing atherosclerosis in PlxnD1fl/fl; ApoE-/- and PlxnD1iECKO; ApoE-/- mice after 10 weeks of high fat diet feeding, visualised by Oil Red O staining. (e) Quantification of lesion area in whole aortas and aortic arches from PlxnD1fl/fl; ApoE-/- and PlxnD1iECKO; ApoE-/- mice; n=8 (f) Aortic arches from PlxnD1fl/fl; ApoE-/- and PlxnD1iECKO, ApoE-/- mice were isolated and Q-PCR was performed for inflammatory markers VCAM-1 and MCP-1; n=5. The data represent mean±SEM. P-values were obtained by performing two-tailed Student's t test using Graphpad Prism. *p<0.05, **p<0.01, ***p<0.001, ****p<0.0001; scale bar represents 20 μm
To explore the biological relevance of our findings, we used a transgenic mouse model to enable endothelial-specific inducible deletion of PlxnD1 (PlxnD1iECKO) (Extended Fig.1b, 7b). Confocal imaging of the endothelial actin filaments and staining for the junctional marker β-catenin revealed reduced EC elongation and intensity of actin stress fibres in the absence of PlxnD1 (Fig.1c), consistent with in vitro observations (Extended Fig.2b).
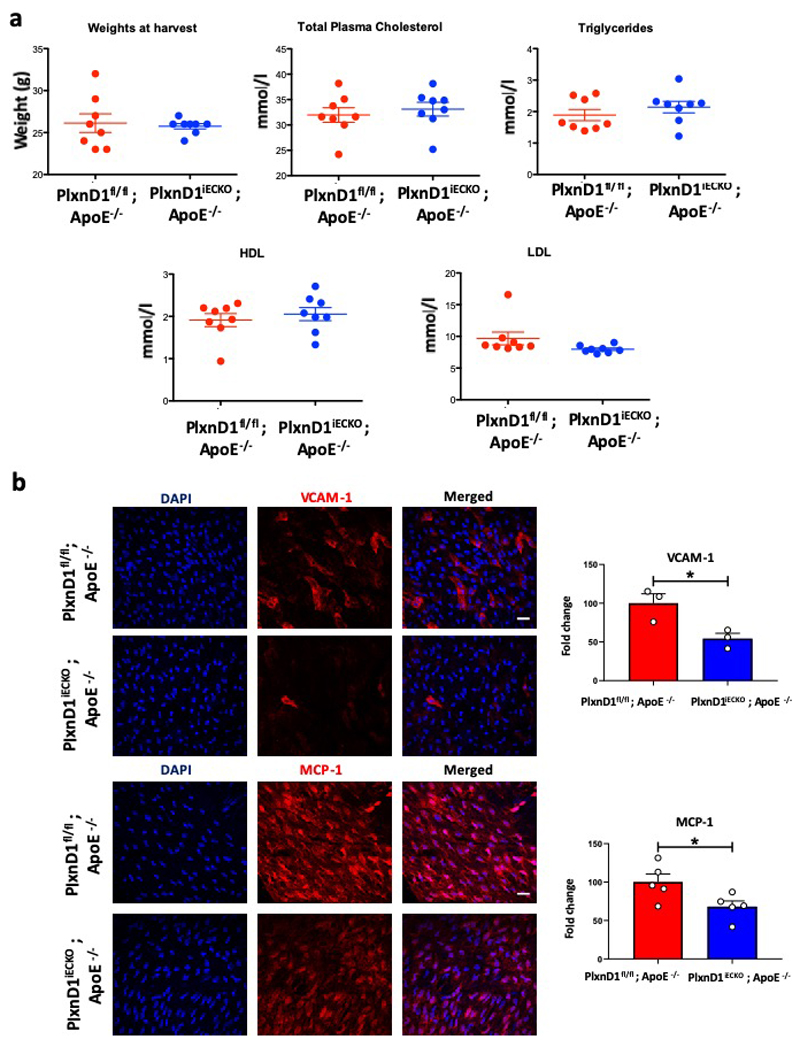
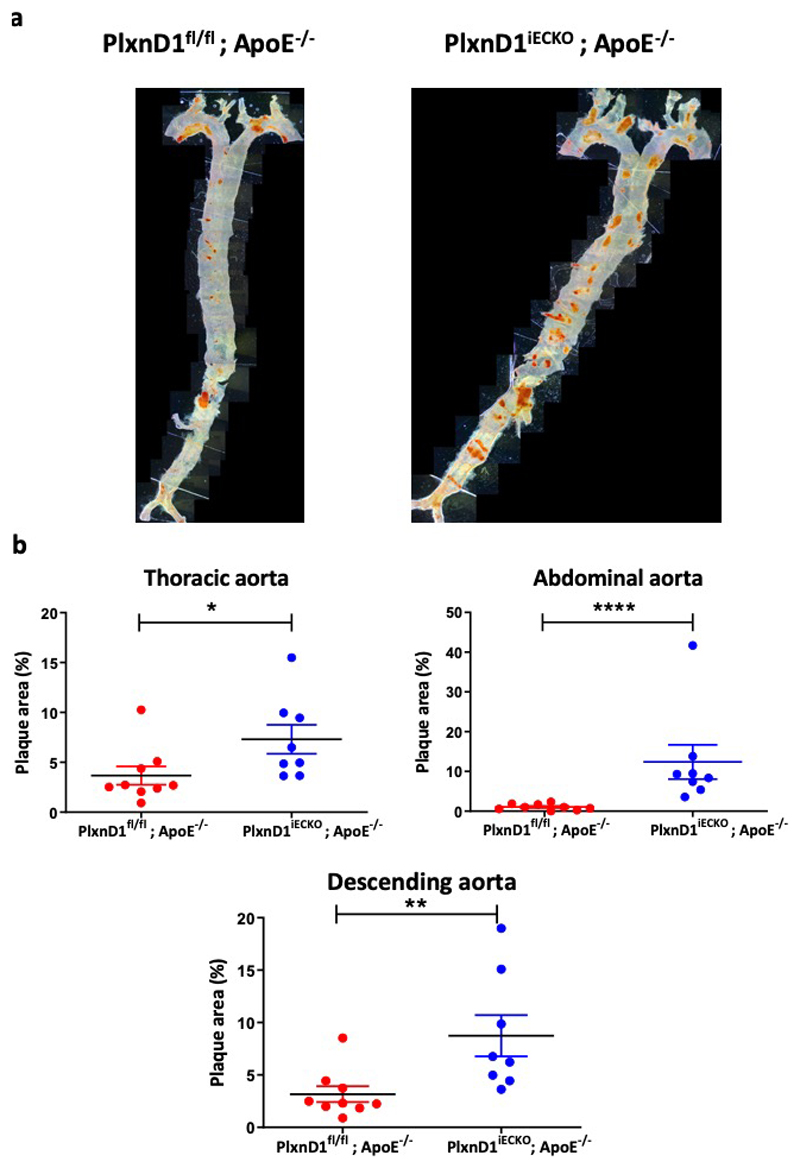
Given the decrease in inflammatory gene expression in response to atheroprone shear stress in vitro observed with loss of PlxnD1 (Fig.1b), we assessed the role of endothelial PlxnD1 in a pathophysiogical setting. Atherosclerotic lesions are known to occur in regions of the vasculature with low/disturbed blood flow, flow reversal and other complex spatial/temporal flow patterns1. Systemic risk factors, such as hypercholesterolaemia, interact with local biomechanical factors to initiate and advance atherosclerotic plaque deposition. To assess whether endothelial deletion of PlxnD1 affected atherosclerosis in vivo, we crossed PlxnD1fl/fl and PlxnD1iECKO into the hypercholesterolaemic Apolipoprotein E deficient (ApoE-/-) background11 and subjected them to a high-fat diet for 10 weeks. Although animal body weights and lipid levels were unaffected by loss of PlxnD1 (Extended Fig. 4a), quantification revealed a significant decrease in plaque burden for both the whole aorta and the arch in PlxnD1iECKO /ApoE-/- animals (Fig. 1d, e). To explore these differences further, we examined expression of inflammatory markers in the inner curvature of the aortic arch. Immunostaining and qPCR analysis showed reduced levels of MCP-1 and VCAM-1 in PlxnD1iECKO/ApoE-/- compared to PlxnD1fl/fl/ApoE-/- mice (Fig. 1f, Extended Fig. 4b). Given the atheroprotective role of laminar shear stress and the reduced alignment with loss of PlxnD1, we examined the effects in the atheroprotected descending aorta. After high-fat feeding for an extended period of 20 weeks, we observed increased plaque burden in the descending aortas of PlxnD1iECKO /ApoE-/- (Extended Fig. 5); these plaques also appeared to correlate with intercostal branch points that have flow disturbances. Together, these results show that endothelial PlxnD1 is required for the endothelial response to fluid shear stress and the site-specific distribution of atherosclerosis.
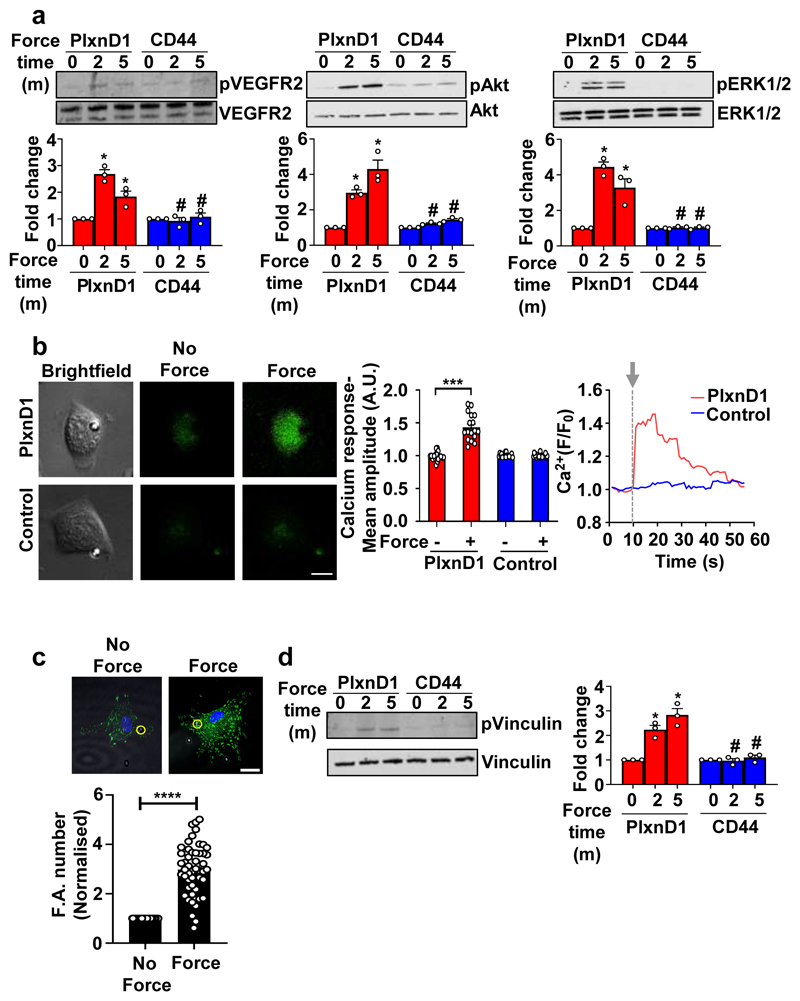
The requirement for PlxnD1 in flow-mediated responses in vitro and in vivo, prompted us to ask if this is because PlxnD1 is simply a player in mechanochemical signalling cascades, or functions as a mechanoreceptor, capable of detecting mechanical force. We applied tensional forces, using a magnetic system12, to paramagnetic beads coated with an antibody that recognises the extracellular domain of PlxnD1 and examined force responses using 4 different readouts. First, force on PlxnD1 induced activation of the same signalling cascades (ERK1/2, Akt, VEGFR2) (Fig. 2a), as those induced by shear stress (Extended Fig. 2a)13. Second, we observed robust transient increase in intracellular calcium levels in ECs when force was applied on PlxnD1 (Fig. 2b), similar to the response observed for other recently discovered mechanosensors14,15. Third, we examined cytoskeletal responses12: ECs responded to application of force on PlxnD1 by exhibiting a robust increase in both vinculin-positive focal adhesions (Fig. 2c) and ligated integrin β1 staining (Extended Fig. 6a). Notably, the mechanotransduction response was not restricted to the vicinity of the magnetic bead under tension, but was a global cell-wide phenomenon. Fourth, we examined phosphorylation of vinculin at Y822, a site known to be phosphorylated when force is applied on E-cadherin16, and observed a significant increase in its activation following force on PlxnD1 (Fig. 2d). These mechanoresponses were specific to PlxnD1 because ECs incubated with beads coated with another transmembrane receptor CD44 or Poly-L-lysine did not respond to force. These data clearly demonstrate that PlxnD1 is a direct force sensor that can elicit robust and global mechanical signalling in ECs.
Figure 2. PlxnD1 is a mechanosensor that mediates the EC response to force.
(a) Mouse ECs were incubated with anti-PlxnD1 or C44 (negative control) antibody-coated beads and subjected to force (10pN) for the indicated time periods. Phosphorylation of VEGFR2, Akt and ERK1/2 was determined by western blotting and quantified using Image Studio Lite Ver 5.2, n=3 biological repeats; *p<0.05 relative to no force condition, #p<0.05 relative to the respective force application time point with PlxnD1. (b) BAECs were loaded with Fluo-8AM dye and then incubated with beads coated with an antibody to the extracellular domain of PlxnD1 or Poly L-lysine (negative control). The beads were then subjected to force (1nN). Calcium responses were measured by calculating the fluorescent intensity of individual cells before (10 seconds), during (20 seconds), and after (30 seconds) stimulation. Representative images are shown along with quantification. n=18 cells for PlxnD1 and n=19 cells for control over 3 independent biological replicates. ***p < 0.001 relative to unstimulated controls, scale bar represents 10 μm. Representative trace for calcium influx response over time has also been shown. The arrow marks the start of the stimulation. (c) BAECs were incubated with anti-PlxnD1-coated beads and subjected to force (10pN) for 30min. ECs were fixed and stained with an anti-vinculin antibody to mark focal adhesions. Focal adhesion number was quantified using ImageJ software. Values were normalised to the “no force” condition. Location of the beads are highlighted in yellow circles (n=50 cells for each condition from 3 independent biological replicates;****p<0.0001; scale bar represents 10 μm (d) Mouse ECs were incubated with anti-PlxnD1 or C44 coated beads and subjected to 10pN force for the indicated time periods. Phosphorylation of vinculin was determined by western blotting and quantified using Image Studio Lite Ver 5.2, n=3 biological repeats; *p<0.05 relative to no force condition, #p<0.05 relative to the respective force application time point with PlxnD1. The data represent mean±SEM. P-values were obtained by performing two-tailed Student's t test using Graphpad Prism.
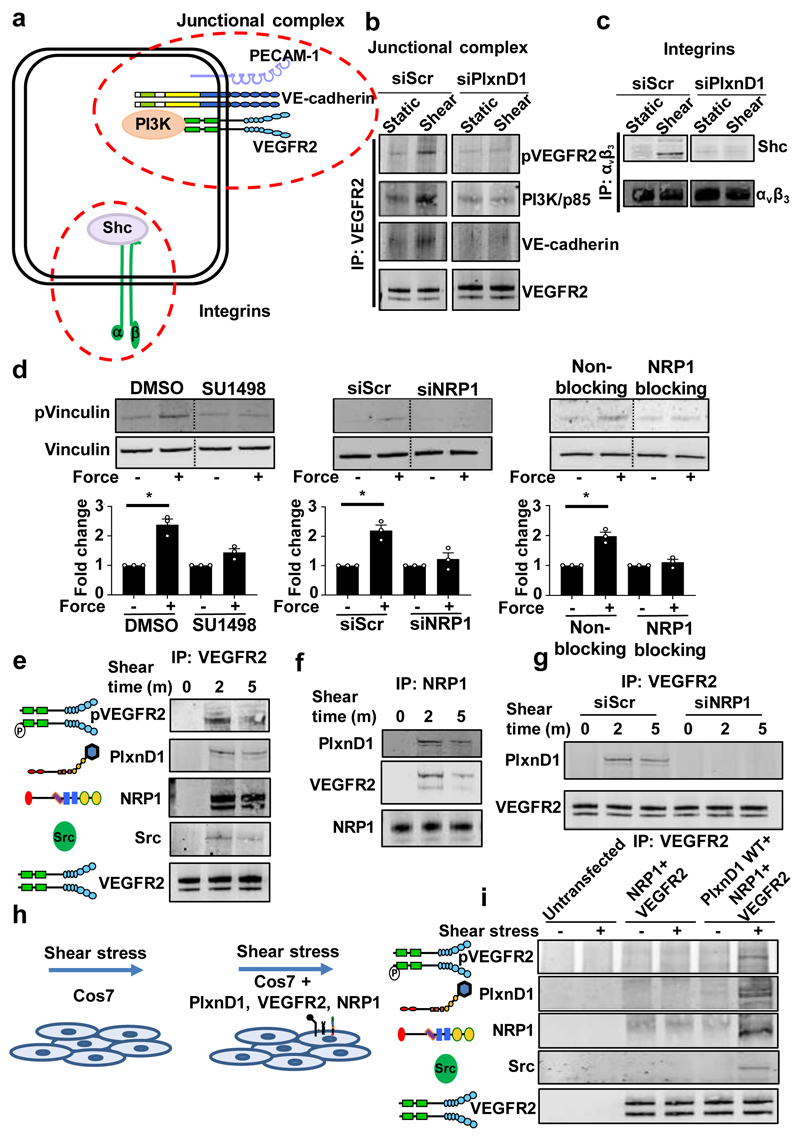
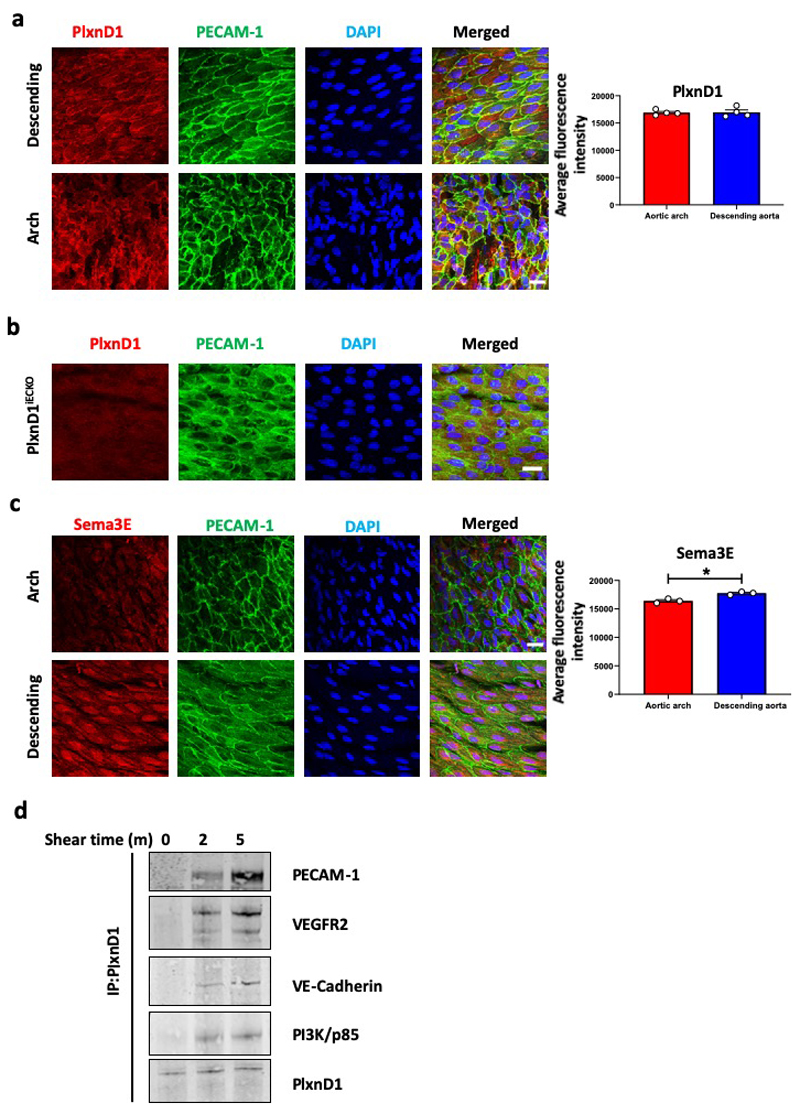
Cell-cell and cell-matrix adhesions represent two highly mechanically active sites within ECs. These include the junctional mechanosensory complex comprising PECAM-1, VEGFR2 and VE-cadherin and integrins at the cytoskeleton-extracellular matrix interface13,17 (Fig.3a). We interrogated the relationship between PlxnD1 and these mechanical ‘hotspots’ in ECs. En face confocal imaging revealed robust and similar expression of PlxnD1 in ECs in both arch and descending aorta and co-localisation with PECAM-1 at cell-cell junctions (Extended Fig. 7a). Staining was specific as it was not observed in PlxnD1iECKO aortas (Extended Fig. 7b). Sema3E was also observed in en face sections with its expression being lower in the arch (Extended Fig. 7c). Co-immunoprecipitation experiments showed flow-induced association of PlxnD1 with components of the junctional mechanosensory complex (PECAM-1, VEGFR2, VE-cadherin and PI3K/p85) (Extended Fig. 7d). To explore if PlxnD1 is just another component of the junctional complex or whether it operates upstream, we used immunoprecipitation to interrogate complex formation both at the junctional mechanosensory complex and integrin-matrix adhesions. We found that responses at the junctional complex, such as shear stress-induced phosphorylation of VEGFR2 and association of the p85 subunit of PI3K and VE-cadherin with VEGFR213, were all abrogated by knockdown of PlxnD1 (Fig. 3b). In agreement, both inhibition of VEGFR2 receptor kinase (Fig. 3d) and deletion of PECAM-1 abrogated force-induced signalling, suggesting that junctional mechanosensory components are necessary intermediates for the PlxnD1 force response (Extended Fig. 8a). Similarly, flow-induced complex formation at integrin-matrix adhesions (as assayed by association of Shc with integrin αvβ318,19) was also strongly reduced with loss of PlxnD1 (Fig. 3c). Recent work has highlighted a role for Piezo1 and Gq/G11-mediated mechanosignalling, although there are conflicting reports as to whether these pathways are linked20,21 or independent of each other22,23. Force application on PlxnD1 showed that loss of Gq/G11 abolished the PlxnD1 force response, while knockdown of Piezo1 had no effect (Extended Fig. 1e,f; Extended Fig., 8b,c).
Figure 3. PlxnD1, NRP1 and VEGFR2 mechano-complex functions upstream of known mechanosensory hotspots and is sufficient for responsiveness to shear stress.
(a) Schematic showing signalling at the junctional complex and integrins. (b) Mouse ECs were transfected with Scr or PlxnD1 siRNA, exposed to shear stress for 2min before immunoprecipitating VEGFR2 and examining its phosphorylation and association with the p85 subunit of PI3K and VE-Cadherin, n=3. (c) Mouse ECs were transfected with Scr or PlxnD1 siRNA, exposed to shear stress for 30min before immunoprecipitating integrin αVβ3 and examining its association with Shc, n=3. (d) ECs treated with VEGFR2 kinase inhibitor SU1498, transfected with siRNA to NRP1 or treated with NRP1 blocking antibody, then incubated with anti-PlxnD1-coated beads and subjected to force for 5min before examining phosphorylation of vinculin. (n=3; *p < 0.05) The data represent mean±SEM. P-values were obtained by performing two-tailed Student's t test using Graphpad Prism. (e) Mouse ECs were exposed to shear stress before immunoprecipitating VEGFR2 and examining its phosphorylation and association with PlxnD1, NRP1 and Src; n=3. (f) Mouse ECs were exposed to shear stress before immunoprecipitating NRP1 and examining its association with PlxnD1 and VEGFR2; n=3. (g) Mouse ECs transfected with either Scr or NRP1 siRNA were exposed to shear stress before immunoprecipitating VEGFR2 and examining its association with PlxnD1; n=3. (h) Schematic showing that reconstitution of PlxnD1, VEGFR2 and NRP1 in Cos7 cells confers shear stress sensitivity to these cells. (i) Cos7 cells were left untransfected or transfected with NRP1 and VEGFR2, with or without PlxnD1 before being subjected to shear stress for 2min and VEGFR2 was immunoprecipitated. Shear stress sensitivity was assessed by examining phospho-VEGFR2 levels, complex formation between VEGFR2 and Src and complex formation of PlxnD1, VEGFR2 and NRP1, n=3. All shear stress experiments were at 12 dynes/cm2 using a parallel plate system.
To investigate molecular mechanisms even further, we examined the role of the PlxnD1 co-receptor neuropilin-1 (NRP1). NRP1 is a cell surface transmembrane protein that acts as a Sema3 and VEGF co-receptor for PlxnD1 and VEGFR2, respectively24 and its presence in neurons switches the Sema3E signal from repulsion to attraction25. We found a requirement for NRP1 in the PlxnD1 force response, as both knockdown (Extended Fig. 1d) and inhibition of NRP1 abolished force-induced phosphorylation of vinculin (Fig. 3d). We also observed that shear stress induced the formation of a complex between PlxnD1, VEGFR2 and NRP1 (Fig. 3e, f) and this complex was dependent on NRP1 (Fig. 3g). Taken together, these data show that PlxnD1 associates with NRP1 and VEGFR2 in response to flow and operates upstream of both the junctional complex and integrins.
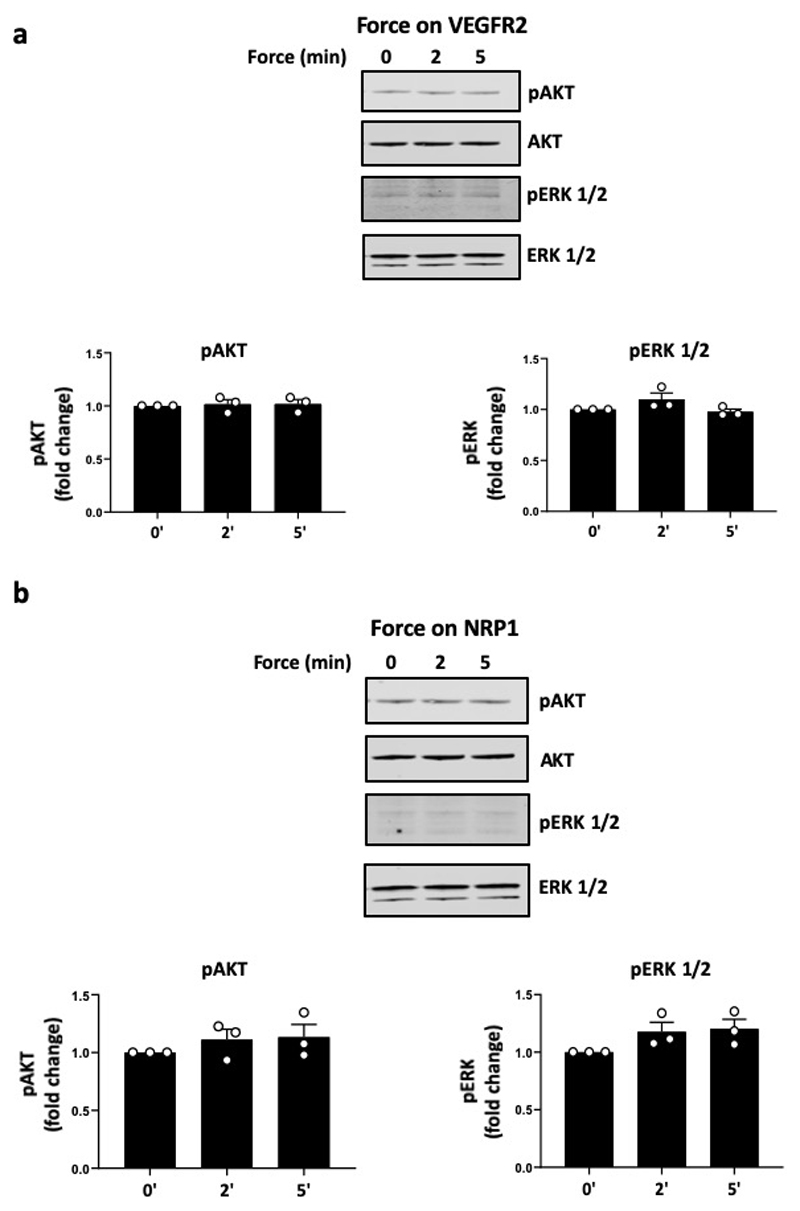
To test if PlxnD1 (and its molecular partners) is sufficient to confer mechanosensitivity in a heterologous cell line, we transfected Cos7 cells with plasmid constructs expressing PlxnD1, NRP1 and/or VEGFR2 and applied shear stress (Fig. 3h). These cells do not express any of the components of the junctional complex (i.e. PECAM-1 or VE-cadherin) and, thus, constitute an ideal system to monitor mechanical responses specifically due to PlxnD1. Cos7 cells expressing all three proteins (VEGFR2, NRP1 and PlxnD1) showed activation of early signalling responses, including phosphorylation of VEGFR2, association of VEGFR2 with Src tyrosine kinase, and PlxnD1/VEGFR2/NRP1 complex formation in response to shear stress. Importantly, none of these responses occurred in the absence of PlxnD1, thus providing further evidence that PlxnD1 is a specific and direct force sensor (Fig. 3i). Overall, these data provide evidence for a necessary and sufficient role of PlxnD1 in the shear stress-induced response. To demonstrate that PlxnD1 operates as a specific force sensor even further, we applied force on other elements of the complex. As shown in Extended Fig. 9, application of force on either NRP1 or VEGFR2 failed to elicit downstream responses. Taken together, these data unambiguously show that PlxnD1 is a specific and direct mechanosensor.
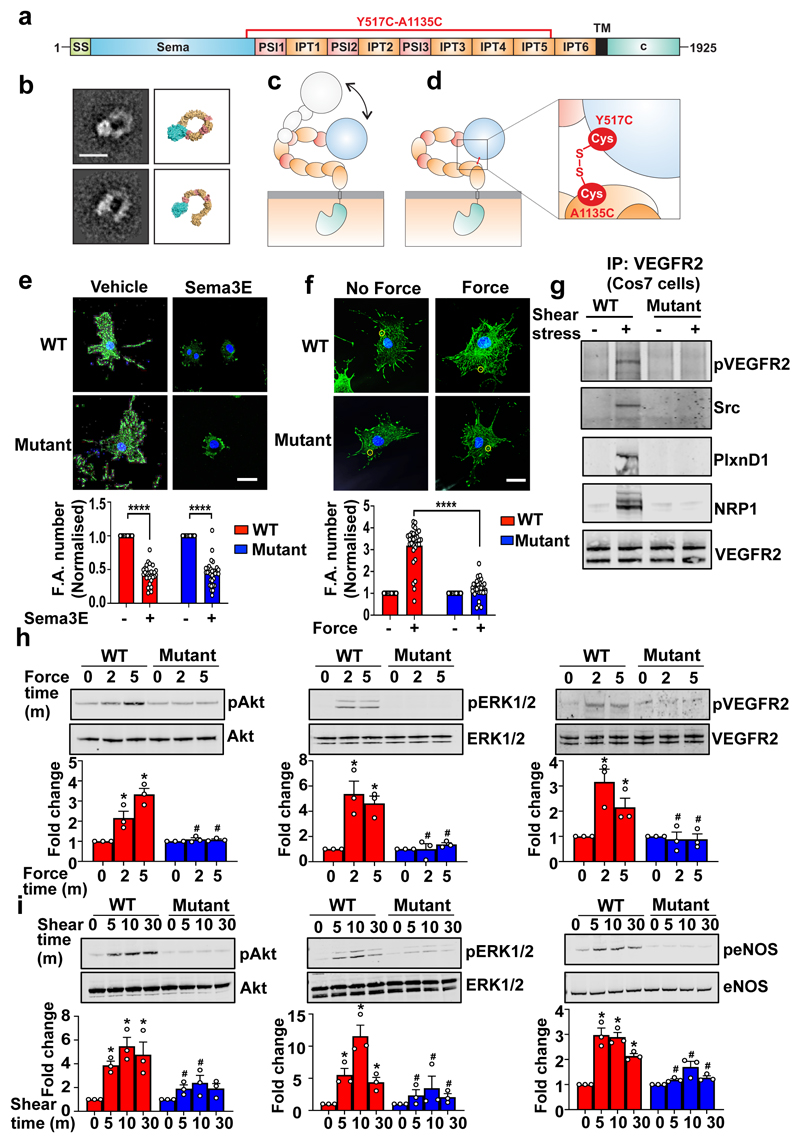
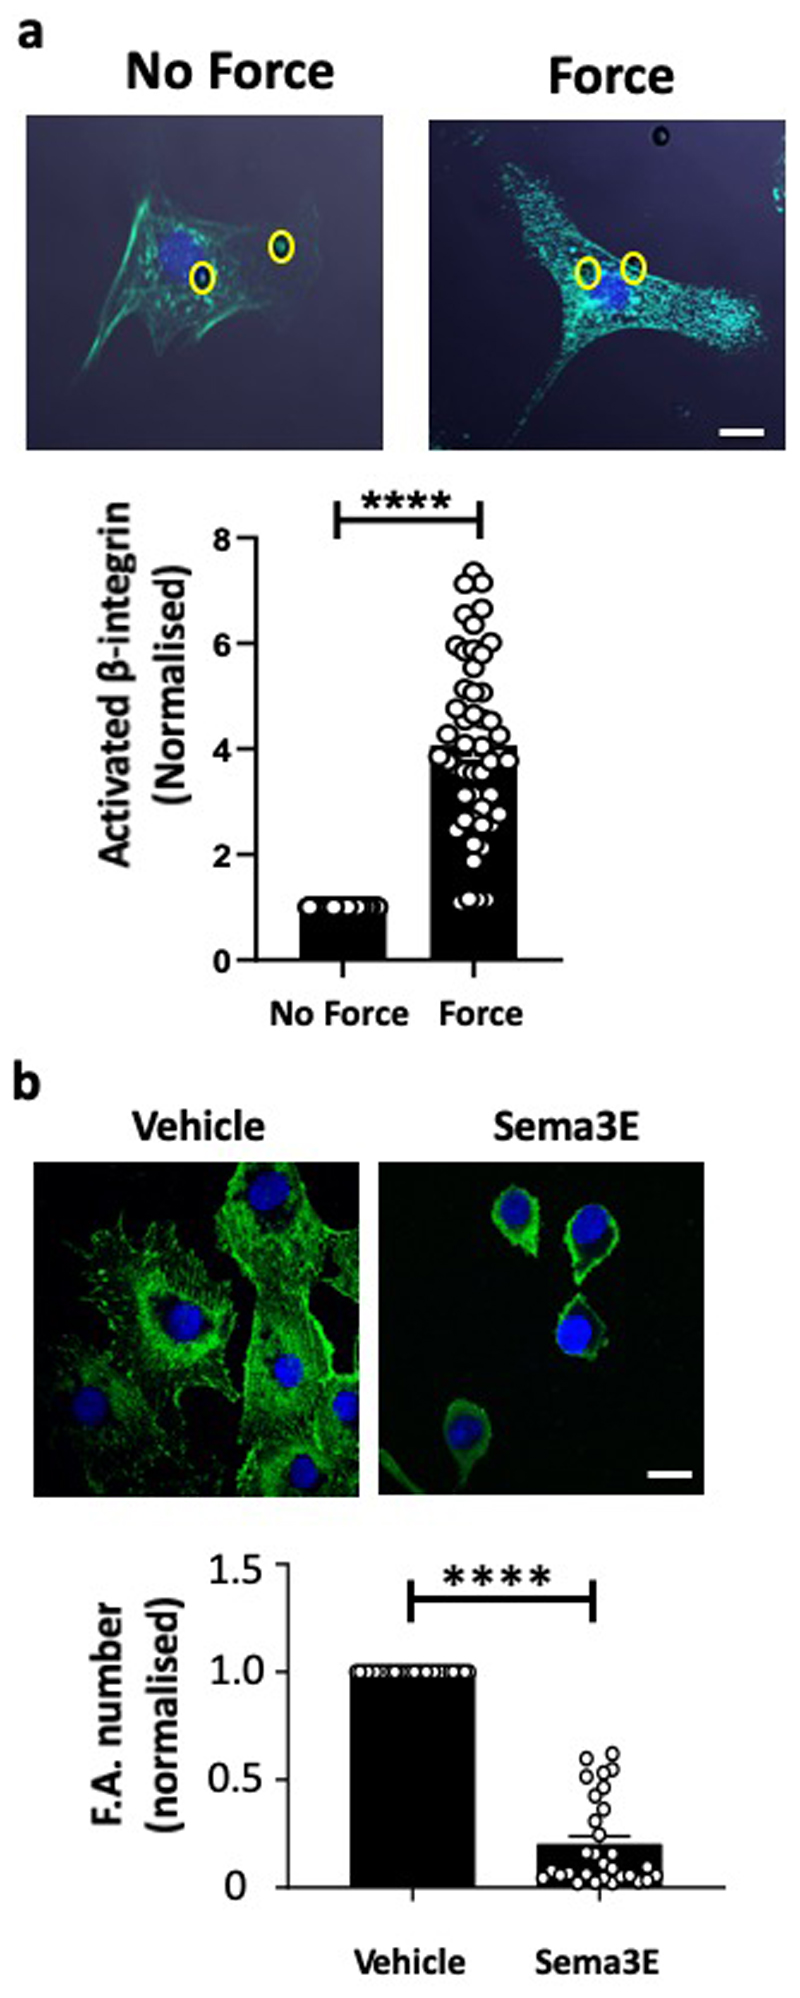
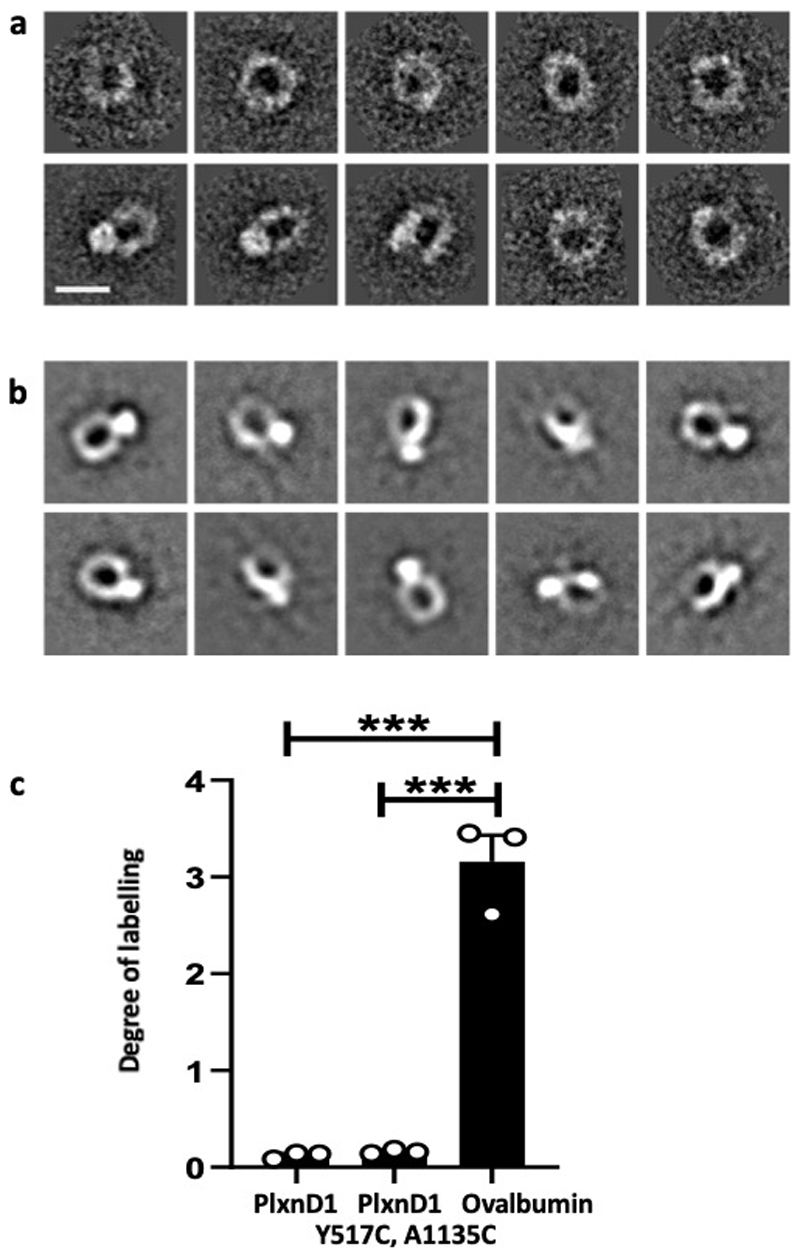
The mechanical response of PlxnD1 is in stark contrast to the ligand response, as force on PlxnD1 increases focal adhesions, whereas Sema3E treatment reduces focal adhesions and leads to collapse of the actin cytoskeleton 4 (Extended Fig. 6b). Structure-function studies on Semaphorins, Plexins and their cognate complexes, have established that the ligand-binding response requires a dimeric semaphorin to engage the N-terminal sema domains of two plexin receptors26. Recent crystal structures and negative stain electron microscopy (EM) analyses of entire, ten domain, class A plexin (PlxnA) ectodomains revealed a distinctive ring-like conformation that is suitable for coupling extracellular semaphorin-based dimerization through to the transmembrane and cytoplasmic regions to transduce the ligand-binding response 7,27. However, the negative stain EM studies also revealed that the PlxnA ectodomain is capable of flexion, with distinctive minor populations of more open conformations. We carried out negative stain EM analysis of the PlxnD1 ectodomain and found evidence that it can flex to a more open conformation although the dominant state is ring-like (Fig. 4a, 4b and Extended Data Fig. 10a). We speculated that the ability to have flexion and switch between these two conformation states might provide an explanation for the binary nature of PlxnD1 function (Fig. 4c). To examine this, we generated a double mutant of PlxnD1, Y517C A1135C, designed to promote formation of an intramolecular disulphide bond between domain 1 and domain 9 of the PlxnD1 ectodomain (Fig. 4d). Based on structural analysis, we predicted that the introduction of this disulphide bridge would lock the receptor ectodomain into the ring-like conformation, still allowing triggering of the ligand-binding reponse by Sema3E, but preventing switching to the “open” and putative mechanosensory conformation. Purification of the protein and subsequent quantitative assay using a thiol-reactive fluorescent dye, as well as negative stain EM, demonstrated that the protein did indeed contain the desired covalent disulphide linkage (Extended Fig. 10b, 10c).
Figure 4. PlxnD1 flexion is required for mechanotransduction.
(a) Schematic domain organisation of PlxnD1 spanning amino acids 1-1925. SS, signal sequence; TM, transmembrane region; c, cytoplasmic region. (b) Representative negative stain class averages of the PlxnD1 ectodomain and corresponding structural models showing the ring-like and open conformations, scale bar 10nm. 2D class averages were obtained by classifying 1357 particles into 10 classes. (c) Model of opening the ring-like ectodomain which confers PlxnD1 mechanosensory functions. (d) Design of PlxnD1 mutant with an intramolecular disulphide bond to lock the ring-like structure. Zoom-in view shows the disulphide bond between the sema domain (domain 1) and IPT5 domain (domain 9). (e,f) ECs in which endogenous PlxnD1 was knocked down were infected with adenoviruses expressing WT or Mutant PlxnD1, treated with Sema3E for 30min or incubated with anti-PlxnD1 paramagnetic beads followed by force application (10pN; 30min). Cells were immunostained with anti-vinculin antibodies. Focal adhesion number was quantified using ImageJ; n=30 cells over either 4 (in e) or 3 (in f) biological replicates ****p<0.0001; scale bar 10 μm. (g) Cos7 cells were transfected with WT or mutant PlxnD1, NRP1 and VEGFR2 before shear stress application for 2mins and VEGFR2 was immunoprecipitated. Shear stress sensitivity was assessed by examining phospho-VEGFR2 levels, complex formation between VEGFR2 and Src and complex of PlxnD1, VEGFR2 and NRP1, n=3. (h) ECs in which endogenous PlxnD1 was knocked down were infected with adenoviruses expressing WT or mutant PlxnD1 and incubated with anti-PlxnD1 paramagnetic beads followed by force application (10pN). Phosphorylation of Akt, ERK 1/2 and VEGFR2 was determined, n=3; *p<0.05 relative to “no force” condition; #p<0.05 relative to the respective WT force time point. (i) ECs in which endogenous PlxnD1 was knocked down were infected with adenoviruses expressing WT or mutant PlxnD1 and subjected to fluid shear stress. Phosphorylation of Akt, ERK 1/2 and eNOS was determined, n=3 biological repeats; *p<0.05 relative to static condition; #p<0.05 relative to the respective WT shear time point. All data are mean±SEM. P-values were obtained by performing two-tailed Student's t test using Graphpad Prism.
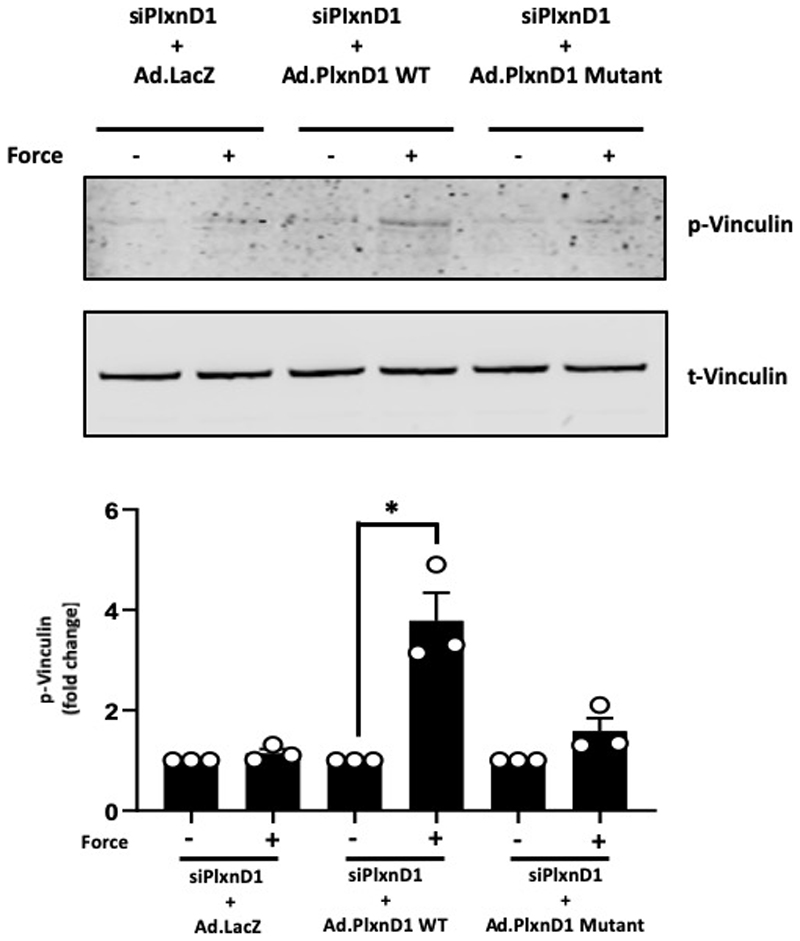
PlxnD1-depleted ECs were infected with adenovirus expressing either WT or mutant PlxnD1 and were assayed for their ability to respond to the ligand Sema3E or mechanical force. Treatment with Sema3E resulted in a decrease in focal adhesions in both WT and mutant PlxnD1 expressing cells (Fig. 4e), showing that the PlxnD1 ectodomain, when locked into a ring-like conformation, maintains its ability to bind Sema3E and signal to cause the disassembly of the cytoskeleton. We then tested if trapping the PlxnD1 in the semaphorin binding ring-like conformation was permissive of its mechanosensory function. We found that cells expressing the mutant PlxnD1 did not respond to mechanical force, as assayed by activation of early signalling responses (pVEGFR2, pAkt and pERK1/2 in Fig. 4h), cytoskeleton signalling (pVinculin in Extended Fig. 11) and focal adhesion maturation (Fig. 4f). To further determine the requirement for PlxnD1 flexion in mechanotransduction, we examined the effects of mutant PlxnD1 in shear stress signalling. In contrast to ECs expressing WT PlxnD1, ECs expressing mutant PlxnD1 were unable to activate Akt, ERK1/2 or eNOS in response to shear stress (Fig. 4i). Additionally, reconstitution of mutant PlxnD1 in Cos7 cells blocked early shear stress responses, including phosphorylation of VEGFR2, association of VEGFR2 with Src tyrosine kinase and shear stress-induced VEGFR2 and NRP1 complex formation (Fig. 4g). Collectively, these results demonstrate that trapping PlxnD1 in its ring-like conformation maintains its ligand-dependent signalling function but compromises its ability to sense and respond to mechanical force.
Our work identifies the semaphorin-binding receptor PlxnD1 as a novel force detector in ECs. One of the best-characterised mechanosensors to date is the junctional mechanosensory complex, with PECAM-1 being the molecule that can sense and respond to mechanical force 13,28,12,29. Given the proven crucial role of shear stress in cardiac and vascular development 30,31, it was always hard to reconcile the lack of developmental defects in the PECAM-1 knockout. We now identify a novel mechanosensor in ECs that operates upstream of the junctional complex. We show that onset of shear stress induces formation of a mechano-complex of PlxnD1/NRP1/VEGFR2; this complex requires the presence of NRP1 as well as flexion in the PlxnD1 ectodomain. Endothelial PlxnD1 regulates signals at junctions and integrins and downstream cellular responses to shear stress that ultimately regulate the site-specific distribution of atherosclerosis. The developmental cardiovascular defects observed in global 32, as well as EC-specific33, PlxnD1 knockouts are in agreement with a requirement for this mechanosensor during development, and as our data now demonstrate also in the adult. Despite the critical importance of mechanosensation in biology, knowledge of how mechanoreceptors detect physical force is extremely limited. Our data identify a novel mechanosensor in ECs and provide a new framework for understanding how ligand-dependent and mechanical signals can be channelled through a single receptor.
Methods
Experimental Animals
All animal experiments were approved and authorized by both the University of Oxford Local Animals Ethics and Welfare Committee and by the Home Office, UK. Project licences used in this work were 30/3080 and P0C27F69A. PlxnD1fl/fl animals were obtained from J. Epstein (University of Pennsylvania). To obtain endothelial specific deletion of PlxnD1, these mice were crossed with mice expressing an inducible Cre recombinase under the Cadherin-5 Cre driver, obtained from Ralf Adams (Max Planck Institute, Muenster). Three consecutive intra-peritoneal injections of tamoxifen (2mg each) in adult animals (6-8 weeks of age) resulted in the deletion of endothelial PlxnD1 to generate PlxnD1 inducible endothelial cell knockout PlxnD1iECKO mice. For atherosclerosis studies, the PlxnD1fl/fl-Cdh5Cre animals were crossed into the hypercholesterolemic Apolipoprotein E deficient (ApoE-/-) background. All mice used in this study were maintained on a C57BL/6J background. For en face immunofluorescent analysis and qPCR of aortas, tissue was harvested 2 weeks after the last tamoxifen injection. For atherosclerosis studies, high fat diet was commenced 1 week after the last tamoxifen injection.
All animals were housed in individually ventilated cages at 22°C, 56 % relative humidity, light/dark cycle of 12h/12h and fed on a standard chow diet (B&K Ltd., UK). For high fat diet experiments carried out on animals in the hypercholesterolemic ApoE-/- background, the animals were fed Western RD (P) VP 25kGy diet containing 20% fat, 0.15% cholesterol (829108, SDS, UK) for 10 weeks or 20 weeks. Water and food were available ad lib at all times.
Genotyping
Genotyping was determined by PCR analysis of DNA in ear notches, collected for identifying the animals, using the Phire Tissue Kit (F140-WH, Thermo Scientific).
En face preparations
Animals were induced a terminal general anaesthesia with isoflurane, followed by exsanguination and perfusion fixation with 4% paraformaldehyde. The entire length of aorta was dissected out and the surrounding connective tissue and adventitial fat were removed. The aorta was fixed in 4% paraformaldehyde and stored at 4°C in PBS until staining. Atheroprone areas from the inner curvature of the aortic arch were isolated and atheroprotective areas from the thoracic aorta were dissected and processed for immunofluorescent studies.
Oil red O staining for atherosclerosis study
Fixed aortas were rinsed in absolute propylene glycol and stained with Oil-red-O (01516, Sigma Aldrich). After washing in 85% propylene glycol solution and distilled water, the aortas were opened longitudinally to the iliac bifurcation and a coverslip was placed to flatten down the aorta with endothelial surface facing upwards. Images were acquired using Olympus SZX7 fitted with a 1x lens and image processing was performed using Image-Pro (Media Cybernetics). The plaque area was quantified as a percentage of the area of both the total aorta and the aortic arch.
Lipid Profile Analysis
Blood was sampled by cardiac puncture under terminal general anaesthesia in plasma collection tubes. Plasma samples were shipped to MRC Harwell where they were analysed for total cholesterol, triglycerides, high density lipoprotein and low density lipoprotein levels on an automated AU680 Clinical Chemistry Analyser.
Cell culture, shear stress and transfections
Bovine aortic endothelial cells (BAECs), PECAM knockout (-/-) and PECAM reconstituted (+/+) cells were cultured as previously described13. Mouse lung endothelial cells were isolated from PlxnD1fl/fl mice and maintained in EGM2 growth medium (Lonza), supplemented with 10% fetal bovine serum (FBS). Cos7 cells were maintained in DMEM with 10% FBS. All cell types were maintained at 37°C in 5% CO2 in a humidified incubator. Cells were subjected to shear stress either using a parallel plate chamber13 or a cone and plate viscometer as previously described10. For Sema3E blocking antibody experiments, cells were treated with the antibody for 1 hour prior to and during shear stress. siRNA reverse transfections for PlxnD1 were performed using the Lipofectamine RNAimax Reagent (Invitrogen). siRNAs used in this study were from Dharmacon and as follows:-
Mouse ECs
Acell Mouse PlxnD1 SMARTpool consisting of GUAUCGACCACAGAUCAUG, CGUGGACCUUGAAUGGUUU, CUAUUAUAAACAGAUCCAA and CCAACAAGCUUCUGUACGC;
Acell Mouse Piezo1 SMARTpool consisting of CUAUCAGACACCAUUUAUC, GCCUCAUCCUCUAUAAUGU, UCAUCAUCUCUAAGAAUAU, CUGUUACGCUUCAAUGCUC;
Acell Mouse GNA11 SMARTpool consisting of CCAUUUUCUAAGUUAUUGA, CUUUUGAGCACCAGUAUGU, CUGUGACCCUUGUAUAUUA, CUGUCAGAUUUCUUUACUU;
Acell Mouse GNAQ SMARTpool consisting of UUGUCAAGUUGUACGAAUU, CCAGGAUCAUAAGUGUUAA, GUAUAGUGCAAUUAUGAAU, CGAUCAUACUAGGAGGGAU
Acell NRP1 SMARTpool consisting of GCAGGAUUUUCCAUACGUU, CUUGAAUGCACUUAUAUUG, UGGUUAUCCUCAUUCUUAU, UCCUGGAAUUUGAAAGCUU
Bovine ECs
PlxnD1 custom duplex consisting of GGGAAAACAUCGAGGCCAAUU and UUGGCCUCGAUGUUUUCCCUU
Transfections of plasmids expressing NRP1, VEGFR2 and PlxnD1 in Cos7 cells were performed with Lipofectamine-2000 (Invitrogen) as per manufacturer’s instructions.
RNA Extraction and Q-PCR
Total RNA extraction was performed from cells or from tissue using the RNeasy Plus mini kit (Qiagen), with an additional genomic DNA wipeout step. Reverse transcription was performed using the Superscript III cDNA synthesis kit. Quantitative real-time PCR was performed in triplicate with SYBR green and CFX96TM real-time system. Thermocycling conditions were 95°C for 3 minutes, followed by 40 cycles of 95°C for 15s, 60°C for 45s. Gene expression was normalised to the constitutively expressed housekeeping gene 18s rRNA, and relative expression was calculated and plotted employing the ΔΔCt method. Primer sequences used were as follows:-
KLF2 – 5’-CTAAAGGCGCATCTGCGTA-3’
5’-TAGTGGCGGGTAAGCTCGT-3’
KLF4 – 5’-CGACTAACCGTTGGCGTGA-3’
5’-GAGGTCGTTGAACTCCTCGG-3’
MCP-1 – 5’-CATCCACGTGTTGGCTCA-3’,
5’GATCATCTTGCTGGTGAATGAGT-3’
VCAM-1 – 5’-GCTATGAGGATGGAAGACTCTGG-3’,
5’-ACTTGTGCAGCCACCTGAGATC-3’
18s rRNA – 5’-AGGAATTGACGGAAGGGCACCA-3
5’-GTGCAGCCCCGGACATCTAAG-3′
Immunofluorescence
Tissue and cell permeabilization were performed by incubation with 0.5% TritonX-100 overnight and 0.2% TritonX-100 respectively and blocked with 10% normal goat serum/1% BSA. Inner curvatures of aortic arch were incubated with primary antibodies (CD106 (VCAM), 553330; BD Biosciences and MCP-1, ab7202; Abcam) and descending aorta segments were incubated with primary antibodies (PlxnD1 (PA5-21605; ThermoFisherScientific) and PECAM-1 (553369; BD Biosciences) before incubation with Alexa Fluor 488– and Alexa Fluor 568–conjugated secondary antibodies (1:100; Invitrogen). Cells subjected to flow or tissues were incubated at 4°C overnight in beta catenin (610153; BD Biosciences) followed by 1 hr incubation of Alexa Fluor 488-conjugated phallodin (Invitrogen) at RT and DAPI (Invitrogen). Tissues were mounted en face with Prolong Gold Antifade mountant (Invitrogen) for confocal imaging using Olympus FluoView3000.
Image analysis
For in vitro flow experiment quantification, cell alignment in the direction of flow was determined by measurement of the angle between the flow direction and the long axis of the cell as determined visually34. Cell elongation was estimated as the ratio of cell length to cell width in both in vitro and in vivo study35. Measurement of the fluorescence intensity of VCAM, MCP-1 and phallodin was performed using ImageJ software (Analyze→Set Measurements→Mean gray value→ Measure). Quantification of the colocalization was performed using coloc2 plugin on ImageJ.
Co-immunoprecipitation and Western blotting
Cells were harvested in lysis buffer as described in 19 and supplemented with protease and phosphatase inhibitor cocktail tablets. Lysates were pre-cleared with 10 μl protein A/G plus sepharose beads (Santa Cruz Biotechnology) for 1 hr at 4°C. The pre-cleared lysates were then incubated with 20 μl of protein A/G plus sepharose beads, which had previously been coupled to the appropriate primary antibody for 2 hours at 4°C on an orbital shaker. The beads were washed three times with the lysis buffer supplemented with protease and phosphatase inhibitors. The immunoprecipitation complexes were eluted from the beads by boiling in 2X SDS buffer for 5 minutes.
For all western blotting analyses, protein lysates/co-immunoprecipitation complexes were resolved on a 4-12% gradient gel with the appropriate primary antibodies and IRDye-conjugated anti-mouse, anti-goat or anti-rabbit secondary antibodies, as appropriate. Images were acquired on a LICOR Odyssey infra-red scanner. Densitometric quantification of bands was performed using the ImageStudio software (LICOR Biosciences).
Inhibitors, Antibodies and other Reagents
The antibodies used for western blotting included phospho(p)-ERK1/2T-202;Y-204, total(t)-ERK1/2, pAktS473, tAkt, p-eNOSS1177, pVEGFR2Y1175, tVEGFR2 (all antibodies from Cell Signaling Technology), t-eNOS (BD Biosciences), p-VinculinY822 (AbCam), t-Vinculin (Sigma Aldrich), PI3K/P85 (Upstate), integrin αvβ3 (clone LM609, Merck), Shc (Abcam),VE-cadherin (Santa Cruz), PlxnD1 (Thermo Fisher Scientific and Abcam), Piezo1 (Abcam), Gq/11 (Santa Cruz Biotechnology), Src (Upstate)
The inhibitors used in the study included VEGFR2 tyrosine kinase inhibitor SU1498 (Sigma Aldrich). Recombinant Semaphorin 3E was purchased from R&D Systems (Bio-techne, Minneapolis, MN, USA) and used at 10 μM. NRP1 blocking antibody was purchased from R&D Systems and Sema3E blocking antibody was from Thermo Fisher Scientific USA.
Bead pulling/Magnetic tweezer system
Tosyl activated paramagnetic beads (4.5 μm) were washed with PBS and coated with an antibody to the extracellular domain of PlxnD1 (Santa Cruz) or CD44 (clone 5D2-27 from Developmental Studies Hybridoma Bank, USA) Beads were quenched in 0.2M Tris, pH 7.4 prior to use, to eliminate any remaining tosyl groups. ECs were incubated with the beads (and inhibitor or blocking antibody, if appropriate) prior to force application for 5-30 minutes at 37°C. For immunofluorescence, ECs grown on fibronectin-coated coverslips were fixed for 20 minutes in PBS containing 2% formaldehyde, permeabilized with 0.2% Triton X-100 and blocked with 10% goat serum for 1 hour at room temperature. Antibody incubations for vinculin and HUTS4 were performed as previously described12. Focal adhesion number was quantified as previously described36. Ligated β1 integrin staining was quantified by determining the mean fluorescence intensity on ImageJ software. For examining phosphorylation of vinculin, cells were lysed as described above and lysates immunobloted with a primary antibody to phospho-vinculin (Abcam).
Calcium Imaging
BAECs were cultured in 33mm glass bottom dishes to form a sub-confluent monolayer. After the cells had fully attached and spread, 4 µM of Fluo-8 AM calcium binding dye (Abcam) was added to the media. Cells were incubated for 30 minutes with the dye. Beads conjugated with either PlxnD1 or Poly L-Lysine were added to the cells and incubated for another 30 minutes. To assess the calcium influx as a result of mechanical stimulation, cells with Fluo-8 and magnetic beads were subjected to 1 nN force applied with magnetic tweezers. Time-lapse video of epifluorescent calcium imaging was acquired with Nikon Ti-e microscope (60x objective) during 10s pre stimulation, 20s stimulation and 30s post stimulation.
Acquired image sequences were analysed by measuring mean fluorescence intensity (mean pixel value) for each cell at each frame. Mean peak amplitude for each phase (pre-stimulation and during stimulation) was calculated and normalised against pre-stimulation fluorescence intensity for each cell.
Sema3E Challenge
BAECs in which endogenous PlxnD1 was knocked down with siRNA were infected with either WT or mutant PlxnD1-expressing adenoviruses. Cells were serum-starved and treated with recombinant Sema3E before processing for immunofluorescence with phalloidin, DAPI and anti-vinculin antibody. Images were taken on a Zeiss LSM 880 Airy Scan Confocal microscope and analysed using ImageJ (Schneider et al., 2012) using an in-house macro to measure cell area, focal adhesion number and focal adhesion area. Statistical analyses were performed using GraphPad Prism 7 (La Jolla, CA, USA). Comparisons between groups were assessed by 2-way ANOVA with a Tukey multiple comparisons post hoc test. Difference were considered significant when P < 0.05.
Site-directed mutagenesis
In order to lock the ectodomain of PlxnD1 in the ring-like conformation we designed a double mutant introducing two single point mutations Y517C and A1135C in the sema domain (domain 1) and IPT5 domain (domain 9), respectively. Site-directed mutagenesis of full length PlxnD1, and of PlxnD1 ectodomain, was carried out by multiple-step overlap-extension PCR, and the resulting PCR products were cloned into a pHLSec vector37.
Protein production
Constructs encoding the ectodomain (residues 47-1271) of mouse PlxnD1 or double mutant PlxnD1 Y517C, A1135C were cloned into pHLsec vector in frame with a C-terminal hexahistidine (His6) tag. Protein was produced by transient transfection in HEK293T cells at 37°C. Five days post-transfection, the conditioned medium was collected and buffer exchanged using a QuixStand diafiltration system (GE Healthcare). The double mutant of PlxnD1 was secreted at a similar level to the wild-type protein. Proteins were purified by immobilized metal-affinity chromatography using a HisTrap FF column (GE Healthcare) followed by size-exclusion chromatography using a Superdex 200 Increase 10/300 column (GE Healthcare).
Alexa Fluor labelling of PlxnD1 Y517C, A1135C for validation of disulphide bond formation
PlxnD1 Y517C, A1135C at a concentration of 10 µM in PBS was labelled with a 20-fold molar excess of a thiol-reactive fluorescent dye, Alexa Fluor 488 C5 maleimide (ThermoFisher), and the reaction was allowed to proceed for 24 h at 6°C in the dark. Unreacted dye was removed from the labelled protein using a Sephadex G-25 (GE Healthcare). The degree of labelling (n) was determined using the following formula (Eq.1):
| (Eq.1) |
where A488 is the absorbance at 488 nm, Mw is the molecular weight of protein, ε is the molar extinction coefficient of the dye and c is the protein concentration in mg/ml. Hen egg ovalbumin (GE Healthcare) was used as a positive control.
Negative stain electron microscopy (EM)
A drop of 2.5 μl freshly gel-filtrated PlxnD1 ectodomain at a concentration of 1-5 μ g/ml in 10 mM HEPES, pH 7.5 and 150 mM sodium chloride was adsorbed to the newly glow-discharged carbon-coated copper grid, washed with two drops of 50 μl deionized water, and stained with two drops of 50 μl 0.75% uranyl formate. The excess stain on the grids was removed with filter paper before air-drying. Samples were imaged at room temperature using an FEI Tecnai T12 electron microscope equipped with a LaB6 filament operating at an acceleration voltage of 120 kV and a dose of 15 electrons per square Å. Images were taken using a 4k × 4k FEI Eagle TM CCD camera at a magnification of 57,000 × with under-focus values ranging from 1.0 to 1.5 μm and a pixel size of 2.16 Å. The particle images were normalized, re-scaled, filtered before being subjected to reference-free classification in EMAN2 38.
The PlxnD1 structural models were generated manually using The PyMOL Molecular Graphics System (Schrödinger, LLC).
Cloning and Adenoviral Generation
WT and Mutant PlxnD1 were cloned into the pENTR/TOPO entry vector of the Gateway System® (Invitrogen) using the KOD Hot Start High Fidelity polymerase. Following confirmation of successful cloning by Sanger sequencing, the constructs were sub-cloned into the pAd/CMV/V5-Dest destination vector by LR Clonase II reaction. All steps were performed as per manufacturer’s instructions. The destination vector was linearized by PacI digestion and transfected into HEK-293A cells for adenoviral generation and subsequent amplification, as per manufacturer’s instructions. In experiments where adenoviral over-expression was employed, endogenous levels of PlxnD1 were knocked down with siRNA pool to minimise any background signals.
Statistics
Data are presented as means ± SEM. All experiments were performed at least three times independently. Statistical significance was tested by employing either analysis of variance test or unpaired Student’s t-tests, as indicated in Results. Data were tested for normality using the Shapiro-Wilk test and equality of variance using the Levene test. Where necessary data were log transformed before being analyzed for statistical significance. All image analysis was performed by operators who were blinded to the treatments administered.
Extended Data
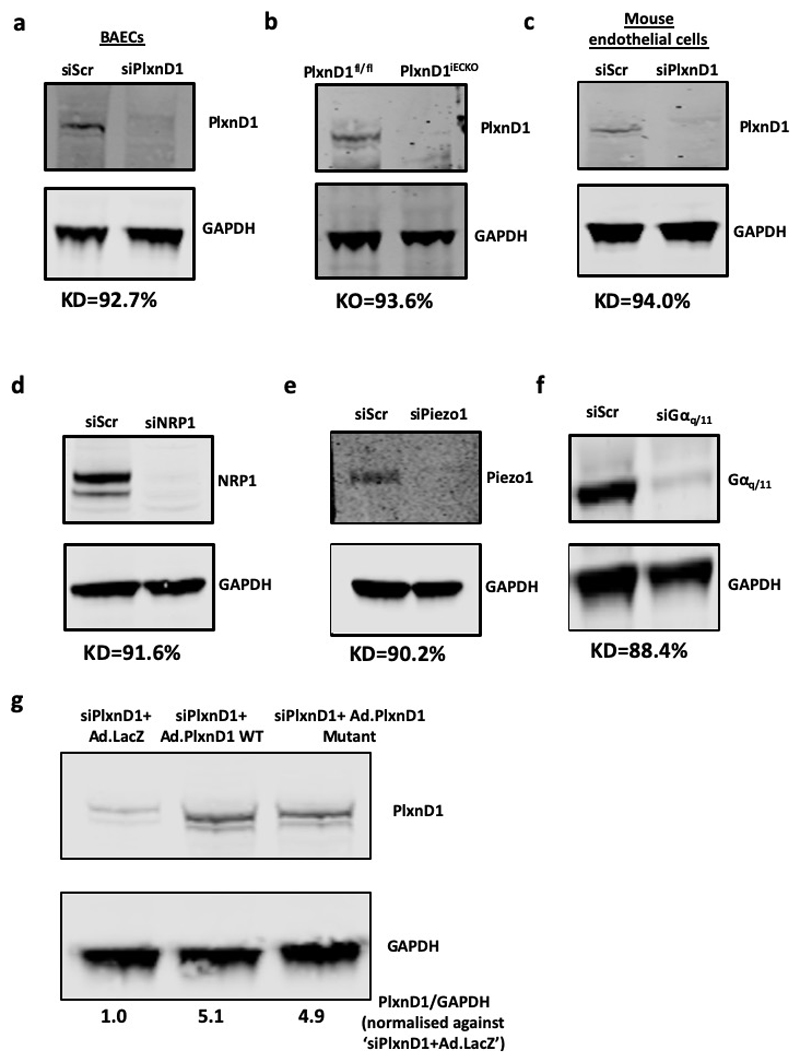
Extended Data Figure 1. Knockout/knockdown of PlxnD1 and other genes in ECs.
(a-f) ECs were either isolated from PlxnD1fl/fl and PlxnD1iECKO mice, or treated with siRNAs to knockdown PlxnD1, NRP1, Piezo1 and Gαq/11. Knockdowns/knockouts were confirmed by western blotting, using GAPDH as a loading control (g) PlxnD1 was knocked down in mouse ECs using a pool of siRNAs, followed by infection with an adenovirus expressing either β-galactosidase (LacZ), WT or mutant PlxnD1. Protein levels were normalised against the housekeeping gene GAPDH. KD=Mean knockdown efficiency based on n=3; KO= Mean knockout efficiency based on n=3.
Extended Data Figure 2. PlxnD1 mediates the endothelial cell response to fluid shear stress.
(a) Bovine aortic ECs (BAECs) were transfected with Scr or PlxnD1 siRNA and exposed to laminar fluid shear stress (12 dynes/cm2) using a parallel plate system for the indicated time periods. Phosphorylation of Akt (n=6), ERK1/2 (n=5) and eNOS (n=8) was determined by western blotting and quantified using Image Studio Lite Ver 5.2. The data represent mean±SEM. P-values were obtained by performing two-tailed Student's t test using Graphpad Prism.*p<0.05 relative to static condition; #p<0.05 relative to the respective siScr shear time point. (b) BAECs were transfected with Scr or PlxnD1 siRNA and exposed to atheroprotective shear stress for 24 hours. Cells were fixed and stained with phallodin and DAPI as well as antibodies to β-catenin to visualise actin stress fibres, nuclei and cell junctions, respectively. Quantification of alignment was performed using ImageJ; n>50cells over 4 biological replicates (for exact n, please refer to source data). The data represent mean±SEM. P-values were obtained by performing two-tailed Student's t test using Graphpad Prism; ****p<0.0001
Extended Data Figure 3. Mechanotransduction via PlxnD1 is independent of its ligand binding functions.
(a) BAECs were treated with Sema3E function blocking antibody or control antibody (1ug/ml) and exposed to fluid shear stress for the indicated times. Phosphorylation of eNOS, Akt and ERK1/2 was determined by western blotting and quantified using Image Studio Lite Ver 5.2, n=3 biological repeats. The data represent mean±SEM. (b) BAECs were treated with Sema3E blocking antibody or control antibody for 1 hour before being exposed to Sema3E for 30 minutes at the indicated concentrations. Cells were fixed and probed with anti-vinculin, then stained with phalloidin and DAPI to visualise focal adhesions, actin stress fibres and nuclei, respectively. EC collapse was quantified by measuring cell area using ImageJ. The data represent mean±SEM. Significance was determined by ANOVA with a Tukey post hoc test in Graphpad Prism; ****p<0.0001. n=59-82 cells over 3 independent experiments (for exact n, please refer to source data); scale bar represents 50 μm.
Extended Data Figure 4. Lipid profile analysis and expression of inflammatory markers in the aortic arch.
(a) Bodyweights and lipid profile analysis of PlxnD1fl/fl; ApoE-/- and PlxnD1iECKO; ApoE-/- mice after 10 weeks of high fat diet feeding (at 16-17 weeks of age); n=8. The data represent mean±SEM. (b) Representative en face preparations of aortic arches immunostained for VCAM-1 (n=3) and MCP-1 (n=5) from PlxnD1fl/fl; ApoE-/- and PlxnD1iECKO, ApoE-/- mice with quantification of fluorescence intensity in fold change; 3-5 images taken from the inner curvature of aortic arches of each mice. The data represent mean±SEM. P-values were obtained by performing two-tailed Student's t test using Graphpad Prism, *p<0.05
Extended Data Figure 5. Atherosclerosis in the descending aorta.
(a) Representative en face preparations of the whole aorta showing atherosclerosis in PlxnD1fl/fl; ApoE-/- and Plxn D1iECKO; ApoE-/- mice after 20 weeks of high fat diet feeding, visualised by Oil red O staining. (b) Quantification of lesion area in the thoracic aortas, abdominal aortas and whole descending aortas (thoracic aorta+abdominal aorta) from PlxnD1fl/fl; ApoE-/- and PlxnD1iECKO; ApoE-/- mice; n=9 PlxnD1fl/fl; ApoE-/- and 8 PlxnD1iECKO; ApoE-/-. The data represent mean±SEM. P-values were obtained by performing two-tailed Student's t test using Graphpad Prism *p<0.05, **p<0.01, ****p<0.0001
Extended Data Figure 6. Mechanical force on PlxnD1 results in integrin activation, but ligand stimulation causes ECs to collapse.
(a) BAECs were incubated with anti-PlxnD1-coated beads and subjected to force (10pN) for 5 minutes. ECs were fixed and stained with HUTS4 antibody to mark ligated β1 integrin. Mean fluorescence intensity was quantified using ImageJ software. Values were normalised to the “no force” condition. Location of the beads are highlighted in yellow circles. n=50 cells/condition from 3 independent experiments. The data represent mean±SEM. P-values were obtained by performing two-tailed Student's t test using Graphpad Prism ****p<0.0001, scale bar represents 10 μm. (b) BAECs were incubated with Sema3E or vehicle, fixed and stained with anti-vinculin antibody to mark focal adhesions. Focal adhesion number was quantified using ImageJ software. Values were normalised to the “vehicle” condition. n=30 cells/condition from 3 independent experiments. The data represent mean±SEM. P-values were obtained by performing two-tailed Student's t test using Graphpad Prism ****p<0.0001, scale bar represents 10 μm.
Extended Data Figure 7. PlxnD1 co-localises and associates with members of the junctional mechanosensory complex, and its levels are not regulated by flow, unlike Sema3E.
(a) The descending thoracic aorta or the inner curvature of aortic arches were isolated and prepared en face from wild-type mice and stained for PlxnD1, PECAM-1 and DAPI. Quantification of PlxnD1 levels was performed by fluorescence intensity measurement on ImageJ; 4-6 images were taken on tissue collected from n=4 animals. The data represent mean±SEM. Scale bar represents 20 μm (b) The descending thoracic aorta was isolated and prepared en face from PlxnD1iECKO mice and stained for PlxnD1 to assess the specificity of the PlxnD1 immunostain, n=3 animals all showing similar result. (c) The descending thoracic aorta or the inner curvature of aortic arches were isolated and prepared en face from wild-type mice and stained for Sema3E, PECAM-1 and DAPI. Quantification of Sema3E levels was performed by fluorescence intensity measurement on ImageJ; 4-6 images were taken on tissue collected from n=3 animals. The data represent mean±SEM. P-values were obtained by performing two-tailed Student's t test using Graphpad Prism *p<0.05; scale bar represents 20 μm (d) Mouse ECs were exposed to shear stress for the indicated times or left as static controls before immunoprecipitating PlxnD1 and examining its association with the junctional mechanosensory complex (PECAM, VE-cadherin and VEGFR2) as well as PI3K/p85, n=3
Extended Data Figure 8. Relationship of PlxnD1 with other established mechanosensors.

(a) PECAM+/+ and PECAM-/- ECs were incubated with anti-PlxnD1-coated beads and subjected to force application for 5 minutes before examining phosphorylation of vinculin (n=3; *p < 0.05). (b,c) Mouse ECs were treated with siRNAs to Piezo1 and Gαq/11, then incubated with anti-PlxnD1-coated beads and subjected to force application for 5 minutes before examining phosphorylation of vinculin (n=3; *p < 0.05). The data represent mean±SEM. P-values were obtained by performing two-tailed Student's t test using Graphpad Prism
Extended Data Figure 9. Force application on other members of the PlxnD1 mechano-complex does not elicit a mechanotransduction response.
Mouse ECs were incubated with (a) anti-VEGFR2 or (b) anti-NRP1 antibody-coated beads and subjected to force (10pN) for the indicated time periods. Phosphorylation of Akt and ERK1/2 was determined by western blotting and quantified using Image Studio Lite Ver 5.2, n=3 biological repeats. The data represent mean±SEM.
Extended Data Figure 10. Validation of the PlxnD1 mutant.
(a) Negative stain 2D class averages of PlxnD1 WT were obtained by classifying 1305 particles into 10 classes. Scale bar represents 10 nm. (b) Negative stain 2D class averages of PlxnD1 mutant were obtained by classifying 1357 particles into 10 classes. (c) The double mutant of PlxnD1 was labelled with a thiol-reactive fluorescent dye, Alexa Fluor 488 C5 maleimide. The degree of labelling shows that the vast majority of PlxnD1 mutant molecules form the disulphide linked bond and thus the ring of the majority of PlxnD1 mutant molecules appears to be locked by the covalent bond. The degree of labelling for the hen egg ovalbumin, which we used as a positive control, is close to the number of free cysteines in ovalbumin; n=3. The data represent mean±SEM. P values were calculated by two-tailed t-test in Graphpad Prism, ***p<0.001
Extended Data Figure 11. An open conformation of PlxnD1 is required for force-dependent signalling.
Mouse lung ECs in which endogenous PlxnD1 was knocked down were infected with adenoviruses expressing β-galactosidase (Ad.LacZ), WT or Mutant PlxnD1 and incubated with anti-PlxnD1 paramagnetic beads, followed by force application for 5 minutes before lysing and assaying vinculin phosphorylation by Western blotting; n=3 biological repeats. The data represent mean±SEM. P-values were obtained by performing two-tailed Student's t test using Graphpad Prism; *p<0.05.
Supplementary Material
Acknowledgements
This work was supported in part by grants from Wellcome (Senior Research Fellowship to E.T.), BHF (PG/16/29/32128 to E.T.), John Fell Fund (to E.T.) and the BHF Centre of Excellence, Oxford (RE/13/1/30181), Cancer Research UK and the UK Medical Research Council (to EYJ, C375/A17721 and MR/M000141/1), and Wellcome Trust grant 203141/Z/16/Z supporting the Wellcome Centre for Human Genetics and MICRON imaging facility (http://micronoxford.com, supported by WellcomeStrategic Awards 091911/B/10/Z and 107457/Z/15/Z). We thank Prof Keith Channon and Dr Gillian Douglas for providing the Home Office Project Licences under which part of the animal studies were performed, Dr Andrew Jefferson for help with confocal imaging, for technical advice and access to equipment, Dr Vitul Jain for providing the NRP1 plasmid and Dr Luke Payne for help with qPCR.
Footnotes
Author Contributions
V.M. performed/was involved in majority of the experiments and analysis. K.L.P. performed en face staining and imaging of all aortas, staining and imaging for in vitro alignment, most qPCR experiments and quantification of the data. D.R. designed and validated the ring-locked PlxnD1 mutant. K.N. performed activation of signalling mediators in response to shear stress and initial magnetic force application experiments. A.K. performed semaphorin challenge experiments and analysed the data. D.L. performed the calcium imaging experiments. D.L. performed the calcium imaging experiments. Y.K. provided structural analysis of the PlxnD1 ectodomain. D.K. and M.A. carried out the negative stain EM analysis. J.H. performed the initial PlxnD1 siRNA experiments. Y.F. provided the design of the cone-and-plate. A.H. led and supervised the calcium imaging experiments. Y.F. provided the design of the cone and plate system. J.S.R. co-supervised and interpreted data, conceived and developed the idea of the binary conformations of PlxD1 and performed cloning of the PlxnD1 WT and mutant constructs into adenovirus. E.Y.J. led and supervised the structural biology based components of the study. E.T. initiated the project, generated research funds and ideas, directed and coordinated the project. V.M., J.S.R., E.Y.J. and E.T. designed experiments, interpreted data and wrote the manuscript, with inputs from all authors.
Reprints and permissions information is available at www.nature.com/reprints.
The authors declare no competing financial interests.
Data availability
The datasets generated during and/or analysed during this study are either included within the manuscript or are available from the corresponding author on reasonable request. Source data for Fig.1-4 and Extended Data Fig 2-11 are included in the online version of the paper. Gel Source Data can be found in Supplementary Fig. 1.
References
- 1.Davies PF. Flow-mediated endothelial mechanotransduction. Physiological reviews. 1995;75:519–560. doi: 10.1152/physrev.1995.75.3.519. [DOI] [PMC free article] [PubMed] [Google Scholar]
- 2.Givens C, Tzima E. Endothelial Mechanosignaling: Does One Sensor Fit All? Antioxid Redox Signal. 2016;25:373–388. doi: 10.1089/ars.2015.6493. [DOI] [PMC free article] [PubMed] [Google Scholar]
- 3.Sakurai A, et al. Semaphorin 3E initiates antiangiogenic signaling through plexin D1 by regulating Arf6 and R-Ras. Mol Cell Biol. 2010;30:3086–3098. doi: 10.1128/MCB.01652-09. [DOI] [PMC free article] [PubMed] [Google Scholar]
- 4.Aghajanian H, et al. Semaphorin 3d and semaphorin 3e direct endothelial motility through distinct molecular signaling pathways. J Biol Chem. 2014;289:17971–17979. doi: 10.1074/jbc.M113.544833. [DOI] [PMC free article] [PubMed] [Google Scholar]
- 5.Jongbloets BC, Pasterkamp RJ. Semaphorin signalling during development. Development. 2014;141:3292–3297. doi: 10.1242/dev.105544. [DOI] [PubMed] [Google Scholar]
- 6.Hahn C, Schwartz MA. Mechanotransduction in vascular physiology and atherogenesis. Nature reviews Molecular cell biology. 2009;10:53–62. doi: 10.1038/nrm2596. [DOI] [PMC free article] [PubMed] [Google Scholar]
- 7.Kong Y, et al. Structural Basis for Plexin Activation and Regulation. Neuron. 2016;91:548–560. doi: 10.1016/j.neuron.2016.06.018. [DOI] [PMC free article] [PubMed] [Google Scholar]
- 8.SenBanerjee S, et al. KLF2 Is a novel transcriptional regulator of endothelial proinflammatory activation. The Journal of experimental medicine. 2004;199:1305–1315. doi: 10.1084/jem.20031132. [DOI] [PMC free article] [PubMed] [Google Scholar]
- 9.Hamik A, et al. Kruppel-like factor 4 regulates endothelial inflammation. The Journal of biological chemistry. 2007;282:13769–13779. doi: 10.1074/jbc.M700078200. [DOI] [PubMed] [Google Scholar]
- 10.Wu C, et al. Mechanosensitive PPAP2B Regulates Endothelial Responses to Atherorelevant Hemodynamic Forces. Circ Res. 2015;117:e41–e53. doi: 10.1161/CIRCRESAHA.117.306457. [DOI] [PMC free article] [PubMed] [Google Scholar]
- 11.Zhang SH, Reddick RL, Piedrahita JA, Maeda N. Spontaneous hypercholesterolemia and arterial lesions in mice lacking apolipoprotein E. Science (New York, N.Y.) 1992;258:468–471. doi: 10.1126/science.1411543. [DOI] [PubMed] [Google Scholar]
- 12.Collins C, et al. Localized tensional forces on PECAM-1 elicit a global mechanotransduction response via the integrin-RhoA pathway. Current biology : CB. 2012;22:2087–2094. doi: 10.1016/j.cub.2012.08.051. [DOI] [PMC free article] [PubMed] [Google Scholar]
- 13.Tzima E, et al. A mechanosensory complex that mediates the endothelial cell response to fluid shear stress. Nature. 2005;437:426–431. doi: 10.1038/nature03952. [DOI] [PubMed] [Google Scholar]
- 14.Li J, et al. Piezo1 integration of vascular architecture with physiological force. Nature. 2014;515:279–282. doi: 10.1038/nature13701. [DOI] [PMC free article] [PubMed] [Google Scholar]
- 15.Xu J, et al. GPR68 Senses Flow and Is Essential for Vascular Physiology. Cell. 2018;173:762–775 e716. doi: 10.1016/j.cell.2018.03.076. [DOI] [PMC free article] [PubMed] [Google Scholar]
- 16.Bays JL, Campbell HK, Heidema C, Sebbagh M, DeMali KA. Linking E-cadherin mechanotransduction to cell metabolism through force-mediated activation of AMPK. Nat Cell Biol. 2017;19:724–731. doi: 10.1038/ncb3537. [DOI] [PMC free article] [PubMed] [Google Scholar]
- 17.Katsumi A, Orr AW, Tzima E, Schwartz MA. Integrins in Mechanotransduction. Journal of Biological Chemistry. 2004;279:12001–12004. doi: 10.1074/jbc.R300038200. [DOI] [PubMed] [Google Scholar]
- 18.Jalali S, et al. Integrin-mediated mechanotransduction requires its dynamic interaction with specific extracellular matrix (ECM) ligands. Proceedings of the National Academy of Sciences of the United States of America. 2001;98:1042–1046. doi: 10.1073/pnas.031562998. [DOI] [PMC free article] [PubMed] [Google Scholar]
- 19.Liu Y, Sweet DT, Irani-Tehrani M, Maeda N, Tzima E. Shc coordinates signals from intercellular junctions and integrins to regulate flow-induced inflammation. The Journal of Cell Biology. 2008;182:185–196. doi: 10.1083/jcb.200709176. [DOI] [PMC free article] [PubMed] [Google Scholar]
- 20.Albarran-Juarez J, et al. Piezo1 and Gq/G11 promote endothelial inflammation depending on flow pattern and integrin activation. J Exp Med. 2018;215:2655–2672. doi: 10.1084/jem.20180483. [DOI] [PMC free article] [PubMed] [Google Scholar]
- 21.Wang S, et al. Endothelial cation channel PIEZO1 controls blood pressure by mediating flow-induced ATP release. J Clin Invest. 2016;126:4527–4536. doi: 10.1172/JCI87343. [DOI] [PMC free article] [PubMed] [Google Scholar]
- 22.Dela Paz NG, Melchior B, Frangos JA. Shear stress induces Galphaq/11 activation independently of G protein-coupled receptor activation in endothelial cells. Am J Physiol Cell Physiol. 2017;312:C428–C437. doi: 10.1152/ajpcell.00148.2016. [DOI] [PMC free article] [PubMed] [Google Scholar]
- 23.Dela Paz NG, Frangos JA. Rapid flow-induced activation of Galphaq/11 is independent of Piezo1 activation. Am J Physiol Cell Physiol. 2019 doi: 10.1152/ajpcell.00215.2018. [DOI] [PMC free article] [PubMed] [Google Scholar]
- 24.Gay CM, Zygmunt T, Torres-Vazquez J. Diverse functions for the semaphorin receptor PlexinD1 in development and disease. Dev Biol. 2011;349:1–19. doi: 10.1016/j.ydbio.2010.09.008. [DOI] [PMC free article] [PubMed] [Google Scholar]
- 25.Chauvet S, et al. Gating of Sema3E/PlexinD1 signaling by neuropilin-1 switches axonal repulsion to attraction during brain development. Neuron. 2007;56:807–822. doi: 10.1016/j.neuron.2007.10.019. [DOI] [PMC free article] [PubMed] [Google Scholar]
- 26.Siebold C, Jones EY. Structural insights into semaphorins and their receptors. Semin Cell Dev Biol. 2013;24:139–145. doi: 10.1016/j.semcdb.2012.11.003. [DOI] [PubMed] [Google Scholar]
- 27.Suzuki K, et al. Structure of the Plexin Ectodomain Bound by Semaphorin-Mimicking Antibodies. PloS one. 2016;11:e0156719. doi: 10.1371/journal.pone.0156719. [DOI] [PMC free article] [PubMed] [Google Scholar]
- 28.Osawa M, Masuda M, Kusano K-i, Fujiwara K. Evidence for a role of platelet endothelial cell adhesion molecule-1 in endothelial cell mechanosignal transduction: is it a mechanoresponsive molecule? The Journal of Cell Biology. 2002;158:773–785. doi: 10.1083/jcb.200205049. [DOI] [PMC free article] [PubMed] [Google Scholar]
- 29.Collins C, et al. Haemodynamic and extracellular matrix cues regulate the mechanical phenotype and stiffness of aortic endothelial cells. Nature communications. 2014;5:1–12. doi: 10.1038/ncomms4984. [DOI] [PMC free article] [PubMed] [Google Scholar]
- 30.Boselli F, Freund JB, Vermot J. Blood flow mechanics in cardiovascular development. Cell Mol Life Sci. 2015;72:2545–2559. doi: 10.1007/s00018-015-1885-3. [DOI] [PMC free article] [PubMed] [Google Scholar]
- 31.McCormick ME, Tzima E. Pulling on my heartstrings: mechanotransduction in cardiac development and function. Curr Opin Hematol. 2016;23:235–242. doi: 10.1097/MOH.0000000000000240. [DOI] [PMC free article] [PubMed] [Google Scholar]
- 32.Gitler AD, Lu MM, Epstein JA. PlexinD1 and semaphorin signaling are required in endothelial cells for cardiovascular development. Dev Cell. 2004;7:107–116. doi: 10.1016/j.devcel.2004.06.002. [DOI] [PubMed] [Google Scholar]
- 33.Zhang Y, et al. Tie2Cre-mediated inactivation of plexinD1 results in congenital heart, vascular and skeletal defects. Developmental biology. 2009;325:82–93. doi: 10.1016/j.ydbio.2008.09.031. [DOI] [PMC free article] [PubMed] [Google Scholar]
- 34.Baeyens N, et al. Syndecan 4 is required for endothelial alignment in flow and atheroprotective signaling. Proceedings of the National Academy of Sciences of the United States of America. 2014;111:17308–17313. doi: 10.1073/pnas.1413725111. [DOI] [PMC free article] [PubMed] [Google Scholar]
- 35.Sabine A, et al. Mechanotransduction, PROX1, and FOXC2 cooperate to control connexin37 and calcineurin during lymphatic-valve formation. Dev Cell. 2012;22:430–445. doi: 10.1016/j.devcel.2011.12.020. [DOI] [PubMed] [Google Scholar]
- 36.Horzum U, Ozdil B, Pesen-Okvur D. Step-by-step quantitative analysis of focal adhesions. MethodsX. 2014;1:56–59. doi: 10.1016/j.mex.2014.06.004. [DOI] [PMC free article] [PubMed] [Google Scholar]
- 37.Aricescu AR, Lu W, Jones EY. A time- and cost-efficient system for high-level protein production in mammalian cells. Acta Crystallogr D Biol Crystallogr. 2006;62:1243–1250. doi: 10.1107/S0907444906029799. [DOI] [PubMed] [Google Scholar]
- 38.Tang G, et al. EMAN2: an extensible image processing suite for electron microscopy. J Struct Biol. 2007;157:38–46. doi: 10.1016/j.jsb.2006.05.009. [DOI] [PubMed] [Google Scholar]
Associated Data
This section collects any data citations, data availability statements, or supplementary materials included in this article.


