Abstract
Testosterone supplementation is commonly used for its effects on sexual function, bone health and body composition, yet its effects on disease outcomes are unknown. To better understand this, we identified genetic determinants of testosterone levels and related sex hormone traits in 425,097 UK Biobank study participants. Using 2,571 genome-wide significant associations, we demonstrate the genetic determinants of testosterone levels are substantially different between sexes, and that genetically higher testosterone is harmful for metabolic diseases in women but beneficial in men. For example, a genetically determined 1-standard deviation higher testosterone increases the risks of Type 2 diabetes (T2D) (OR=1.37 [1.22–1.53]) and polycystic ovary syndrome (OR=1.51 [1.33–1.72]) in women, but reduces T2D risk in men (OR=0.86 [0.76–0.98]). We also show adverse effects of higher testosterone on breast and endometrial cancers in women, and prostate cancer in men. Our findings provide insights into the disease impacts of testosterone and highlight the importance of sex-specific genetic analyses.
Introduction
The role of testosterone in disease is largely unknown, despite its strong epidemiological correlations with many health conditions and the widespread use of testosterone supplements. Previous studies have shown protective effects of testosterone on T2D and related metabolic traits in men, but harmful effects in women1,2. However, such phenotypic observations are prone to confounding due to the substantial effects of ageing and adiposity on circulating testosterone concentrations3.
More than 3% of US men aged 30 years or older received a prescription for testosterone in 2013, just prior to a US Food and Drug Administration safety communication on its possible cardiovascular risks4, and rates of prescribing are even higher in Canada5. Testosterone therapy has established positive effects in randomised controlled trials on sexual function, lean mass, muscle strength and bone mineral density, and reductions in whole body and intra-abdominal fat6. These body composition changes should predict benefits of testosterone on T2D and cardio-metabolic disease. Conversely, testosterone is known to promote growth and metastasis of prostate cancers and observational studies have shown that testosterone replacement therapy might increase susceptibility to future prostate cancer7–9. However, even the largest trials of testosterone have too few cases of incident T2D, cardio-vascular disease (CVD) or prostate cancer to provide informative data on these risks10. Furthermore, experimental studies of testosterone therapy in men, with or without T2D, surprisingly report no or modest improvements in insulin sensitivity and no change in glycaemic control11,12. Similarly, in women, experimental evidence of testosterone administration is insufficient to confirm the apparently metabolically harmful associations in observational studies between testosterone and higher adiposity, risk of polycystic ovary syndrome (PCOS) and other CVD risk markers13,14.
Mendelian randomisation is a genetic approach to understand the causal effects of putative risk factors on disease. Given alleles are both randomly assigned and fixed at conception, genetic risk can be used as an epidemiological exposure to reduce the effects of confounding and reverse causality. Previous studies have used this approach to test the role of sex hormones in disease, but were largely limited to cis variants in the sex-hormone binding globulin (SHBG) protein-coding gene. Such studies reported that SHBG-raising alleles were associated with lower risk of T2D, but did not test effects separately in men and women15,16. Furthermore, because higher SHBG reduces levels of bioavailable testosterone, separation of the apparent effects of testosterone from those of SHBG on disease is a major challenge.
To identify additional genetic variants that can be used to test the effects of testosterone, large genome wide association studies (GWAS) are needed. Previous GWAS for sex hormone levels in men and women were small17–20, identifying only a handful of associated loci. This study substantially advances our understanding of the genetic regulation of sex hormone levels, increasing the number of known genetic determinants by two orders of magnitude. We use these genetic variants to demonstrate likely causal associations with metabolic disease and cancer outcomes, with many divergent effects of testosterone between men and women.
Results
After extensive quality control (Methods), serum levels of SHBG, total testosterone and estradiol were available in up to 425,097 individuals with genetic data in UK Biobank (UKBB) (Table S1). We additionally estimated bioavailable (free/unbound) testosterone in 382,988 individuals (Methods). Genetic association testing was performed in European ancestry individuals and within each sex for the four traits, using a linear mixed model to control for relatedness and population structure. We identified a heritable component for all traits except estradiol levels in women (h2g=1.6% (s.e 1%) (Table 1). As the majority (78%) of women had estradiol levels below the limit of detection (as expected, given most women in UKBB are post-menopausal), analysis of this trait was limited by low sample numbers and a bias towards detecting age at menopause-associated loci. Therefore, assessment of estradiol levels in women was not considered further.
Table 1. Heritability of and genetic correlations between sex hormone traits included in the genome-wide association analyses.
| Heritability (%), s.e | SHBG (Women) | Testosterone (Women) | Bioavailable T (Women) | Estradiol (Women) | SHBG (Men) | Testosterone (Men) | Bioavailable T (Men) | Estradiol (Men) | |
|---|---|---|---|---|---|---|---|---|---|
| SHBG (Men) | 21 (1.2) | 0.83 | -0.02 | -0.59 | 0.29 | - | |||
| Testosterone (Men) | 17 (1) | 0.69 | 0.001 | -0.49 | 0.40 | 0.73 | - | ||
| Bioavailable T (Men) | 12 (0.7) | 0.06 | 0.01 | -0.03 | 0.21 | -0.05 | 0.60 | - | |
| Estradiol (Men) | 2 (0.4) | 0.04 | 0.24 | 0.10 | 0.07 | 0.19 | 0.32 | 0.19 | - |
| SHBG (Women) | 20 (0.01) | - | |||||||
| Testosterone (Women) | 13 (0.8) | -0.06 | - | ||||||
| Bioavailable T (Women) | 14 (0.8) | -0.74 | 0.65 | - | |||||
| Estradiol (Women) | 1.6 (1) | 0.45 | -0.25 | -0.51 | - | ||||
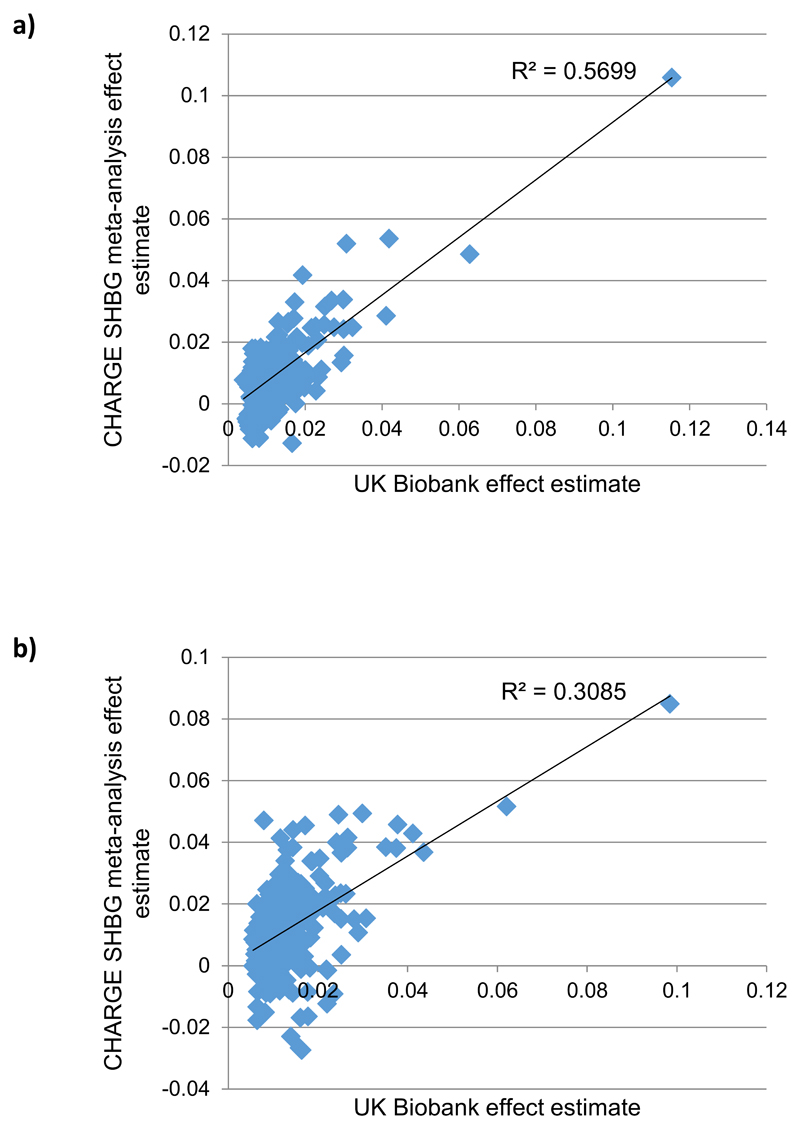
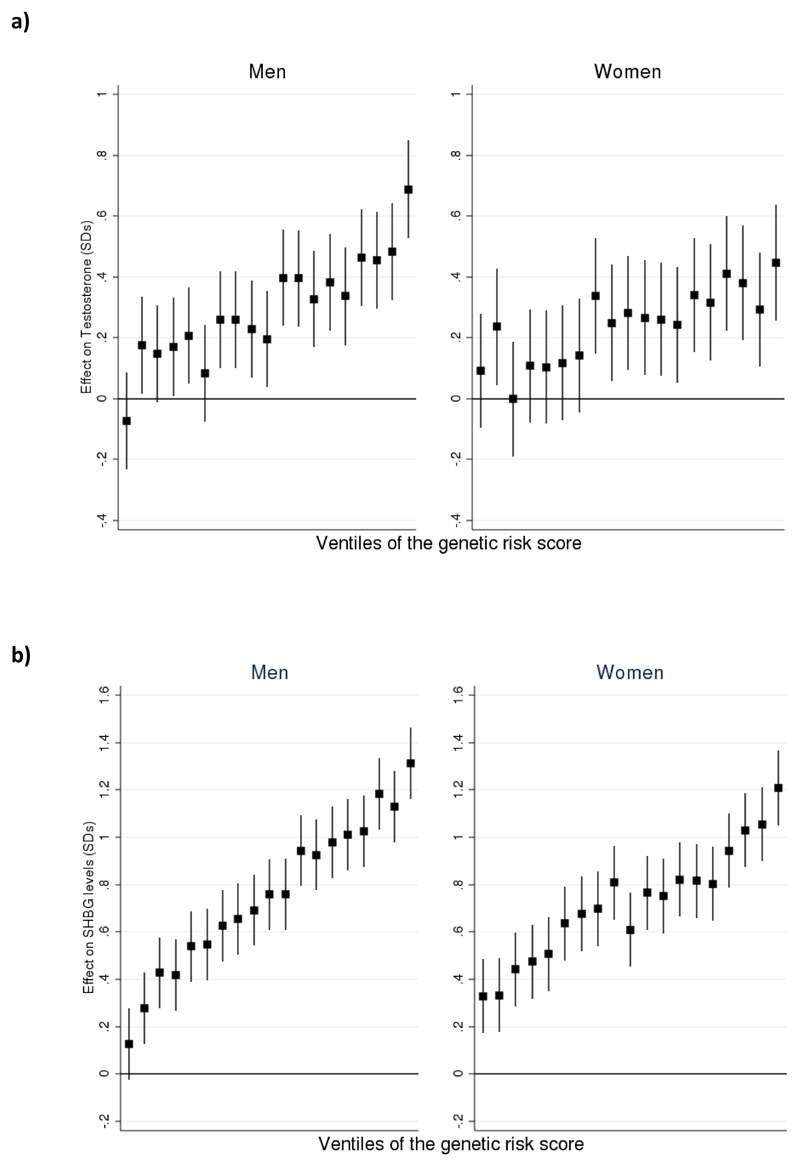
To identify independent genetic determinants for sex hormone measures, we next performed distance-based clumping and approximate conditional analysis (Methods). In total, we identified 2,571 genome-wide significant trait-signal pairs (Tables S2-S11). These trait-signal pairs ranged from 22 signals for estradiol in men, to 658 for SHBG in a sex-combined analysis. To validate these findings, we performed replication using three available datasets (Methods) - a previously published GWAS meta-analysis of SHBG levels in 21,791 individuals19, 9,138 individuals with testosterone measurements from the EPIC-Norfolk study and published data on 2,913 individuals from the Twins UK study with nine sex hormones measured20. Whilst these studies were substantially smaller than UK Biobank, we found strong directional consistency with our results. Assessment of our SHBG-associated loci in the published meta-analysis (Figure ED1) demonstrated 236/278 (85%, binomial P=6.1x10⁻³⁴) of the captured male SHBG signals had consistent direction of effect (77 with P<0.05), compared to 241/283 in women (85%, binomial P=4.2x10⁻³⁵, 60 at P<0.05). In Twins UK, all identified genome-wide significant variants in aggregate were significantly associated and directionally concordant for the respective sex hormone traits (Table S12). Finally, in the EPIC-Norfolk study we estimated the magnitude of effect a genetic risk score for SHBG and testosterone had on the respective trait levels (Figure ED2). Men with the 5% highest genetic risk have 0.69 [0.53-0.85 95%CI] and 1.27 [1.12-1.41] standard deviation (equivalent to 2.55 nmol/L and 21.34 nmol/L) higher total testosterone and SHBG respectively than men with the 5% lowest scores; the equivalent difference in women is 0.45 [0.26-0.64] SDs (0.28 nmol/L) and 1.29 [1.12-1.45] (35.91 nmol/L) respectively.
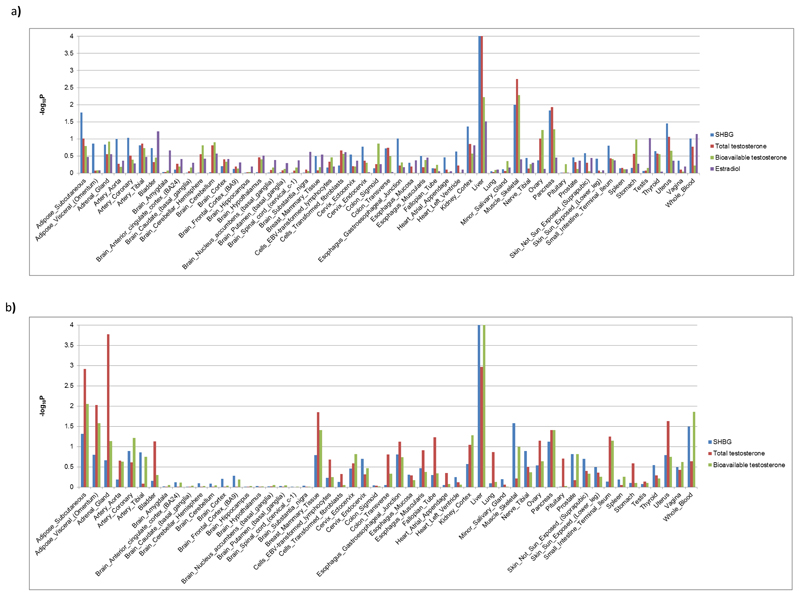
To putatively map each identified variant to its effector gene, we first identified any non-synonymous variant highly correlated (r2>0.7) with a lead index variant. This implicated one or more genes at 482/2571 (19%) SNP-trait pairs, highlighting 291 unique genes (Tables S2-S11). To identify the likely tissue(s) and cell type(s) of action for sex hormone-associated loci, we integrated our data with gene expression data across 53 tissues available from the GTeX consortium using LD score regression (Methods). In both sexes, liver was the most enriched tissue (Figure ED3), consistent with its established role as the site of SHBG production. Skeletal muscle in men and adrenal gland in women were the next strongest enriched tissues. In contrast to findings for other reproductive traits, we found no evidence for enrichment of gene expression in any brain cell type (Figure ED3). Within the three prioritised tissue types (liver, skeletal muscle and adrenal gland), we identified 161 unique eQTL-linked genes mapping within 300kb to 200/2571 SNP-trait pairs (Methods, Tables S2-S11). We note that further evidence from experimental studies is needed to confirm our putative genes, but the current findings should help to guide such work.
Distinct genetic architectures of testosterone regulation between sexes
Despite similar heritability estimates (Table 1), the genetic component to variation in circulating testosterone levels was very different between sexes, as indicated by null genome-wide correlations between sexes (Table 1) and limited overlap of genome-wide significant signals between sexes (Tables S13-14). This discordance was partly due to opposing effects between sexes at several individual loci, rather than solely null associations in one sex. For example, of the 254 signals for total testosterone in women, 72 were also at least nominally associated (P<0.05) with total testosterone in men; however, of these, 33 (46%) showed directionally-opposing effects between sexes (Table S7). Notably, several variants had genome-wide significant but directionally-opposing effects on testosterone in men and women (Table S5), including the missense variants: rs56196860 in FKBP4 which encodes a regulator of androgen receptor transactivation activity21; and rs28929474 in SERPINA1 which encodes one of a family of proteins which are reported to regulate steroidogenesis in testicular Leydig cells22.
Several other signals showed sex-specific effects (Table S5). Notably, 7 of 9 X-chromosome signals for total testosterone in men and women combined altered levels only in men, including five variants located in/near genes associated with androgen insensitivity (AR), hypogonadotropic hypogonadism (ANOS1), failure of sex steroid 11 beta-hydroxylation (HPRT1), disrupted steroidogenesis (STARD8), and hypospadias (DGKK) (Table S5). Notable autosomal male-specific testosterone signals were located at key regulators of puberty timing (e.g. LIN28B-rs7759938; TACR3-rs528845403 and KISS1-rs201416723) and androgen secretion (NR0B2-rs182050989 or biosynthesis (SRD5A2-rs113017476) (Table S5).
Among many signals with apparent female-specific effects on testosterone were five signals in/near to genes encoding enzymes in the cytochrome P450 family with reported roles in testosterone hydroxylation (CYP3A7-rs45446698, CYP2D6-rs5751229, CYP2C8/CYP2C9-rs11572082, CYP11B2-rs6471583 and POR-rs17853284) (Table S5). Other signals with female-specific effects on testosterone included: reported PCOS susceptibility loci at FSHB (rs12294104) and THADA (rs58839393); CYP17A1 (rs11441374) encoding 17,20-lyase, the decisive step in androgen synthesis, and its critical cofactor CYB5A-rs17089026/rs79384925); and also near genes encoding luteinizing hormone subunit beta (LHB-rs78248023) and hormone receptors for glucocorticoids (NR3C1-rs34632394) and prolactin (PRLR-rs112694713) (Table S5).
In contrast to testosterone traits, the genetic architecture of SHBG levels was highly concordant between men and women (rg 0.84 [0.81-0.87], P<1x10-100) (Table 1); 315 (88%) of the 359 genome-wide significant variants in women were also at least nominally associated (P<0.05) with SHBG in men (Table S4).
Genetic overlap between sex hormone traits within sexes
Among men, we found partially overlapping genetic determinants between the different sex hormone traits. This was reflected by positive genetic correlations between all four sex hormone measures (Table 1, rg 0.19-0.73), with the exception of a weak negative correlation between SHBG and bioavailable testosterone (rg -0.048 (SE 0.024), P=0.04). These genetic correlations were very similar to the observed phenotypic correlations (Table S15). In contrast to men, among women, there was a weak negative genetic correlation between total testosterone and SHBG (rg= -0.06 in women; 0.73 in men), a strong negative correlation between bioavailable testosterone and SHBG (-0.74 in women; -0.05 in men) and a similar positive correlation between total and bioavailable testosterone (0.65 in women; 0.60 in men), again closely reflecting the observed phenotypic correlations (Table 1, Table S15).
Cluster analysis identifies loci with primary SHBG or testosterone effects
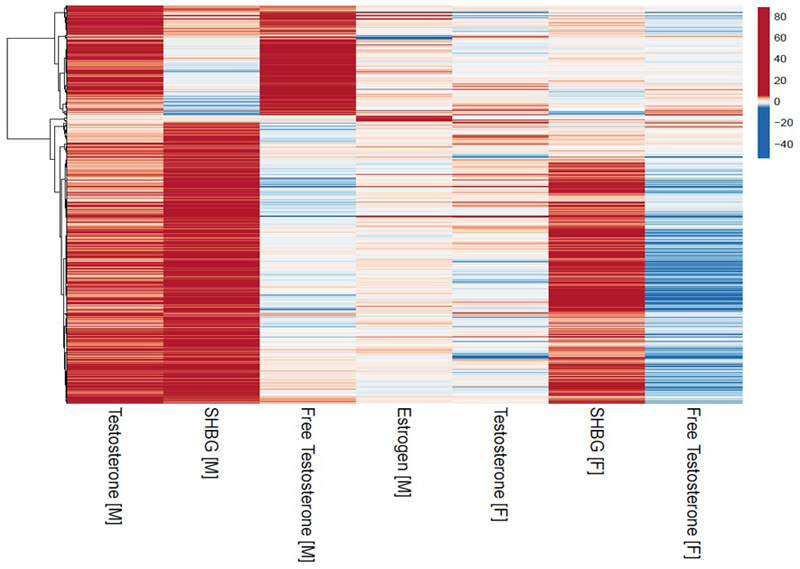
Testosterone levels are dependent on SHBG levels but genetic variants may allow us to separate distinct components of variation in sex hormone levels. To identify signals with primary effects on individual sex hormone traits, we performed a cluster analysis of all 525 signals that reached genome-wide significance for one or more sex hormone measure in men, identifying 3 clusters (Figure 1, Table S16). The largest cluster (362 signals) was characterised by loci with relatively strong positive associations with SHBG; in combination, SNPs in this cluster also increased total testosterone, reduced bioavailable testosterone and increased estradiol in men (Table S17). Hence, this cluster (termed “male SHBG cluster”, Methods) represents a genetic instrument with primary SHBG-increasing effects, and secondary divergent effects on total (higher) and bioavailable testosterone (lower) that are consistent with the known hormone-regulatory role of SHBG.
Figure 1.
Cluster analysis of male identified sex hormone signals. All Z-score effects are aligned to the male total testosterone increasing allele.
Among men, the second identified cluster (122 loci) was consistently associated with higher total and bioavailable testosterone levels in a dose-response manner. In combination, SNPs in this cluster also increased estradiol levels, but had no effect on SHBG (P=0.66) (Table S17). Hence, this cluster (termed “male specific testosterone cluster”) represents a genetic instrument with primary (total and bioavailable) testosterone-increasing effects, with secondary estradiol-increasing effects (consistent with the physiological conversion of androgens to estrogens), but independent of SHBG.
Among men, a third small cluster (14 signals) strongly increased estradiol, but not other sex hormone measures (Table S17). The most prominent signal in this cluster (rs781858752) was uniquely associated with estradiol in men (P=7.6x10⁻¹⁵) but not with any other sex hormone measure in men or women (all P>0.05), and influenced expression of IGHV3-9 and IGHV1-8 in the liver (Table S11).
In addition to separating testosterone from SHBG effects, defining such clusters is an important step for downstream analyses to minimise the pleiotropic effects of SNPs that may have much stronger effects on other sex hormones. For example, the apparent strong male estradiol association (P=1.5x10⁻³⁵) at the X-chromosome rs111386834 locus, ~200kb from KAL1, is clearly secondary to a stronger effect of this signal on bioavailable (P=3x10-670) and total testosterone (P=1.5x10-372), consistent with the known role of this gene on the hypothalamic-pituitary reproductive axis.
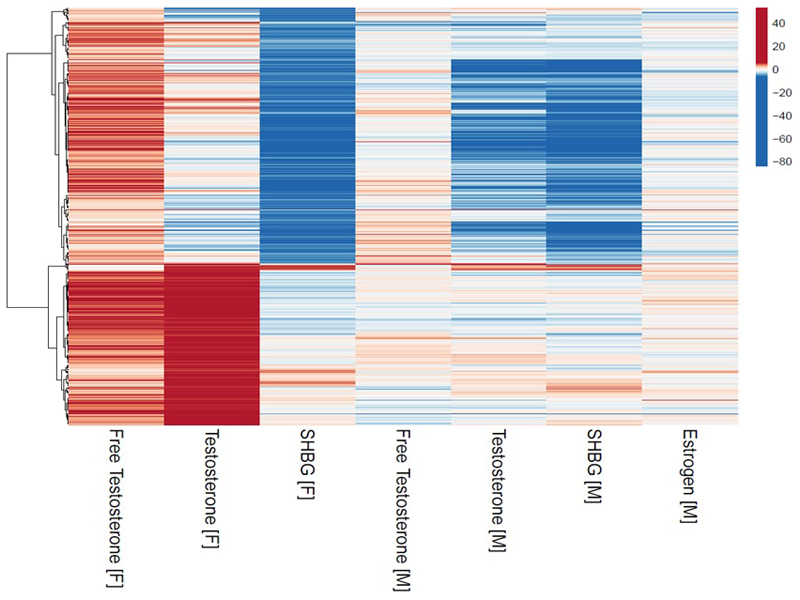
As in men, in women, cluster analysis of all 614 signals for any of the three sex hormone measures in women (Figure 2) identified two main clusters, representing genetic instruments with i) primary SHBG effects and secondary directionally-opposing effects on total and bioavailable testosterone (“female SHBG cluster”, 373 signals) and ii) consistent testosterone effects but no aggregate effect on SHBG (“female specific testosterone cluster”, 241 signals) (Table S18). Hence, in both men and women, cluster analyses resulted in genetic instruments that allowed us to test specific testosterone-increasing effects, independent of SHBG.
Figure 2.
Cluster analysis of female identified sex hormone signals. All Z-score effects are aligned to the female bioavailable testosterone increasing allele.
Understanding the impact of sex hormone measures on disease outcomes
Having identified over 2500 associations between genetic variants and sex hormone measures, we designed a set of Mendelian randomization (MR) analyses (Methods) to inform the causal effects of sex hormones on two broad categories of disease outcomes – a) Type 2 diabetes (T2D), insulin resistance, body composition and related metabolic disease risk factors, and b) hormone sensitive cancers. Given the lack of overlap between men and women in sex hormone associated variants (Table 1, Tables S13-14), and the possible different metabolic effects of these hormones between sexes, we focused analyses on sex-specific disease outcomes. As exposures, we tested total and bioavailable testosterone and SHBG in both men and women, and also estradiol in men. For each outcome trait, we identified the largest published sex-specific GWAS meta-analysis with publicly available data (Table S19). We then performed a series of MR analyses using two-sample inverse variance-weighted (IVW), Egger and weighted median models (Methods). We additionally modelled different genetic risk scores by i) Steiger filtering to exclude variants with larger effects on metabolic traits than the tested sex hormone, ii) cluster filtering using variants in the above defined clusters representing primary effects on SHBG or testosterone independent of SHBG. To further inform the role of SHBG, we additionally tested the 2 cis variants in SHBG as an instrument for SHBG.
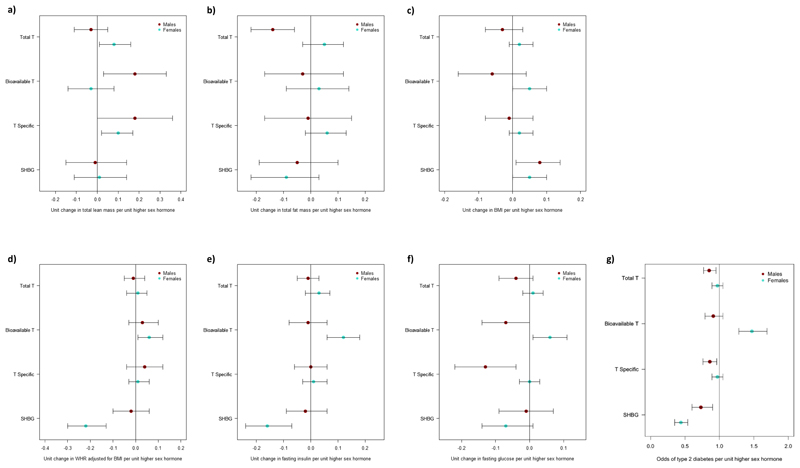
Using these genetic instruments, in men and women separately, we could infer causal positive effects of testosterone levels on lean body mass and number of lifetime sexual partners (Tables S20-S22, Figure ED4). These findings are consistent with the established positive effects of testosterone on these traits in randomised controlled trials6 and therefore support the validity of our genetic instrument analyses.
Mendelian randomization analyses in men
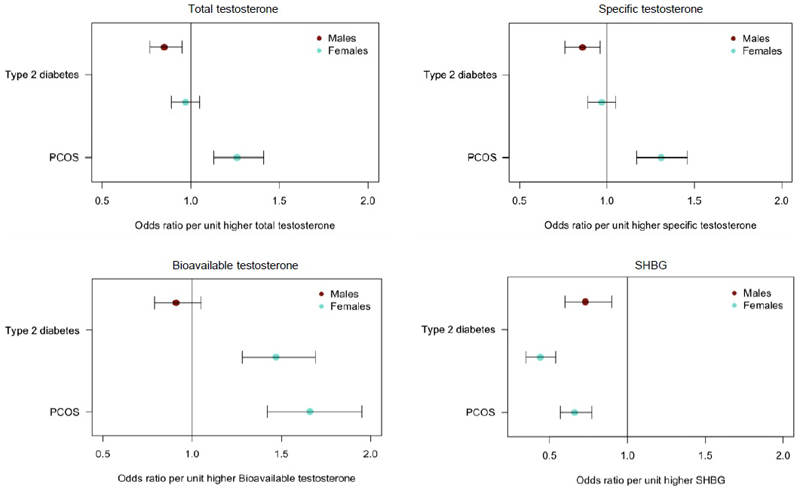
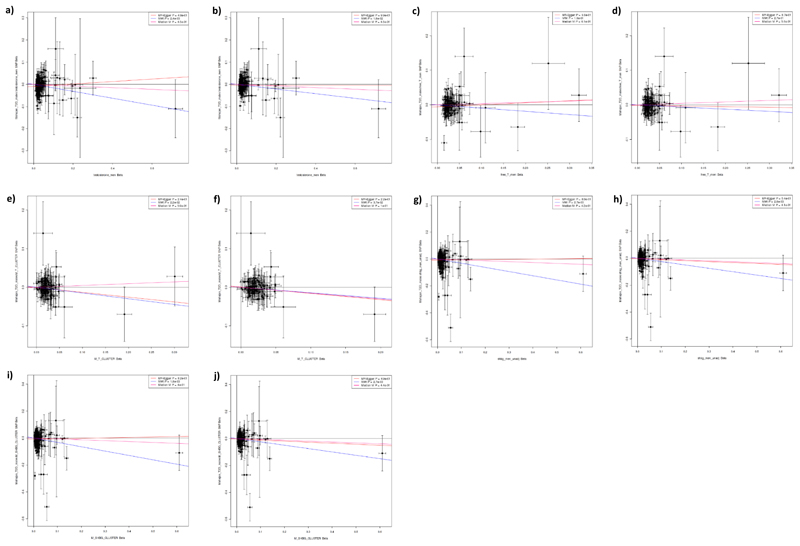
In men, we found evidence of beneficial effects of higher testosterone on metabolic traits (Figure 3, Figure ED4-5, Tables S20 and S23). For T2D and related traits, the evidence of a protective effect of testosterone was most consistent when using the cluster-specific genetic instrument representing a primary (total and bioavailable) testosterone-increasing effect independent of SHBG. Using data from 34,990 men with T2D and 150,760 male controls23, and 67,506 non diabetic men with fasting glucose levels available24, exposure to higher testosterone, independent of SHBG, conferred lower T2D risk and lower fasting glucose: each 1-SD higher testosterone level (approximately 3.7 nmol/L) was associated with a 15% lower T2D risk in men (total testosterone odds ratio (OR): 0.85; 95% CI: 0.77, 0.95; cluster-specific testosterone OR: 0.86; 95% CI 0.76,0.98). These metabolically beneficial associations were directionally consistent, but did not reach nominal significance (p<0.05), in all sensitivity analyses (Tables S20, S24; Figure ED5).
Figure 3.
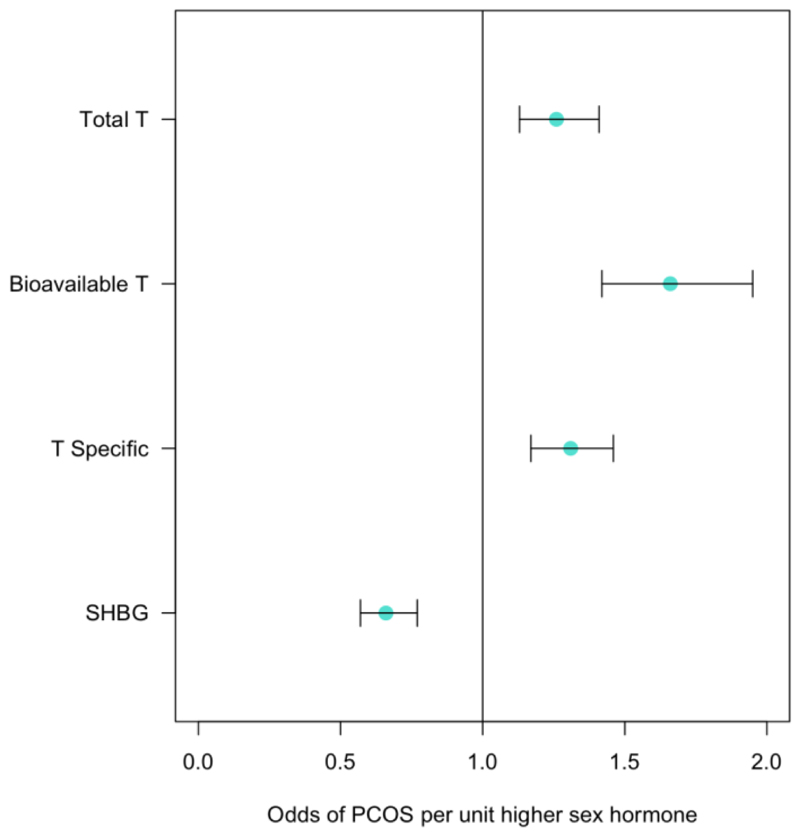
Plots showing the odds of T2D and PCOS per unit higher testosterone and SHBG using genetic instruments in Mendelian Randomization analyses. Unit measurements for the individually transformed exposure traits can be found in Table S1. Specific testosterone refers to a total testosterone score which has no aggregate effect on SHBG. Bars indicate 95% confidence interval around the point estimates from inverse-variance weighted analyses. Analyses are based on association statistics generated in a maximum of: total and specific testosterone, n=194,453 men and n=230,454 women; bioavailable testosterone, n=178,782 men and n=188,507 women; SHBG, n=180,726 men and n=189,473 women; T2D, n=34,990 cases and n=150,760 controls in men and n=17,790 cases and n=243,645 controls in women; PCOS, n=10,074 cases and n=103,164 controls. Numbers of genetic variants included in the analyses are given in Tables S20 and S21.
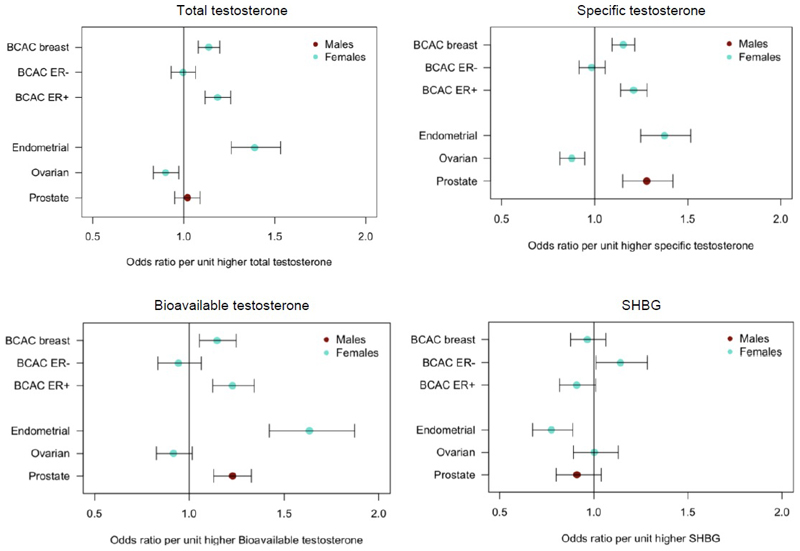
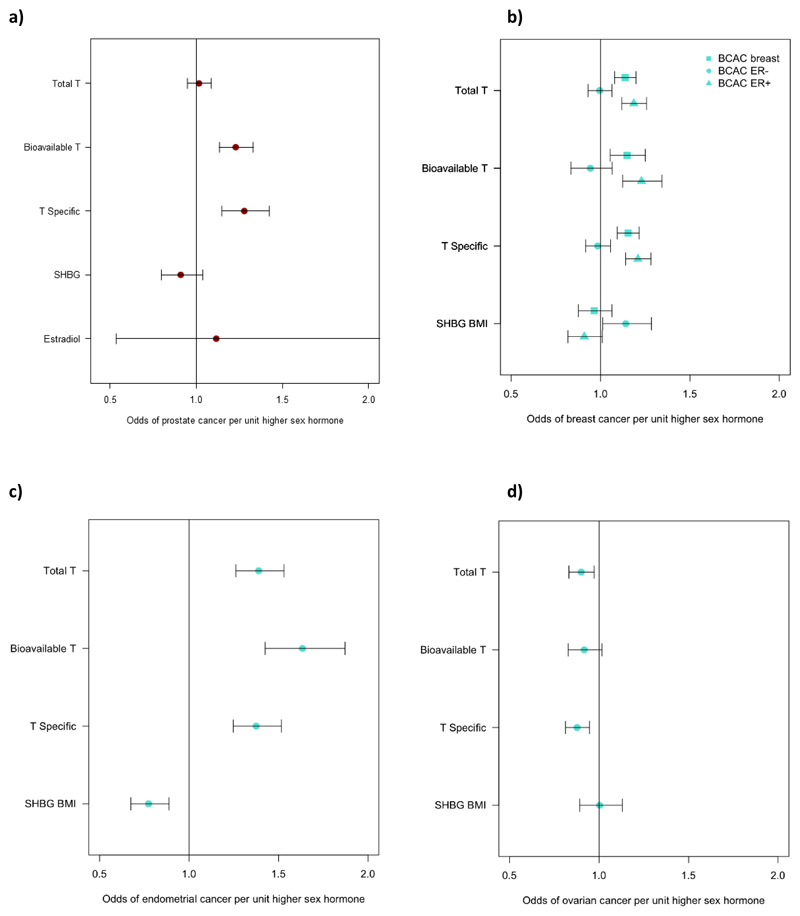
In contrast to these apparent beneficial metabolic effects, MR analyses indicated that testosterone increases prostate cancer risk in men: each 1-SD higher bioavailable testosterone level increased prostate cancer risk by 23% (OR: 1.23; 95%CI 1.13-1.33), with consistent findings across all testosterone genetic instruments (unfiltered, Steiger-filtered and cluster-filtered) (Figure 4, Table S25, Figure ED6).
Figure 4.
Plot showing the odds of cancer per unit higher testosterone and SHBG using genetic instruments in Mendelian Randomization analyses. Unit measurements for the individually transformed exposure traits can be found in Table S1. Specific testosterone refers to a total testosterone score which has no aggregate effect on SHBG. Bars indicate 95% confidence interval around the point estimates from inverse-variance weighted analyses. Analyses are based on association statistics generated in a maximum of: total and specific testosterone, n=194,453 men and n=230,454 women; bioavailable testosterone, n=178,782 men and n=188,507 women; SHBG, n=180,726 men and n=189,473 women; breast cancer, n=105,974 cases and n=122,977 controls; ER negative subtype breast cancer, n=21,468 cases and n=100,594 controls; ER positive subtype breast cancer, n=69,501 cases and n=95,039 controls; endometrial cancer, n=12,270 cases and n=46,126 controls; ovarian cancer, n=25,509 cases and n=40,941 controls; prostate cancer, 67,158 cases and 48,350 controls. Numbers of genetic variants included in the analyses are given in Tables S25 and S27.
We found no compelling evidence for an effect of estradiol in men on any metabolic or body composition trait, however, confidence intervals were wide (Tables S20, S23 and S25).
Mendelian randomization analyses in women
Despite evidence for a positive effect of total testosterone on lean body mass in women as well as men, testosterone was associated with several adverse metabolic outcomes in women (Table S21).
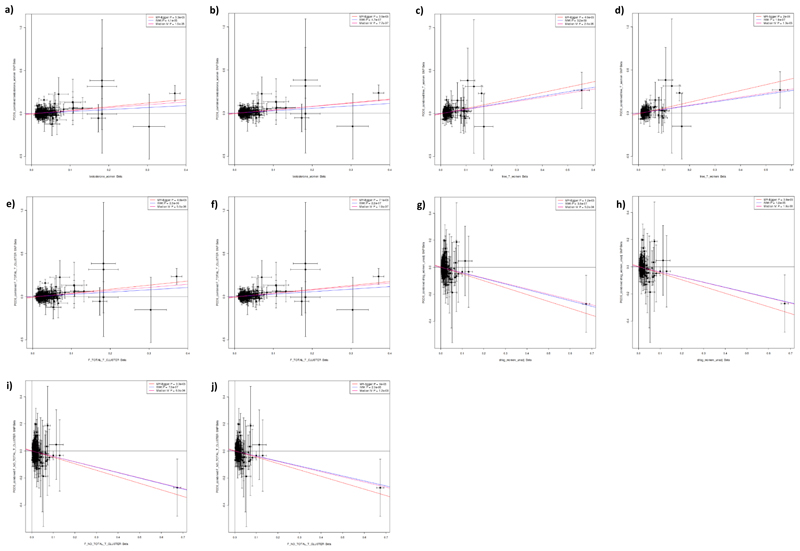
We found consistent evidence supporting a causal effect of testosterone on higher PCOS risk in women. These effects were most evident with bioavailable testosterone, with positive findings across all MR models and all instruments (unfiltered, Steiger-filtered and cluster-filtered) (Figure ED7-8, Table S21). These effects equated to an odds ratio of 1.51 (95%CI 1.33-1.72) per 1-SD higher bioavailable testosterone.
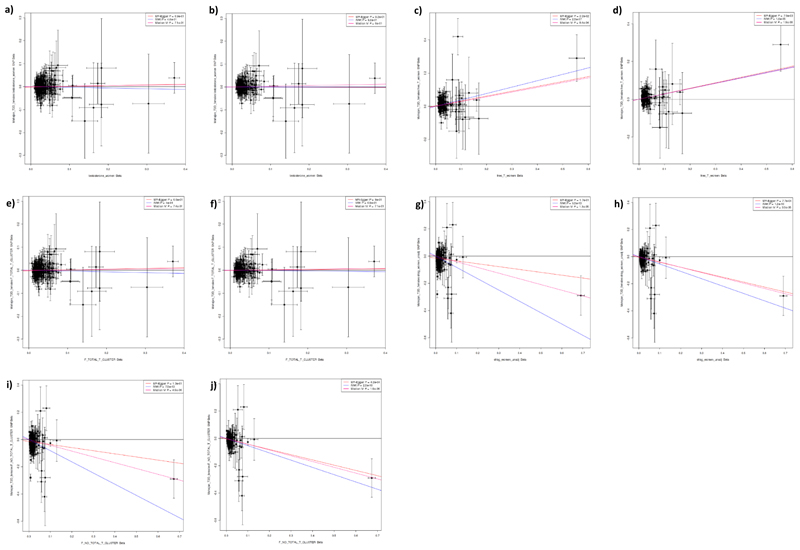
MR analyses also showed a causal effect of bioavailable testosterone on higher T2D risk and higher fasting insulin in women (using unfiltered and Steiger-filtered instruments) (Table S21, Figures ED4 and ED9). Risk of T2D was increased by 37% (OR: 1.37; 95% CI 1.22, 1.53) per 1-SD higher bioavailable testosterone. We also found evidence for protective effects of SHBG on T2D across all MR models using Steiger-filtered and cluster-filtered instruments, and apparent protective effects of SHBG on fasting insulin levels, and central fat measures, android and visceral, but not total body fat, (consistently across unfiltered, Steiger-filtered and cluster-filtered instruments) (Tables S21 and S26, Figures ED4 and ED9). These effects equated to an odds ratio for T2D of 0.65 (95%CI: 0.58-0.72) per 1-SD (approximately 30.3 nmol/L) higher SHBG. The lack of association with the testosterone-specific cluster (representing higher testosterone independent of SHBG) on T2D or fasting insulin (Table S21), indicates that the above associations with bioavailable testosterone and SHBG in women might be driven by direct effects of SHBG, however, we did not have a genetic instrument that was specific to SHBG.
We found evidence that testosterone increased the risk of estrogen receptor (ER)+ but not ER-breast cancer, with consistent findings across all MR models and instruments (Figure ED6, Table S27). Furthermore, testosterone increased the risk of endometrial cancer but reduced the risk of ovarian cancer, again with consistent findings across sensitivity models (Figure ED6, Table S27). There was also evidence for a protective effect of SHBG on risk of endometrial cancer in women, which was consistent across all models, but a risk-increasing effect of SHBG on ER-breast cancer.
cis variants in the SHBG gene provide a confirmatory test of higher circulating SHBG levels, independent of potential confounding by adiposity and insulin resistance, but including effects of reciprocally lower bioavailable testosterone. Results using two cis variants were generally consistent with our main analyses (Table S24), with consistent associations with the low frequency missense SHBG variant on PCOS and T2D in women, and directionally-consistent but smaller effects of the common non-coding variant.
Discussion
We identify >2500 genetic variant sex-hormone associations and provide insights into the genetic architecture of sex hormone regulation and its relevance to disease. We see limited overlap between the genetic variants identified in men and women for all sex hormone traits except SHBG, and even overlapping signals often showed divergent effects. Cluster analyses across all identified variants distinguished, in each sex, groups of variants with testosterone-increasing effects either dependent or independent of SHBG. These clusters helped inform genetic causal inference analyses by showing primary metabolic effects of testosterone that were beneficial in men (lower fasting glucose and lower T2D risk) but harmful in women (higher PCOS risk). In contrast, associations that are seen only with bioavailable testosterone and SHBG (e.g. T2D in women) could be driven by effects of SHBG, directly or in combination with testosterone.
Testosterone Trials in men, the largest RCTs of testosterone administration to date, found clear benefits of testosterone on sexual function and body composition in men, but insufficient data on disease outcomes due to sparse numbers of such outcomes even in the largest trials. While RCT evidence remains the gold standard, genetic instrumental variable analyses provide a more robust evidence base than phenotypic observational study designs, as they are less prone to confounding and reverse causality. For example, while adverse effects of testosterone on prostate cancer risk might be expected, given the established role of testosterone-reducing agents in the treatment of prostate cancer, the evidence from observational studies is remarkably diverse: out of 45 papers, 18 reported positive associations between testosterone and prostate cancer, 17 reported negative associations and 10 reported no association8. Furthermore, in a recent analysis of 20 prospective studies, low bioavailable testosterone predicted lower risk of low-grade prostate cancers but higher risk of high-grade cancers9. Therefore, our findings advance our understanding of the risks and benefits of this widely used therapy in men.
Our findings that higher testosterone increases the risk of PCOS in women is important in demonstrating the aetiological role of testosterone in this common disorder, rather than simply being a consequence of upstream defects in ovarian dysfunction and insulin signalling. Androgen-blocking agents are widely used to treat symptoms of hyperandrogenism in women with PCOS, but evidence is lacking for the role of androgens in the aetiology and prevention of this condition25. Similarly, experimental evidence of the effects of testosterone administration in women arises from several RCTs, albeit using substantially lower doses than in men and often topical routes of administration, which substantiate the positive effects of testosterone on the primary outcome, sexual function. However, even in combination, these RCTs include insufficient disease events to inform about its potential effects on cardio-metabolic traits and cancer risks26.
Our findings positively link testosterone to number of sexual partners and lean body mass in men and women, which provide reassurance about the validity of our approach. However, some limitations need to be acknowledged. While we could distinguish a cluster-specific genetic instrument for testosterone that was independent of SHBG, the effects of this, and our other testosterone instruments, might be mediated at least in part by downstream conversion of testosterone to estradiol. This has been hypothesized to explain the observed phenotypic associations between testosterone and higher risk of ER-positive breast cancer. However, regardless of downstream mechanisms, our findings provide evidence to inform the consequences of real-world differences in testosterone on health outcomes. Similarly, while our SHBG-related clusters in men and women were not independent of testosterone, and therefore cannot inform the debate about SHBG-specific metabolic effects, they reflect the actual downstream biological effects of SHBG on (higher) total testosterone and (lower) bioavailable testosterone. A second limitation, common to all MR analyses, is that genetic instruments represent lifelong exposures to the risk factor, and so may have different effects to short-medium term pharmacological interventions even if they achieve the same difference in circulating concentrations. A third limitation is that the discovery of genetic variants was performed in a single large study that is known to be enriched for healthier and older individuals, potentially influencing (likely underestimating) the effect size of associated variants. Finally, the MR approach depends on some key assumptions which we attempted to assess using a range of sensitivity analyses. Associations across these sensitivity analyses were generally directionally consistent, but did not always reach p<0.05. We note that our findings do not preclude an additional bi-directional effect of disease status on testosterone or suggest that other factors are not important causal determinants of the tested outcomes.
Our study highlights three important methodological considerations. First, in light of the substantial overlap between genetic determinants of testosterone and SHBG within each sex, our cluster-based analyses allowed us to identify subsets of variants that alter testosterone independent of SHBG. This effectively removes potential direct biological effects of SHBG and its confounding effects on adiposity and insulin resistance27. Second, we used Steiger filtering of our genetic instruments, to exclude variants with stronger effects on metabolic traits compared to their effects on sex hormones. This approach helped reduce the possibility of reverse causality, an issue that is increasingly important in large-scale GWAS28.
Finally, our findings show the importance of sex-specific analyses, both in the discovery of genetic variants for sex hormone traits and in the analyses of downstream traits. The apparently sex-divergent effects of testosterone on T2D were obfuscated by sex-combined data. Available large-scale sex-specific data on T2D was invaluable for our study - unfortunately similar sex-specific data for cardiovascular disease are not yet available, which will be critically important to understand the wider cardio-metabolic impact of testosterone. Hence, while the findings relating to adverse metabolic effects of testosterone in women may inform clinical practice, it is premature to infer wider beneficial metabolic effects in men.
In conclusion, our findings provide unique insights into the disease impacts of testosterone and highlight the importance of sex-specific analyses of disease risk.
Methods
Phenotype preparation in UK Biobank
Discovery analyses were performed in the full UK Biobank study which has been described extensively elsewhere29. All UK Biobank participants provided written informed consent, the study was approved by the National Research Ethics Service Committee North West–Haydock and all study procedures were performed in accordance with the World Medical Association Declaration of Helsinki ethical principles for medical research. At baseline a panel of 34 biomarkers were measured across the full ~500,000 study participants. We selected three sex hormone traits - SHBG, testosterone and estradiol - and additionally calculated a measure of bioavailable testosterone using the Vermeulen equation30,31. Individual trait transformations and exclusion criteria are detailed in Supplementary Table S1.
Genetic discovery analysis
We used genetic data from the “v3” release of UK Biobank29, containing the full set of HRC and 1000G imputed variants. In addition to the quality control metrics performed centrally by UK Biobank, we defined a subset of “white European” ancestry samples using a K-means clustering approach applied to the first four principal components calculated from genome-wide SNP genotypes. Individuals clustered into this group who self-identified by questionnaire as being of an ancestry other than white European were excluded. After application of QC criteria, a maximum of 425,097 UK Biobank participants were available for analysis with genotype and phenotype data. Association testing was performed using a linear mixed models implemented in BOLT-LMM32 to account for cryptic population structure and relatedness. Only autosomal genetic variants which were common (MAF>1%), passed QC in all 106 batches and were present on both genotyping arrays were included in the genetic relationship matrix (GRM).
Across each of the four sex hormone traits we performed GWAS discovery analyses both within and across sexes, with the exception of estradiol where analyses were performed only in men. To help improve reproducibility of results, analyses were conducted independently at two sites and compared for consistency, with any discrepancies investigated. A decision on which dataset to use for each discovery GWAS was made based on strength of association of the previously reported SHBG gene locus variants19.
Genotyping chip, age at baseline and 10 genetically derived principal components were included as covariates in all models, in addition to specific covariates used for individual traits detailed in Supplementary Table S1. For SHBG we included body mass index as a covariate which was previously demonstrated to increase statistical power by reducing trait variance. To avoid any effects which may be attributed to collider bias33, we compared BMI adjusted estimates to BMI unadjusted estimates across all identified genome-wide significant SHBG signals. We discarded from further consideration any loci which changed effect direction between models and/or had large changes in effect estimate and statistical significance. For downstream analyses, genetic loci from the BMI adjusted analyses were used with corresponding effect estimates from the BMI unadjusted analyses.
Replication was performed using three independent datasets. Firstly, a previously published CHARGE consortium meta-analysis of SHBG (age and BMI adjusted) in 21,791 individuals (9,390 women, 12,401 men)19. Given these data used HapMap 2 imputation, we found proxy HapMap 2 variants with a minimum r2>0.5 to align (Supplementary Table S28). Secondly, a previously published GWAS of 2,913 individuals from the Twins UK resource20 with measured dehydroepiandrosterone (DHEAS), total testosterone, follicle stimulating hormone (FSH), luteinizing hormone (LH), estradiol, progesterone, prolactin and SHBG and calculated free androgen index. Finally, replication of the genetic scores was attempted with measurements of total testosterone (5,334 men and 3,804 women) and of SHBG (5,694 men and 5,476 women) from the EPIC Norfolk study34. Here, regression models were conducted on ventiles of the score, and were controlled for 10 genetic principal components, and additionally menopausal status in women (Figure ED2). Given the relatively small sizes of these replication studies, we used these data to validate genetic instruments in aggregate rather than as individual loci (Supplementary Table S28).
Signal selection and genetic instrument generation
We defined statistically independent signals (described as lead or index variants) using 1Mb distanced-based clumping across all imputed variants with P<5x10⁻⁸, an imputation quality score > 0.5 and MAF > 0.1%. Although several studies have suggested other p-value thresholds for genome-wide significance more stringent (e.g P<6x10⁻⁹) than the currently accepted community standard (P<5x10⁻⁸), as our primary focus of this paper was the production of genetic risk scores (rather than focus on individual genetic variants), we felt the more liberal threshold was acceptable to help maximise variance explained. We note that multiple trait correction would likely be over-conservative given the correlation structure between traits.
Genome-wide significant lead variants that shared any correlation with each other due to long range linkage disequilibrium (r2>0.05) were excluded from further consideration. These loci were additionally augmented using approximate conditional analyses implemented in GCTA35. Here, secondary signals were only considered if they were a) uncorrelated (r2<0.05) with a previously identified index variant b) genome-wide significant pre and post conditional analysis, c) had an effect estimate which did not change by more than 10% between models.
For downstream analyses we produced genetic instruments using two approaches. Firstly, we considered only SNPs that were genome-wide significant (and defined using clumping method above) for a given trait and sex to derive 7 genetic instruments:
-
1)
“SHBG-Men” (N=357) - Individually genome-wide significant SNPs for SHBG in men, discovered using BMI adjusted analysis but using weights from a BMI unadjusted analysis
-
2)
“SHBG-Women” (N=359) - As above, but in women.
-
3)
“Total T-Men” (N=231) - Individually genome-wide significant SNPs for total testosterone in men, weighted by individual SNP beta estimate for total testosterone
-
4)
“Total T-Women” (N=254) - As above, but in women.
-
5)
“Bioavailable T - Men” (N=125) - Individually genome-wide significant SNPs for bioavailable testosterone in men, weighted by individual SNP beta estimate for bioavailable testosterone
-
6)
“Bioavailable T - Women” (N=180) - As above, but in women
-
7)
“Estradiol-Men” (N=22) - Individually genome-wide significant SNPs for estradiol in men, weighted by individual SNP beta estimates for estradiol
Secondly, given the genetic overlap between traits, we observed that some signals were shared between sex hormone traits but appeared to have much stronger effects in one versus others. To help derive additional genetic risk scores that reflected this, we took all genome-wide significant signals within each sex but across traits, and performed ward-based hierachical clustering36 on individual variant Z-scores. We used the observed clusters from these analyses to produce give additional genetic instruments (Supplementary Table S16):
-
8)
A “Male SHBG cluster” (N=362), formed from SNPs with dominant effects on SHBG in men. Each SNP in this genetic instrument is weighted by its effect from the BMI unadjusted SHBG analysis.
-
9)
A “Male testosterone cluster” (N=122), formed from SNPs with dominant effects on both total and bioavailable testosterone in men. Each SNP in this genetic instrument is weighted by its effect on total testosterone.
-
10)
A “Male estradiol cluster” (N=14), formed from SNPs with dominant effects on estradiol in men.
-
11)
A “Female SHBG cluster” (N=373), formed from SNPs with dominant effects on SHBG in women. Each SNP in this genetic instrument is weighted by its effect from the BMI unadjusted SHBG analysis.
-
12)
A “Female testosterone cluster” (N=241), formed from SNPs with dominant effects on both total and bioavailable testosterone in women. Each SNP in this genetic instrument is weighted by its effect on total testosterone.
Gene prioritization
We used the SMR software package37 to systematically map associated genetic variants to genes via expression effects (eQTLs). For all analyses we included expression data from liver, in addition to skeletal muscle in men and adrenal gland in women. All expression data was generated by the GTEx consortium (v7), made available from the SMR website resource section (https://cnsgenomics.com/software/smr/#DataResource). Only genes passing multiple test correction and exhibiting no statistically significant evidence of coincidental eQTL overlap (assessed by the SMR HEIDI metric) were considered. The same data was additionally used to perform global tissue enrichment using LDSC-SEG38.
Mendelian randomization analyses
For outcome traits, we limited analyses to traits that i) were previously reported as associated with circulating sex hormone levels, ii) have sex specific associations with sex hormones, and iii) where sex-specific GWAS data was available in large non-UK Biobank studies (see Supplementary Table S19). Given the potential for bias in MR studies when a large proportion of genetic variants are discovered in the same sample as the outcome is measured, we used non UK Biobank GWAS data as the primary outcome data. This resulted in us considering as an outcome six diseases: type 2 diabetes, PCOS, prostate cancer, breast cancer, ovarian cancer and endometrial cancer; two glycaemic traits: fasting insulin as a measure of insulin resistance and fasting glucose; and four main measures of body composition: BMI, waist hip ratio adjusted for BMI, and, using DEXA measures, total body fat and total lean mass. Where we observed positive associations for total fat or lean mass, we tested 6 more specific measures of body composition; android fat, gynoid fat, android lean mass, gynoid lean mass, subcutaneous and visceral fat from DEXA data. Outcome data for number of sexual partners was based on previously analysed data from UK Biobank39
Each of the 12 genetic instruments described above was used as an exposure instrumental variable in our subsequent Mendelian Randomization analyses. Where a signal was not present in the outcome GWAS, we identified a 1000 Genomes or HapMap proxy with r2>0.5 within 250kb either side of the signal and their relevant weight was included in our genetic instrument (Supplementary Table S28).
In each MR test we assessed a number of widely used methods - inverse variance weighted (IVW), weighted median, and MR-Egger40,41. Mendelian randomisation relies on some key assumptions. These assumptions include 1) that alleles are randomly assigned among people; and 2) that alleles that influence exposure do not influence the outcome via any other pathway other than through the exposure. The use of the most robust models available (linear mixed models), as implemented in BOLT-LMM, to ensure alleles are not stratified within the UK Biobank provides reassurances that the first assumption holds. To address the second assumption, we performed several additional analyses. We used two additional MR methods (MR-Egger and Median MR) both of which are more robust to pleiotropy – directionally consistent results strengthened our causal inference. We used the MR-Egger intercept, with a p value of p<0.05, to provide evidence that pleiotropy could be affecting the MR results. Furthermore, we implemented an approach known as “Steiger filtering”. In this test, we excluded variants with larger effects on outcome traits or traits known to be closely associated to outcome traits compared to their effects on the sex hormone exposure trait42. Given the strong association between SHBG and adiposity and insulin resistance, and the large discovery sample size, it was possible that many variants could be associated with sex hormone levels via an outcome trait, rather than having direct effects on sex hormones, so invalidating the MR assumptions. We excluded between 2 and 40 % of variants (depending on the sex hormone) trait if they had larger effects (based on an absolute standardized beta) on any one of 11 metabolic traits available in the UK Biobank (fasting glucose, T2D, coronary artery disease, HDL-C, LDL-C, triglycerides, total-cholesterol, diastolic and systolic blood pressure, BMI and Waist hip ratio adjusted for BMI). A full table of which variants were excluded and why is given in Supplementary Table S29).
Secondly, we considered only cis variants at the SHBG gene locus (Supplementary Table S24). Here we used two variants in low linkage disequilibrium as more specific but less powerful genetic instruments. Variants in cis with a gene likely represent the most specific test of the causal role of a circulating protein encoded by that gene. One of these variants (rs1799941) is common and has been used in several previous MR studies of SHBG16,19, whilst the other (rs6258) is rare (~1% MAF) and alters SHBG’s binding affinity for testosterone.
Extended Data
Extended Data Fig. 1. Replication of identified SHBG signals in CHARGE meta-analysis.
a) Effect size comparison performed against published estimates from the CHARGE male SHBG meta-analysis (N=12,401). b) Effect size comparison performed against published estimates from the CHARGE female SHBG meta-analysis (N=9,390). The SHBG cis locus (which had a concordant effect direction) has been excluded to maintain an appropriate scale.
Extended Data Fig. 2. Relationship between measured sex hormone levels in the EPIC-Norfolk study and polygenic score for increased sex hormone level.
a) Total testosterone levels in the EPIC-Norfolk study by polygenic score for increased total testosterone (n=5,334 men; n=3,804 women). b) SHBG levels in the EPIC-Norfolk study by polygenic score for increased SHBG (n=5,694 men; n=5,476 women). Bars denote the standard error around the point estimate of the mean. Effect on hormone is given in standard deviations (SDs). SHBG=sex hormone binding globulin.
Extended Data Fig. 3. LD score regression analysis of enrichment of sex hormone signals in 53 GTEx tissues and cell types.
a) Analysis in men. b) Analysis in women.
Extended Data Fig. 4. Results of inverse-variance weighted Mendelian randomization analysis of sex hormone genetic instruments on metabolic traits and body composition outcomes.
Dot plots representing the change in the following metabolic outcomes and body composition traits in males and females per unit higher sex hormone: a) Total lean mass. b) Total fat mass. c) BMI. d) Waist-hip ratio adjusted for BMI. e) Fasting insulin. f) Fasting glucose. g) Type 2 diabetes. Bars indicate 95% confidence interval around the point estimate from inverse-variance weighted analysis. Analyses are based on association statistics generated in a maximum of: total and specific testosterone, n=194,453 men and n=230,454 women; bioavailable testosterone, n=178,782 men and n=188,507 women; SHBG, n=180,726 men and n=189,473 women; total lean mass and total fat mass, n=9,102 men and n=10,406 women; BMI, n=152,893 men and n=171,977 women; WHR adjusted for BMI, n=93,480 men and n=116,742 women; fasting insulin, n=47,806 men and n=50,404 women; fasting glucose, n=67,506 men and n=73,089 women; T2D, n=34,990 cases and n=150,760 controls in men and n=17,790 cases and n=243,645 controls in women. Numbers of genetic variants included in the analyses are given in Tables S20, S21, S23 and S26. BMI=body mass index; SHBG=sex hormone binding globulin; T=testosterone; T Specific=testosterone cluster; WHR=waist-hip ratio.
Extended Data Fig. 5. Results of Mendelian randomization analysis in men of genetic instruments for testosterone and SHBG on the outcome of Type 2 diabetes.
Plots show effect on ln(odds) of Type 2 diabetes (y axes) in men of the following sex hormone genetic instruments (x axes; effect size in units). a) Total testosterone. b) Steiger filtered total testosterone. c) Bioavailable testosterone. d) Steiger filtered bioavailable testosterone. e) Testosterone specific cluster. f) Steiger filtered testosterone specific cluster. g) SHBG. h) Steiger filtered SHBG. i) SHBG specific cluster. j) Steiger filtered SHBG specific cluster. P-values and effect size estimates (indicated by lines) are from Egger (pink), IVW (blue), and median IV (red) Mendelian randomization analyses. Bars indicate 95% confidence interval around the point estimate for each genetic variant. Analyses are based on association statistics generated in a maximum of: total testosterone (including specific and Steiger filtered), n=194,453; bioavailable testosterone (including Steiger filtered), n=178,782; SHBG (including specific and Steiger filtered), n=180,726; T2D, n=34,990 cases and n=150,760 controls. Numbers of genetic variants included in the analyses are given in Table S20. SHBG=sex hormone binding globulin.
Extended Data Fig. 6. Results of inverse-variance weighted Mendelian randomization analysis of sex hormone genetic instruments on cancer outcomes.
Dot plots representing the change in the odds of the following cancers per unit higher sex hormone in males or females, as appropriate. a) Prostate cancer in males. b) Breast cancer (all types) and estrogen receptor positive (ER+) and negative (ER-) subtypes in females. c) Endometrial cancer in females. d) Ovarian cancer in females. Bars indicate 95% confidence interval around the point estimate from inverse-variance weighted analyses. Analyses are based on association statistics generated in a maximum of: total and specific testosterone, n=194,453 men and n=230,454 women; bioavailable testosterone, n=178,782 men and n=188,507 women; SHBG, n=180,726 men and n=189,473 women; estradiol, n=206,927 men; prostate cancer, 67,158 cases and 48,350 controls; breast cancer, n=105,974 cases and n=122,977 controls; ER negative subtype breast cancer, n=21,468 cases and n=100,594 controls; ER positive subtype breast cancer, n=69,501 cases and n=95,039 controls; endometrial cancer, n=12,270 cases and n=46,126 controls; ovarian cancer, n=25,509 cases and n=40,941 controls. Numbers of genetic variants included in the analyses are given in Tables S25 and S27. SHBG=sex hormone binding globulin; T=testosterone; T Specific=testosterone cluster.
Extended Data Fig. 7. Results of inverse-variance weighted Mendelian randomization analysis in females of sex hormone genetic instruments on PCOS.
Dot plot represents the odds of PCOS per unit higher sex hormone. Bars indicate 95% confidence interval around the point estimate from inverse-variance weighted analyses. Analyses are based on association statistics generated in a maximum of: total and specific testosterone, n=230,454; bioavailable testosterone, n=188,507; SHBG, n=189,473; PCOS, n=10,074 cases and n=103,164 controls. Numbers of genetic variants included in the analyses are given in Table S21. PCOS=polycystic ovary syndrome; SHBG=sex hormone binding globulin; T=testosterone; T Specific=testosterone cluster
Extended Data Fig. 8. Results of Mendelian randomization analysis in women of genetic instruments for testosterone and SHBG on the outcome of PCOS.
Plots show effect on ln(odds) of PCOS (y axes) of the following sex hormone genetic instruments in women (x axes; effect size in units). a) Total testosterone. b) Steiger filtered total testosterone. c) Bioavailable testosterone. d) Steiger filtered bioavailable testosterone. e) Testosterone specific cluster. f) Steiger filtered testosterone specific cluster. g) SHBG. h) Steiger filtered SHBG. i) SHBG specific cluster. j) Steiger filtered SHBG specific cluster. P-values and effect size estimates (indicated by lines) are from Egger (pink), IVW (blue), and median IV (red) Mendelian randomization analyses. Bars indicate 95% confidence interval around the point estimate for each genetic variant. Analyses are based on association statistics generated in a maximum of: total testosterone (including specific and Steiger filtered), n=230,454; bioavailable testosterone (including Steiger filtered), n=188,507; SHBG (including specific and Steiger filtered), n=189,473; PCOS, n=10,074 cases and n=103,164 controls. Numbers of genetic variants included in the analyses are given in Table S21. PCOS=polycystic ovary syndrome; SHBG=sex hormone binding globulin.
Extended Data Fig. 9. Results of Mendelian randomization analysis in women of genetic instruments for testosterone and SHBG on the outcome of Type 2 diabetes.
Plots show effect on ln(odds) of Type 2 diabetes in women (y axes) of the following sex hormone genetic instruments in women (x axes; effect size in units). a) Total testosterone. b) Steiger filtered total testosterone. c) Bioavailable testosterone. d) Steiger filtered bioavailable testosterone. e) Testosterone specific cluster. f) Steiger filtered testosterone specific cluster. g) SHBG. h) Steiger filtered SHBG. i) SHBG specific cluster. j) Steiger filtered SHBG specific cluster. P-values and effect size estimates (indicated by lines) are from Egger (pink), IVW (blue), and median IV (red) Mendelian randomization analyses. Bars indicate 95% confidence interval around the point estimate for each genetic variant. Analyses are based on association statistics generated in a maximum of: total testosterone (including specific and Steiger filtered), n=230,454; bioavailable testosterone (including Steiger filtered), n=188,507; SHBG (including specific and Steiger filtered), n=189,473; T2D, n=17,790 cases and n=243,645 controls. Numbers of genetic variants included in the analyses are given in Table S21. SHBG=sex hormone binding globulin.
Supplementary Material
Acknowledgements
This research has been conducted using the UK Biobank Resource under application numbers 9072, 9055, 9797 and 44448. The authors acknowledge the use of the University of Exeter High-Performance Computing (HPC) facility in carrying out this work. We thank Kashyap Patel, Rob Andrews and Timothy McDonald for their advice on the derivation of testosterone measures and their role in PCOS and diabetes. We thank the MAGIC consortium and Ines Barroso for sharing pre-publication sex-specific glycaemic trait GWAS data.
Funding
A.R.W. and T.M.F. are supported by the European Research Council grant: SZ-245 50371-GLUCOSEGENES-FP7-IDEAS-ERC. R.B. is funded by the Wellcome Trust and Royal Society grant 104150/Z/14/Z. J.T. is supported by the Academy of Medical Sciences Springboard award which is supported by the Wellcome Trust and GCRF [SBF004\1079]. This work was supported by the Medical Research Council [Unit Programme numbers MC_UU_12015/1 and MC_UU_12015/2].
Footnotes
Author Contributions
K.S.R., F.R.D., J.T., D.J.T., J.R.B.P., T.M.F. analysed the data. K.S.R., F.R.D., J.T., J.R.B.P., T.M.F., K.K.O., A.Murray. drafted the manuscript. D.J.T., A.R.W., A.Mahajan., R.N.B., L.W., S.M., A.S.B., A.M.E., B.H., T.A.O’M, M.I.M, C.L., D.F.E, N.J.W, S.B. and ECA consortium contributed data and advised on analysis. J.R.B.P., T.M.F., K.K.O., A.Murray., S.B. designed and led the study. All co-authors commented on and revised the manuscript.
Competing Interests Statement
The views expressed in this article are those of the author(s) and not necessarily those of the NHS, the NIHR, or the Department of Health. M.I.M has served on advisory panels for Pfizer, NovoNordisk and Zoe Global, has received honoraria from Merck, Pfizer, Novo Nordisk and Eli Lilly, and research funding from Abbvie, Astra Zeneca, Boehringer Ingelheim, Eli Lilly, Janssen, Merck, NovoNordisk, Pfizer, Roche, Sanofi Aventis, Servier, and Takeda. As of June 2019, M.I.M is an employee of Genentech, and a holder of Roche stock. T.M.F. holds a MRC CASE studentship with GSK; has consulted for Sanofi, Servier and Boerhinger Ingelheim.
Data availability statement
All data used in discovery analyses is available from UK Biobank upon request (https://www.ukbiobank.ac.uk).
References
- 1.Ding EL, Song Y, Malik VS, Liu S. Sex differences of endogenous sex hormones and risk of type 2 diabetes: a systematic review and meta-analysis. JAMA. 2006;295:1288–99. doi: 10.1001/jama.295.11.1288. [DOI] [PubMed] [Google Scholar]
- 2.Yao Q-M, Wang B, An X-F, Zhang J-A, Ding L. Testosterone level and risk of type 2 diabetes in men: a systematic review and meta-analysis. Endocr Connect. 2018;7:220–231. doi: 10.1530/EC-17-0253. [DOI] [PMC free article] [PubMed] [Google Scholar]
- 3.Bann D, et al. Changes in testosterone related to body composition in late midlife: Findings from the 1946 British birth cohort study. Obesity (Silver Spring) 2015;23:1486–92. doi: 10.1002/oby.21092. [DOI] [PMC free article] [PubMed] [Google Scholar]
- 4.Baillargeon J, Kuo Y-F, Westra JR, Urban RJ, Goodwin JS. Testosterone Prescribing in the United States, 2002-2016. JAMA. 2018;320:200–202. doi: 10.1001/jama.2018.7999. [DOI] [PMC free article] [PubMed] [Google Scholar]
- 5.Handelsman DJ. Global trends in testosterone prescribing, 2000-2011: expanding the spectrum of prescription drug misuse. Med J Aust. 2013;199:548–51. doi: 10.5694/mja13.10111. [DOI] [PubMed] [Google Scholar]
- 6.Bhasin S, et al. Testosterone Therapy in Men With Hypogonadism: An Endocrine Society Clinical Practice Guideline. J Clin Endocrinol Metab. 2018;103:1715–1744. doi: 10.1210/jc.2018-00229. [DOI] [PubMed] [Google Scholar]
- 7.Endogenous Hormones and Prostate Cancer Collaborative Group. Roddam AW, Allen NE, Appleby P, Key TJ. Endogenous sex hormones and prostate cancer: a collaborative analysis of 18 prospective studies. J Natl Cancer Inst. 2008;100:170–83. doi: 10.1093/jnci/djm323. [DOI] [PMC free article] [PubMed] [Google Scholar]
- 8.Klap J, Schmid M, Loughlin KR. The relationship between total testosterone levels and prostate cancer: a review of the continuing controversy. J Urol. 2015;193:403–13. doi: 10.1016/j.juro.2014.07.123. [DOI] [PubMed] [Google Scholar]
- 9.Watts EL, et al. Low Free Testosterone and Prostate Cancer Risk: A Collaborative Analysis of 20 Prospective Studies. Eur Urol. 2018;74:585–594. doi: 10.1016/j.eururo.2018.07.024. [DOI] [PMC free article] [PubMed] [Google Scholar]
- 10.Snyder PJ, et al. Lessons From the Testosterone Trials. Endocr Rev. 2018;39:369–386. doi: 10.1210/er.2017-00234. [DOI] [PMC free article] [PubMed] [Google Scholar]
- 11.Grossmann M, Hoermann R, Wittert G, Yeap BB. Effects of testosterone treatment on glucose metabolism and symptoms in men with type 2 diabetes and the metabolic syndrome: a systematic review and meta-analysis of randomized controlled clinical trials. Clin Endocrinol (Oxf) 2015;83:344–51. doi: 10.1111/cen.12664. [DOI] [PubMed] [Google Scholar]
- 12.Huang G, et al. Long-Term Testosterone Administration on Insulin Sensitivity in Older Men With Low or Low-Normal Testosterone Levels. J Clin Endocrinol Metab. 2018;103:1678–1685. doi: 10.1210/jc.2017-02545. [DOI] [PMC free article] [PubMed] [Google Scholar]
- 13.Huang G, et al. Testosterone dose-response relationships with cardiovascular risk markers in androgen-deficient women: a randomized, placebo-controlled trial. J Clin Endocrinol Metab. 2014;99:E1287–93. doi: 10.1210/jc.2013-4160. [DOI] [PMC free article] [PubMed] [Google Scholar]
- 14.Chan KJ, Liang JJ, Jolly D, Weinand JD, Safer JD. Exogenous Testosterone Does Not Induce or Exacerbate The Metabolic Features Associated With Pcos Among Transgender Men. Endocr Pract. 2018;24:565–572. doi: 10.4158/EP-2017-0247. [DOI] [PubMed] [Google Scholar]
- 15.Ding EL, et al. Sex hormone-binding globulin and risk of type 2 diabetes in women and men. N Engl J Med. 2009;361:1152–63. doi: 10.1056/NEJMoa0804381. [DOI] [PMC free article] [PubMed] [Google Scholar]
- 16.Perry JRB, et al. Genetic evidence that raised sex hormone binding globulin (SHBG) levels reduce the risk of type 2 diabetes. Hum Mol Genet. 2010;19:535–44. doi: 10.1093/hmg/ddp522. [DOI] [PMC free article] [PubMed] [Google Scholar]
- 17.Ohlsson C, et al. Genetic determinants of serum testosterone concentrations in men. PLoS Genet. 2011;7:e1002313. doi: 10.1371/journal.pgen.1002313. [DOI] [PMC free article] [PubMed] [Google Scholar]
- 18.Eriksson AL, et al. Genetic Determinants of Circulating Estrogen Levels and Evidence of a Causal Effect of Estradiol on Bone Density in Men. J Clin Endocrinol Metab. 2018;103:991–1004. doi: 10.1210/jc.2017-02060. [DOI] [PMC free article] [PubMed] [Google Scholar]
- 19.Coviello AD, et al. A genome-wide association meta-analysis of circulating sex hormone-binding globulin reveals multiple Loci implicated in sex steroid hormone regulation. PLoS Genet. 2012;8:e1002805. doi: 10.1371/journal.pgen.1002805. [DOI] [PMC free article] [PubMed] [Google Scholar]
- 20.Ruth KS, et al. Genome-wide association study with 1000 genomes imputation identifies signals for nine sex hormone-related phenotypes. Eur J Hum Genet. 2016;24:284–90. doi: 10.1038/ejhg.2015.102. [DOI] [PMC free article] [PubMed] [Google Scholar]
- 21.Chen H, et al. Fkbp52 regulates androgen receptor transactivation activity and male urethra morphogenesis. J Biol Chem. 2010;285:27776–84. doi: 10.1074/jbc.M110.156091. [DOI] [PMC free article] [PubMed] [Google Scholar]
- 22.Odet F, Verot A, Le Magueresse-Battistoni B. The mouse testis is the source of various serine proteases and serine proteinase inhibitors (SERPINs): Serine proteases and SERPINs identified in Leydig cells are under gonadotropin regulation. Endocrinology. 2006;147:4374–83. doi: 10.1210/en.2006-0484. [DOI] [PubMed] [Google Scholar]
- 23.Mahajan A, et al. Fine-mapping type 2 diabetes loci to single-variant resolution using high-density imputation and islet-specific epigenome maps. Nat Genet. 2018;50:1505–1513. doi: 10.1038/s41588-018-0241-6. [DOI] [PMC free article] [PubMed] [Google Scholar]
- 24.Lagou Vasiliki, Mägi Reedik, Hottenga Jouke-Jan J, et al. Fasting glucose and insulin variability: sex-dimorphic genetic effects and novel loci. 2019 doi: 10.1038/s41467-020-19366-9. In_Preparation. [DOI] [PMC free article] [PubMed] [Google Scholar]
- 25.Conway G, et al. The polycystic ovary syndrome: a position statement from the European Society of Endocrinology. Eur J Endocrinol. 2014;171:P1–29. doi: 10.1530/EJE-14-0253. [DOI] [PubMed] [Google Scholar]
- 26.Jayasena CN, et al. A systematic review of randomized controlled trials investigating the efficacy and safety of testosterone therapy for female sexual dysfunction in postmenopausal women. Clin Endocrinol (Oxf) 2019;90:391–414. doi: 10.1111/cen.13906. [DOI] [PubMed] [Google Scholar]
- 27.Brand JS, van der Tweel I, Grobbee DE, Emmelot-Vonk MH, van der Schouw YT. Testosterone, sex hormone-binding globulin and the metabolic syndrome: a systematic review and meta-analysis of observational studies. Int J Epidemiol. 2011;40:189–207. doi: 10.1093/ije/dyq158. [DOI] [PubMed] [Google Scholar]
- 28.Rees DA, Dayan CM. Commentary: testosterone and the metabolic syndrome: cause or consequence? Int J Epidemiol. 2011;40:207–9. doi: 10.1093/ije/dyq254. [DOI] [PubMed] [Google Scholar]
- 29.Bycroft C, et al. The UK Biobank resource with deep phenotyping and genomic data. Nature. 2018;562:203–209. doi: 10.1038/s41586-018-0579-z. [DOI] [PMC free article] [PubMed] [Google Scholar]
- 30.Vermeulen A, Verdonck L, Kaufman JM. A critical evaluation of simple methods for the estimation of free testosterone in serum. J Clin Endocrinol Metab. 1999;84:3666–72. doi: 10.1210/jcem.84.10.6079. [DOI] [PubMed] [Google Scholar]
- 31.Chung MC, Gombar S, Shi RZ. Implementation of Automated Calculation of Free and Bioavailable Testosterone in Epic Beaker Laboratory Information System. J Pathol Inform. 2017;8:28. doi: 10.4103/jpi.jpi_28_17. [DOI] [PMC free article] [PubMed] [Google Scholar]
- 32.Loh P-R, et al. Efficient Bayesian mixed-model analysis increases association power in large cohorts. Nat Genet. 2015;47:284–290. doi: 10.1038/ng.3190. [DOI] [PMC free article] [PubMed] [Google Scholar]
- 33.Day FR, Loh P-R, Scott RA, Ong KK, Perry JRB. A Robust Example of Collider Bias in a Genetic Association Study. Am J Hum Genet. 2016;98:392–3. doi: 10.1016/j.ajhg.2015.12.019. [DOI] [PMC free article] [PubMed] [Google Scholar]
- 34.Day N, et al. EPIC-Norfolk: study design and characteristics of the cohort. European Prospective Investigation of Cancer. Br J Cancer. 1999;80(Suppl 1):95–103. [PubMed] [Google Scholar]
- 35.Yang J, Lee SH, Goddard ME, Visscher PM. GCTA: a tool for genome-wide complex trait analysis. Am J Hum Genet. 2011;88:76–82. doi: 10.1016/j.ajhg.2010.11.011. [DOI] [PMC free article] [PubMed] [Google Scholar]
- 36.Metsalu T, Vilo J. ClustVis: a web tool for visualizing clustering of multivariate data using Principal Component Analysis and heatmap. Nucleic Acids Res. 2015;43:W566–70. doi: 10.1093/nar/gkv468. [DOI] [PMC free article] [PubMed] [Google Scholar]
- 37.Zhu Z, et al. Integration of summary data from GWAS and eQTL studies predicts complex trait gene targets. Nat Genet. 2016;48:481–487. doi: 10.1038/ng.3538. [DOI] [PubMed] [Google Scholar]
- 38.Finucane HK, et al. Heritability enrichment of specifically expressed genes identifies disease-relevant tissues and cell types. Nat Genet. 2018;50:621–629. doi: 10.1038/s41588-018-0081-4. [DOI] [PMC free article] [PubMed] [Google Scholar]
- 39.Ganna A, et al. Large-scale GWAS reveals insights into the genetic architecture of same-sex sexual behavior. Science. 2019 Aug 30;365(6456) doi: 10.1126/science.aat7693. [DOI] [PMC free article] [PubMed] [Google Scholar]
- 40.Bowden J, Davey Smith G, Burgess S. Mendelian randomization with invalid instruments: effect estimation and bias detection through Egger regression. Int J Epidemiol. 2015;44:512–25. doi: 10.1093/ije/dyv080. [DOI] [PMC free article] [PubMed] [Google Scholar]
- 41.Bowden J, Davey Smith G, Haycock PC, Burgess S. Consistent Estimation in Mendelian Randomization with Some Invalid Instruments Using a Weighted Median Estimator. Genet Epidemiol. 2016;40:304–14. doi: 10.1002/gepi.21965. [DOI] [PMC free article] [PubMed] [Google Scholar]
- 42.Haas ME, et al. Genetic Association of Albuminuria with Cardiometabolic Disease and Blood Pressure. Am J Hum Genet. 2018;103:461–473. doi: 10.1016/j.ajhg.2018.08.004. [DOI] [PMC free article] [PubMed] [Google Scholar]
Associated Data
This section collects any data citations, data availability statements, or supplementary materials included in this article.


