Abstract
Background:
Association of drugs acting against different antiangiogenic mechanisms may increase therapeutic effect and reduce resistance. Noninvasive monitoring of changes in the antiangiogenic response of individual tumors could guide selection and administration of drug combinations. Noninvasive detection of early therapeutic response during dual, vertical targeting of the vascular endothelial growth factor pathway was investigated in an ectopic subcutaneous xenograft model for human pancreatic tumor.
Methods:
Dynamic contrast-enhanced ultrasound 12 MHz was used to monitor tumor-bearing Naval Medical Research Institute mice beginning 15 days after tumor implantation. Mice received therapy from 15 to 29 days with sorafenib (N = 9), ziv-aflibercept (N = 11), combined antiangiogenic agents (N = 11), and placebo control (N = 14). Sorafenib (BAY 43-9006; Nexavar), a multikinase inhibitor acting on Raf kinase and receptor tyrosine kinases—including vascular endothelial growth factor receptors 2 and 3—was administered daily (60 mg/kg, per os). Ziv-aflibercept (ZALTRAP), a high-affinity ligand trap blocking the activity of vascular endothelial growth factor A, vascular endothelial growth factor B, and placental growth factor was administered twice per week (40 mg/kg, intraperitoneally).
Results:
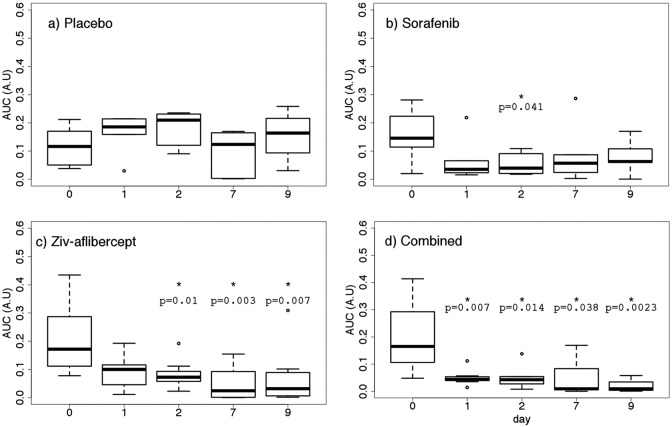
Functional evaluation with dynamic contrast-enhanced ultrasound indicated stable tumor vascularization for the control group while revealing significant and sustained reduction after 1 day of therapy in the combined group (P = .007). There was no survival benefit or penalty due to drug combination. The functional progression-free survival assessed with dynamic contrast-enhanced ultrasound was significantly higher for the 3 treated groups; whereas, the progression-free survival based on tumor size did not discriminate therapeutic effect.
Conclusions:
Dynamic contrast-enhanced ultrasound, therefore, presents strong potential to monitor microvascular modifications during antiangiogenic therapy, a key role to monitoring antiangiogenic combining therapy to adapt dose range drug.
Keywords: dynamic contrast-enhanced ultrasound (DCE-US), combining antiangiogenic therapy, ziv-aflibercept, sorafenib, animal model, pancreatic tumor, contrast agent
Introduction
The development of tumor angiogenesis is correlated with the tumor’s invasive potential.1 Several antiangiogenic agents have been approved for cancer therapy in patients alone or in combination with conventional therapies2-6 There are several clinical treatments associating cytotoxic and antiangiogenic drugs, such as bevacizumab and ziv-aflibercept for the treatment of metastatic colonic adenocarcinoma4,5 or bevacizumab with carboplatin and pemetrexed for the treatment of patients with non-small cell lung cancer,6 with taxane and carboplatin in breast and ovarian adenocarcinoma7,8 and oxiplatin or irinotecan and/or 5-fluorouracil in colorectal adenocarcinoma.4,9 However, it has been shown that the effectiveness of antiangiogenic drugs is modest and short acting in patients, with therapy resistance generally developing within a few months.10 In particular, as tumors grow, they may adapt to activate angiogenic pathways other than those blocked by therapy.11,12 It has been suggested that the association of drugs acting against different antiangiogenic mechanisms may increase long-term therapeutic effect and reduce resistance. An important potential risk of such combinations, however, is increased toxicity.13-17 There is, thus, a significant need for information on individual response to therapy to guide the choice of drug combinations and to determine the effective tolerable dose.
Noninvasive monitoring techniques able to detect early changes in the antiangiogenic response would provide a means to tailor drug combinations based on individual patient response. Although the response evaluation criteria in solid tumors (RECIST) criteria has proven to be a useful end point in clinical trials, it is based on tumor size regression and does not provide information on perfusion modifications during antiangiogenic therapy that precedes tumor size regression.18-20
Several studies have shown that antiangiogenic modifications can be detected earlier using dynamic contrast-enhanced ultrasound (DCE-US) than with morphological criteria.19-21 Dynamic contrast-enhanced ultrasound is a well-accepted technique that can provide real-time imaging at the patient’s bedside. It is well tolerated and can be repeated often to monitor therapeutic effect. It is currently used in clinical routine for the characterization of focal liver lesions,22,23 to monitor antiangiogenic effect during treatment of neoplasms,24 and in cardiology.25 Studies have demonstrated that analysis of the contrast enhancement in tumors together with information on tumor growth can provide good indication of antiangiogenic therapy effectiveness.19-21
This preclinical study in an ectopic subcutaneous xenograft model for human pancreatic tumor assesses the capacity of DCE-US to detect early therapeutic response during antiangiogenic therapy. In particular, we assess the capacity to noninvasively discriminate modifications in microvascular flow during combined vertical blockade of the vascular endothelial growth factor (VEGF) pathway with ziv-aflibercept and sorafenib from those modifications occurring during monotherapy with the 2 drugs.
Methods
Cell Culture
The MiaPaCa-2 human pancreatic adenocarcinoma cell line was purchased from American Type Culture Collection (ATCC, Manassas, Virginia). Cells were cultured with McCoy 5A medium (PromoCell, Germany) supplemented with 10% (vol/vol) fetal calf serum, 2.5% (vol/vol) horse serum, l-glutamine (4 mM), penicillin (100 units/mL), and streptomycin (100 µg/mL). Cultures were incubated at 37°C in a 5% CO2 atmosphere humidified tissue culture incubator with twice weekly medium changes. The cells were tested using the Mycoalert method kit (Promo Cell, Heidelberg, Germany) for the detection of mycoplasma in cell cultures to ensure the absence of mycoplasmas.
Experiments were performed using cells in the 22nd and 23rd passage. MiaPaCa-2 cells were harvested by trypsin/EDTA treatment (0.25%; wt/vol) phosphate-buffered saline (PBS) trypsin solution supplemented with 1 mM EDTA. Trypsin was inactivated by addition of excess supplemented culture medium. Cells were collected by centrifugation, then suspended again in sterile PBS 1× solution and held in suspension at a concentration of 106 cells/mL for injection.
Subcutaneous Xenograft Model for Human Pancreatic Tumor
MiaPaCa-2 cells were suspended in PBS, and 100 µL of the cell suspension (1 × 10⁶ cells/mL) were injected subcutaneously into the flank of 6-week-old female nude mice (Naval Medical Research Institute mice; Elevage Janvier, Le Genest-St-Isle, France). Mice bearing tumors (27.8 ± 20.9 mm3) were treated from days 15 to 29 after tumor cell injection: twice weekly with 40 mg/kg of ziv-aflibercept in 0.1 mL physiological serum by intraperitoneal (ip) injection26; daily with 60 mg/kg sorafenib suspended in 0.1 mL Cremophor EL/ethanol (50:50; Sigma Cremophor EL, 95% ethyl alcohol; Sigma-Aldrich, St Quentin Fallavier, France) per os,27 both drugs or control HFc protein 10 mg/kg in 0.1 mL physiological serum, twice weekly ip and 0.1 mL Cremophor EL/ethanol daily per os.
Therapy
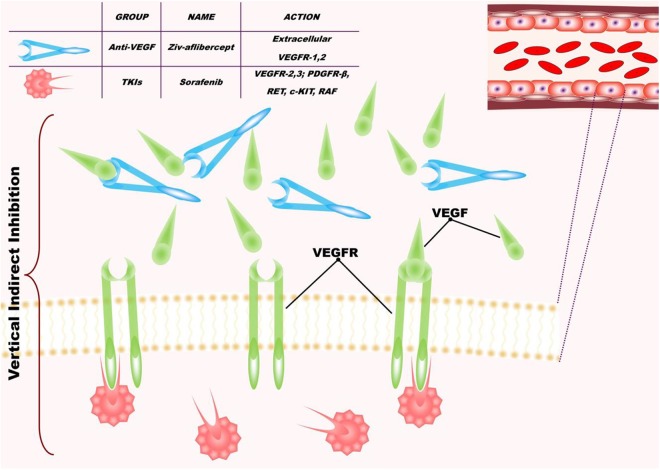
Two inhibitors of angiogenesis were used: ziv-aflibercept and sorafenib (Figure 1). Ziv-aflibercept (Zaltrap, Sanofi and Regeneron Pharmaceuticals, Inc., USA) has been developed as part of a collaboration between Sanofi and Regeneron Pharmaceuticals, Inc, (Zaltrap, Sanofi and Regeneron Pharmaceuticals, Inc., USA) and is approved for treatment of metastatic colorectal adenocarcinoma in combination with FOLFIRI for patients who have recurred following treatment with oxaliplatin.5 Ziv-aflibercept is a recombinant fusion protein containing VEGF-binding portions from the extracellular domains of human VEGF receptors 1 and 2, fused to the Fc portion of human immunoglobulin (Ig)G1. Ziv-aflibercept blocks the activity of VEGFA, VEGFB, and placental growth factor by acting as a high-affinity ligand trap to prevent binding to these endogenous receptors.28 Sorafenib (Nexavar; Bayer Schering Pharma, Leverkusen, Germany) is approved for antiangiogenic therapy of renal cellular carcinoma3 and hepatocellular carcinoma.29 Sorafenib is a small molecule that inhibits tumor cell proliferation and tumor angiogenesis and increases the rate of apoptosis in a wide range of tumor models. It acts by inhibiting serine–threonine kinases Raf-1 and B-Raf, receptor tyrosine kinase activity of VEGFRs expressed on the endothelium 2 and 3, and platelet-derived growth factor receptor β.30 Therefore, the combination of these 2 drugs inhibits the activation of VEGF by inhibiting VEGFR1, VEGFR2, and VEGFR3 expressed on the vascular endothelium and by blocking the circulating VEGFA and VEGFB (Figure 1).
Figure 1.
Schematic diagram showing the principle of the combined targeting of angiogenesis with ziv-aflibercept and sorafenib.
Dynamic Contrast-Enhanced Ultrasound
Dynamic contrast-enhanced ultrasound was performed using an ultrasound imaging system (Aplio 50; Toshiba, Tochigi, Japan) with a linear, 12-MHz probe (PLT 1202S). The probe was placed such that the ultrasound focal zone was centered on the tumor position. A 50-mm thick echo-gel pad (high polymer ultrasound standoff pad; Eurocamina, Milan, Italy) was placed between the transducer and the tumor’s surface to maintain a fixed imaging distance. Imaging settings were optimized for visualization of the superficial tumor and kept constant throughout the study (2-dimensional gain 92, transmit frequency h12.0, mechanical index 0.1). Time gain compensation controls were placed in a centered and fixed position.
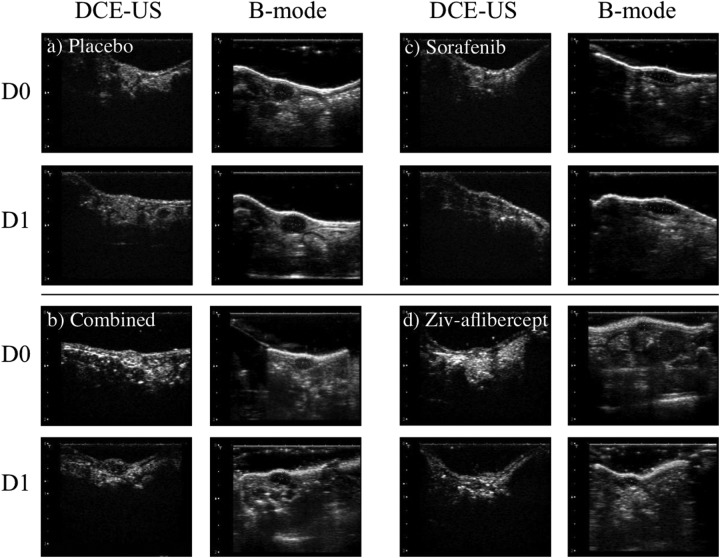
B-mode images were acquired at the central position of the tumor along both the sagittal and the transverse planes for evaluation of the dimensions of the major axes of the tumor (Figure 2). Tumor volume was calculated according to: V = (π/6)×(l×w×t) where l is the length, w the width, and t the thickness of the tumor as delimited on the B-mode images. The tumor size at day 0 was used for the initial randomization of mice into the 4 therapy groups.
Figure 2.
Ultrasound (US) imaging of the 4 groups. The B-mode images were selected in the transverse and sagittal planes to assess maximum dimensions of each tumor (only the sagittal plane is shown in the images). The dynamic contrast-enhanced US (DCE-US) is shown in the transverse plane during the peak contrast during the passage of the contrast bolus.
The DCE-US data sequences were acquired in Contrast Harmonic Imaging mode after retro-orbital injection of a 100 µL bolus of Luminity contrast agent (Luminity; Bristol-Myers Squibb, New York City, NY). The DCE-US data sequences were recorded in Raw Data–formatted files. Imaging data were first acquired 15 days after tumor cell injection which, with respect to treatment administration, is day 0 (prior to the first treatments). Imaging was then repeated on days 1, 2, 7, and 9 with respect to the treatment administration.
Sequence Analysis
A region of interest including the whole tumor was positioned on each DCE-US clip. The evolution of the mean linear echo-power with time was extracted from this region of interest using the CHI-Q user-interface (version 1.6; Toshiba). The linear echo-power versus time curve was fit using a log-normal model.31,32 The area under the curve (AUC) was calculated from the integral of the best fit curve over the acquisition time, which was fixed to be 25 seconds for all acquisitions (Figure 3).
Figure 3.
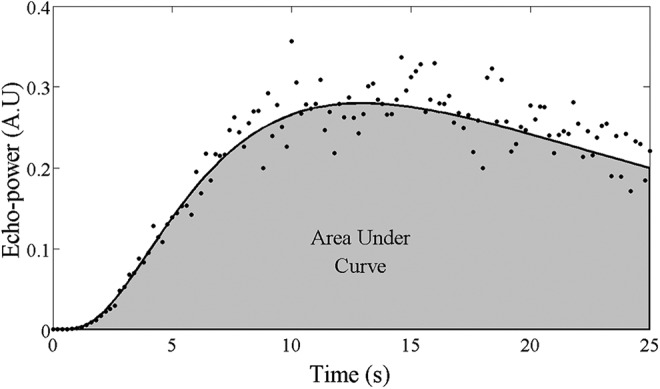
Example of an echo-power versus time curve extracted from a region of interest in a tumor. The mean echo power measured for each image frame is represented by the black points. The curve fit to these data according to the log-normal model is represented by the solid black line. The shaded region represents the area under the curve for t = 0 to 25 seconds.
Histological Analyses
Animals were euthanized if they reached institutional ethical end points associated with weight loss during the therapeutic follow-up. The time to this euthanasia was used in evaluating survival. Mice were housed at the Centre d’Explorations Fonctionnelle, Cordeliers’ Research Center, facility agreement no. A75-06-12, for at least 1 week before entering the experimental protocol. All experiments were conducted according to a protocol approved by the Charles Darwin National Ethical Committee for Region 5 (protocol authorization p3/2009/010).
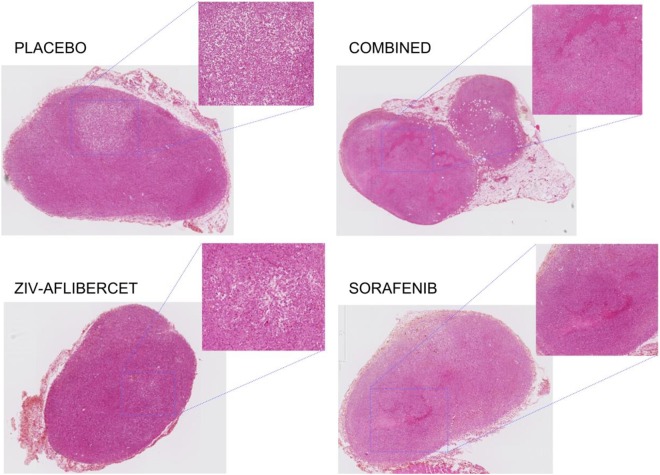
Following the final day of therapy, euthanasia was administered, and tumors were harvested. After fixation with 4% formaldehyde for at least 48 hours, necrosis was examined on 2 paraffin-embedded axial slides (5-µm thick) stained with hematoxylin-eosin stain (HES) and representing the most central cross-section of the tumor. Each HES-stained slide was mounted and observed using NDP view software after scanning slides with an HPF-Nanozoomer RS2.0 (Hamamatsu Photonics, Hamamatsu City, Japan; Figure 4).
Figure 4.
Histological sections of tumors from each treatment group to show the histological modification. Magnified zones show the different levels of necrosis: the diffuse necrosis in combined and monotherapy antiangiogenic drug groups (more in Ziv-aflibercet than Sorafenib). The placebo group presented centralized necrosis surrounded by viable tumor.
Statistical Analyses
Statistical significance of differences in the AUC day to day was estimated using the Wilcoxon signed rank test. Comparison of the AUC was made on stable groups of mice (mice euthanized during the period of a comparison were excluded from the data included in the statistical analysis).
Progression-free survival (PFS) was assessed from the initiation of treatment. Progression was defined as a maximum tumor dimension increase > 20% (RECIST 1.1) or an AUC increase >10% (functional criteria). Overall survival (OS) was assessed based on the time from the initiation of treatment to the time of necessity to administer ethical end-point euthanasia. Survival was followed from days 15 to 29 with respect to tumor implantation. Significance of the differences in survival between treatment groups was assessed using the log-rank test. All differences with a P value below .05 were considered significant. The analyses were made with R (R foundation for Statistical Computing, Vienna, Austria).
Results
In the first 3 days of treatment, 6 mice were removed from the study based on ethical end point: 4 of these were in the Placebo group, 1 in the sorafenib monotherapy group, and 1 in the ziv-aflibercept monotherapy group. At the ninth day of treatment, 28 mice remained in the study, but ultrasonic data for assessment of AUC was not evaluable for one of them (placebo group). Thereafter, due to the reduction in the number of mice per group, DCE-US analysis was discontinued after the ninth day. Therapy and survival monitoring were maintained for 14 days.
The animal weight was homogeneous before therapy began. After 14 days of treatment, there was a significant weight decrease in the group that received combined therapy which may be attributed to toxicity effects of the double-therapy association (Figure 5).
Figure 5.
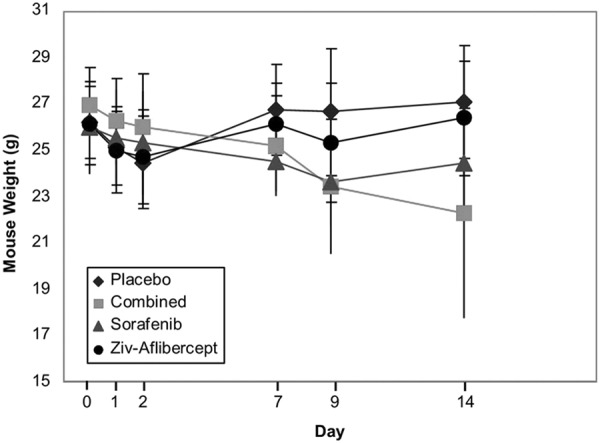
Animal weight of the mice in the 4 treatment groups as a function of time.
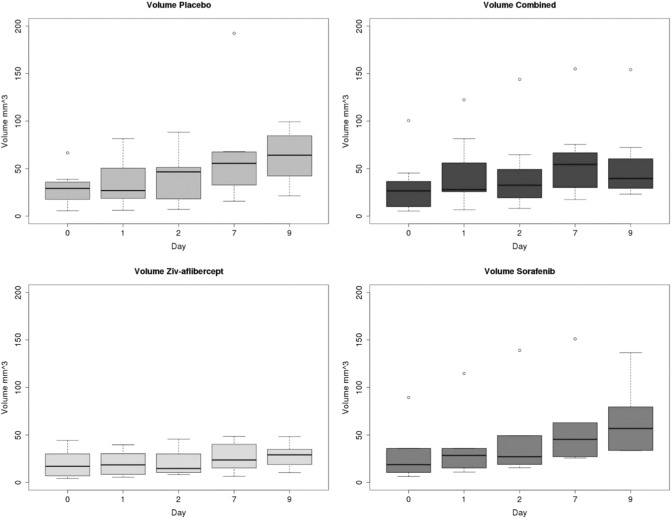
Tumor volume did not present any significant reduction in any of the groups. The only significant difference between groups was observed on day 9 for which the tumor volume in the placebo group was different from that in the combined and ziv-aflibercept groups (P < .05; Figure 6). Although the functional index, AUC, remained stable throughout the study in the placebo group, AUC decreased significantly from day 0 to 1 (after 24 hours of therapy) for the combined antiangiogenic group (P = .007; Figure 7). This significant decrease was maintained for all subsequent times (through day 9). Between days 0 and 1, no significant differences were found with respect to baseline AUC for the sorafenib and ziv-aflibercept groups. However, 48 hours after initiation of therapy, the group receiving ziv-aflibercept presented a significantly reduced AUC, (P = .010), and this decreased AUC level remained significantly lower with respect to baseline from days 2 to 9 (Figure 7). The decrease in AUC for the group receiving sorafenib was weakly significant only at 48 hours.
Figure 6.
Evolution of tumor volume in the different groups of mice.
Figure 7.
Area under the curve (AUC) estimated from dynamic contrast-enhanced ultrasound (DCE-US) for control mice receiving placebo (N = 6), mice receiving sorafenib (N= 6), ziv-aflibercept (N = 8), and the 2 drugs combined (N = 7).
There were no significant differences between the OS for the 4 groups (P = .7) as show by the Kaplan-Meier curve (Figure 8). The PFS according to the morphological RECIST criteria (largest tumor diameter) did not present any statistically different levels between the groups (P = .4, Figure 9). The PFS based on the functional criteria (AUC) was significantly better for the 3 groups receiving antiangiogenic treatment than for the placebo group (P < .05) but was not significantly different between the antiangiogenic therapy groups (Figure 10).
Figure 8.
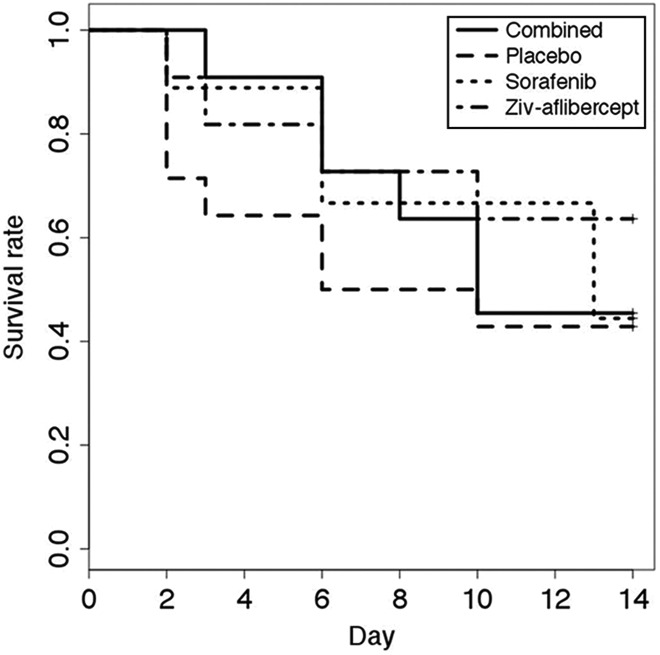
Survival as determined based on animal well-being. Ethical euthanasia was applied to any mice presenting more than 20% weight loss, tumor volume exceeding 2500 mm3 or exhibiting physical/behavioral signs of health impairment.
Figure 9.
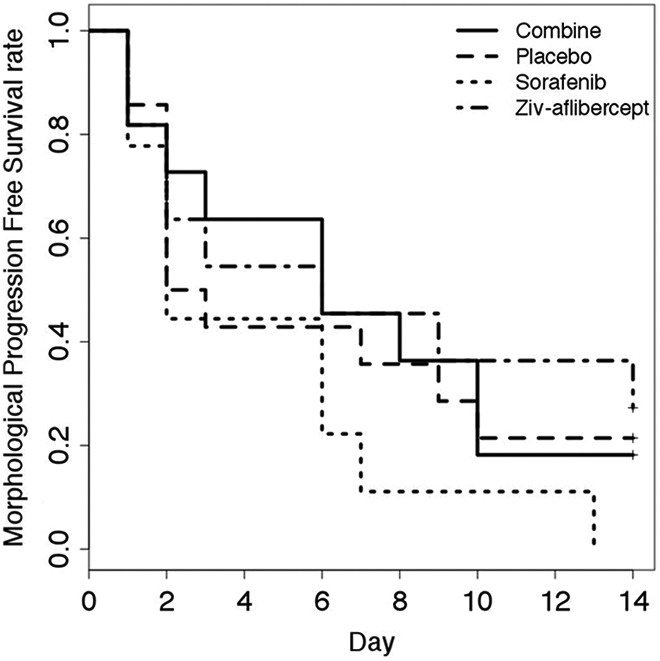
Progression free survival. Progression defined as an increase of > 20% in the largest tumor diameter (RECIST 1.1).
Figure 10.
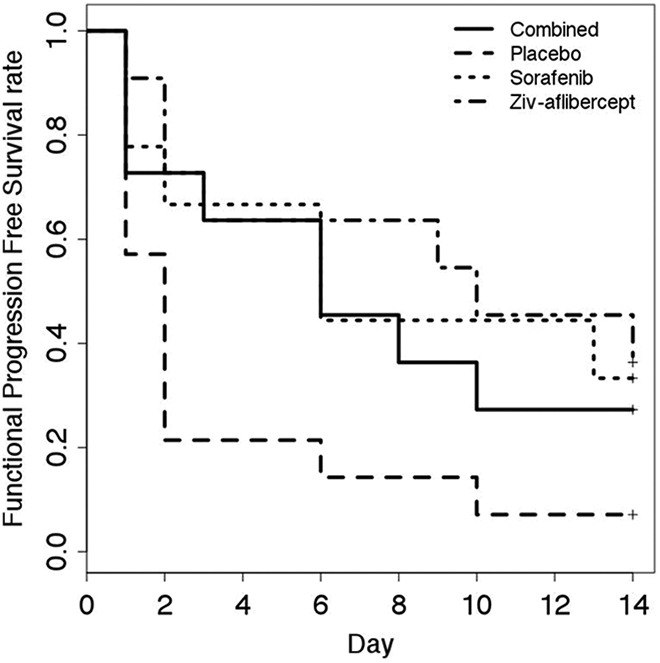
Functional progression-free survival. Progression defined as an increase of 10% of the area under the curve (AUC) with respect to baseline.
The sensitivity of DCE-US to differences in microvascular flow during combined vertical blockade of the VEGF pathway versus monotherapy was evaluated. The histological analysis, made on the 22 surviving mice at the end of the study, was consistent with AUC results. There was evidence of important, diffuse necrosis in combined and monotherapy antiangiogenic drug groups. The placebo group presented centralized necrosis surrounded by viable tumor (Figure 4).
Discussion
The interest of DCE-US for monitoring functional modifications of tumors during antiangiogenic therapy has been demonstrated.19-21 The AUC parameter considered in this study provides an estimate for the amount of contrast-traced blood flowing through the tumor. This blood-flow index identified response 24 hours after beginning combined antiangiogenic therapy. According to the AUC criteria, drug response and survival for all groups receiving combined and monotherapies were associated and were significantly better than that for the control group. The OS for therapy and control groups was similar. The PFS evaluated according the RECIST criteria was somewhat poorer for the placebo group, but this was not significant. Probably, the homogenization of tumor volume increase, with an orthotopic model, can optimize the results. In fact, the ectopic subcutaneous xenograft model has presented a limit in this study, showing very heterogeneous tumor growth.
It has been shown that the use of combinations of targeted therapies can reduce the probability of the development of resistance.33 The combination of antiangiogenic drugs is of interest to reduce resistance development to this type of therapy. Although AUC indicated earlier significant decrease for the group receiving combined antiangiogenic therapy, this group did not demonstrate significantly higher PFS than the groups treated with monotherapy. Survival data based on ethical end point euthanasia may not reveal long-term survival benefits. Furthermore, the competing effect between antiangiogenic effectiveness and increased toxicity for the drug combination may reduce survival benefit from the therapy. Increased toxicity due to drug association has, in effect, been identified as a major hurdle for the further development of cancer therapy combinations.34 Phase I studies with 2 antiangiogenics have been stopped early because of elevated mortality. The DCE-US could potentially be useful to adapt the dose of dual therapy to walk the fine line between toxicity related to the drugs and maintained therapeutic effect.14
Conclusions
The functional evaluation of the microvascularization of tumors with DCE-US had demonstrated a significant functional perfusion reduction after 24 hours of therapy combining ziv-aflibercept and sorafenib. At 48 hours, significant reduction in the AUC was also detected for antiangiogenic monotherapy.
The combined therapy presented early antiangiogenic response but without any difference in PFS and OS against antiangiogenic monotherapy. The PFS based on functional criteria measured using DCE-US was significantly improved in the 3 treated groups, whereas the PFS based on tumor size did not discriminate between treated groups and control.
The DCE-US presents strong potential to monitor microvascular modifications during antiangiogenic therapy. Such noninvasive monitoring of antiangiogenic therapy with DCE-US may provide a means to better adapt dose combinations when dual therapies are applied.
Acknowledgments
The authors acknowledge financial support from the Martine Midy Foundation, in particular for the fellowship of M.L.
Abbreviations
- AUC
area under the curve
- DCE-US
dynamic contrast-enhanced ultrasound
- HES
hematoxylin-eosin stain; ip, intraperitoneal
- OS
overall survival
- PBS
phosphate-buffered saline
- PFS
progression-free survival
- VEGF
vascular endothelial growth factor.
Authors’ Note: M.L. carried out the conception and design of the study, collecting and assembly of data, performing of measurements, analysis of data and interpretation. G.B., M.S., A.K., D.L., and A.C. provisioned to collecting, assembly, and analysis of data. O.L. and S.L.B. contributed to conception and design of the study, to analysis of data and interpretation, and to administrative support. E.C. collected and assembled the data. All authors writing read and approved the final manuscript. All experiments were conducted according to a protocol approved by the Charles Darwin National Ethical Committee for Region 5 (protocol authorization p3/2009/010).
Declaration of Conflicting Interests: The author(s) declared the following potential conflicts of interest with respect to the research, authorship, and/or publication of this article: Author O.L. declare relationships with the following companies: Boehringer Ingelheim, Roche, Bracco, Novartis and Pfizer. Authors M.L. declares relationships with the following companies: IPSEN, Amgen, Novartis and Pfizer.
Funding: The author(s) disclosed receipt of the following financial support for the research, authorship, and/or publication of this article: Received financial support from the Martine Midy Foundation, in particular for the fellowship of M.L.
ORCID iD: Michele Lamuraglia  https://orcid.org/0000-0001-8009-0218
References
- 1. Folkman J. Angiogenesis. Annu Rev Med. 2006;57:1–18. [DOI] [PubMed] [Google Scholar]
- 2. Motzer RJ, Hutson TE, Tomczak P, et al. Sunitinib versus interferon alfa in metastatic renal-cell carcinoma. N Engl J Med. 2007;356(2):115–124. [DOI] [PubMed] [Google Scholar]
- 3. Escudier B, Eisen T, Stadler WM, et al. Sorafenib in advanced clear-cell renal-cell carcinoma. N Engl J Med. 2007;356(2):125–134. [DOI] [PubMed] [Google Scholar]
- 4. Hurwitz H, Fehrenbacher L, Novotny W, et al. Bevacizumab plus irinotecan, fluorouracil, and leucovorin for metastatic colorectal cancer. N Engl J Med. 2004;350(23):2335–2342. [DOI] [PubMed] [Google Scholar]
- 5. Van CE, Tabernero J, Lakomy R, et al. Addition of aflibercept to fluorouracil, leucovorin, and irinotecan improves survival in a phase III randomized trial in patients with metastatic colorectal cancer previously treated with an oxaliplatin-based regimen. J Clin Oncol. 2012;30(28):3499–3506. [DOI] [PubMed] [Google Scholar]
- 6. Sandler A, Gray R, Perry MC, et al. Paclitaxel-carboplatin alone or with bevacizumab for non-small-cell lung cancer. N Engl J Med. 2006;355(24):2542–2550. [DOI] [PubMed] [Google Scholar]
- 7. Burger RA, Sill MW, Monk BJ, Greer BE, Sorosky JI. Phase II trial of bevacizumab in persistent or recurrent epithelial ovarian cancer or primary peritoneal cancer: a Gynecologic Oncology Group Study. J Clin Oncol. 2007;25(33):5165–5171. [DOI] [PubMed] [Google Scholar]
- 8. Miller K, Wang M, Gralow J, et al. Paclitaxel plus bevacizumab versus paclitaxel alone for metastatic breast cancer. N Engl J Med. 2007;357(26):2666–2776. [DOI] [PubMed] [Google Scholar]
- 9. Saltz LB, Clarke S, Diaz-Rubio E, et al. Bevacizumab in combination with oxaliplatin-based chemotherapy as first-line therapy in metastatic colorectal cancer: a randomized phase III study. J Clin Oncol. 2008;26(12):2013–2019. [DOI] [PubMed] [Google Scholar]
- 10. Shaked Y, Kerbel RS. Antiangiogenic strategies on defense: on the possibility of blocking rebounds by the tumor vasculature after chemotherapy. Cancer Res. 2007;67(15):7055–7058. [DOI] [PubMed] [Google Scholar]
- 11. Carmeliet P, Jain RK. Angiogenesis in cancer and other diseases. Nature. 2000;407(6801):249–257. [DOI] [PubMed] [Google Scholar]
- 12. Carmeliet P, Tessier-Lavigne M. Common mechanisms of nerve and blood vessel wiring. Nature. 2005;436(7048):193–200. [DOI] [PubMed] [Google Scholar]
- 13. Fischer C, Jonckx B, Mazzone M, et al. Anti-PlGF inhibits growth of VEGF(R)-inhibitor-resistant tumors without affecting healthy vessels. Cell. 2007;131(3):463–475. [DOI] [PubMed] [Google Scholar]
- 14. Hu-Lowe DD, Chen E, Zhang L, et al. Targeting activin receptor-like kinase 1 inhibits angiogenesis and tumorigenesis through a mechanism of action complementary to anti-VEGF therapies. Cancer Res. 2011;71(4):1362–1373. [DOI] [PMC free article] [PubMed] [Google Scholar]
- 15. Park SR, Davis M, Doroshow JH, Kummar S. Safety and feasibility of targeted agent combinations in solid tumours. Nat Rev Clin Oncol. 2013;10(3):154–168. [DOI] [PubMed] [Google Scholar]
- 16. Eikesdal HP, Kalluri R. Drug resistance associated with antiangiogenesis therapy. Semin Cancer Biol. 2009;19(5):310–317. [DOI] [PMC free article] [PubMed] [Google Scholar]
- 17. Bruce JY, Kolesar JM, Hammers H, et al. A phase I pharmacodynamic trial of sequential sunitinib with bevacizumab in patients with renal cell carcinoma and other advanced solid malignancies. Cancer Chemother Pharmacol. 2014;73(3):485–493. [DOI] [PMC free article] [PubMed] [Google Scholar]
- 18. Therasse P, Arbuck SG, Eisenhauer EA, et al. New guidelines to evaluate the response to treatment in solid tumors. European Organization for Research and Treatment of Cancer, National Cancer Institute of the United States, National Cancer Institute of Canada. J Natl Cancer Inst. 2000;92(3):205–216. [DOI] [PubMed] [Google Scholar]
- 19. Lamuraglia M, Escudier B, Chami L, et al. To predict progression-free survival and overall survival in metastatic renal cancer treated with sorafenib: pilot study using dynamic contrast-enhanced Doppler ultrasound. Eur J Cancer. 2006;42(15):2472–2479. [DOI] [PubMed] [Google Scholar]
- 20. Delorme S, Krix M. Contrast-enhanced ultrasound for examining tumor biology. Cancer Imag. 2006;6:148–152. [DOI] [PMC free article] [PubMed] [Google Scholar]
- 21. Guibal A, Taillade L, Mule S, et al. Noninvasive contrast-enhanced US quantitative assessment of tumor microcirculation in a murine model: effect of discontinuing anti-VEGF therapy. Radiology. 2010;254(2):420–429. [DOI] [PubMed] [Google Scholar]
- 22. Rognin NG, Arditi M, Mercier L, et al. Parametric imaging for characterizing focal liver lesions in contrast-enhanced ultrasound. IEEE Trans Ultrason Ferroelectr Freq Control. 2010;57(11):2503–2511. [DOI] [PubMed] [Google Scholar]
- 23. Claudon M, Dietrich CF, Choi BI, et al. Guidelines and good clinical practice recommendations for Contrast Enhanced Ultrasound (CEUS) in the liver—update 2012: A WFUMB-EFSUMB initiative in cooperation with representatives of AFSUMB, AIUM, ASUM, FLAUS and ICUS. Ultrasound Med Biol. 2013;39(1):187–210. [DOI] [PubMed] [Google Scholar]
- 24. Dietrich CF, Averkiou MA, Correas JM, Lassau N, Leen E, Piscaglia F. An EFSUMB introduction into Dynamic Contrast-Enhanced Ultrasound (DCE-US) for quantification of tumour perfusion. Ultraschall Med. 2012;33(4):344–351. [DOI] [PubMed] [Google Scholar]
- 25. Piscaglia F, Nolsoe C, Dietrich CF, et al. The EFSUMB guidelines and recommendations on the clinical practice of Contrast Enhanced Ultrasound (CEUS): update 2011 on non-hepatic applications. Ultraschall Med. 2012;33(1):33–59. [DOI] [PubMed] [Google Scholar]
- 26. Fukasawa M, Matsushita A, Korc M. Neuropilin-1 interacts with integrin beta1 and modulates pancreatic cancer cell growth, survival and invasion. Cancer Biol Ther. 2007;6(8):1173–1180. [DOI] [PubMed] [Google Scholar]
- 27. Carlomagno F, Anaganti S, Guida T, et al. BAY 43-9006 inhibition of oncogenic RET mutants. J Natl Cancer Inst. 2006;98(5):326–334. [DOI] [PubMed] [Google Scholar]
- 28. Holash J, Davis S, Papadopoulos N, et al. VEGF-Trap: a VEGF blocker with potent antitumor effects. Proc Natl Acad Sci USA. 2002;99:11393–11398. [DOI] [PMC free article] [PubMed] [Google Scholar]
- 29. Llovet JM, Ricci S, Mazzaferro V, et al. Sorafenib in advanced hepatocellular carcinoma. N Engl J Med. 2008;359(4):378–390. [DOI] [PubMed] [Google Scholar]
- 30. Wilhelm SM, Carter C, Tang L, et al. BAY 43-9006 exhibits broad spectrum oral antitumor activity and targets the RAF/MEK/ERK pathway and receptor tyrosine kinases involved in tumor progression and angiogenesis. Cancer Res. 2004;64(19):7099–7109. [DOI] [PubMed] [Google Scholar]
- 31. Arditi M, Frinking PJ, Zhou X, Rognin NG. A new formalism for the quantification of tissue perfusion by the destruction-replenishment method in contrast ultrasound imaging. IEEE Trans Ultrason Ferroelectr Freq Control. 2006;53(6):1118–1129. [DOI] [PubMed] [Google Scholar]
- 32. Barrois G, Coron A, Payen T, Dizeux A, Bridal L. A multiplicative model for improving microvascular flow estimation in dynamic contrast-enhanced ultrasound (DCE-US): theory and experimental validation. IEEE Trans Ultrason Ferroelectr Freq Control. 2013;60(11):2284–2294. [DOI] [PubMed] [Google Scholar]
- 33. Eikesdal HP, Sugimoto H, Birrane G, et al. Identification of amino acids essential for the antiangiogenic activity of tumstatin and its use in combination antitumor activity. Proc Natl Acad Sci USA. 2008;105(39):15040–15045. [DOI] [PMC free article] [PubMed] [Google Scholar]
- 34. Moreno GV, Basu B, Molife LR, Kaye SB. Combining antiangiogenics to overcome resistance: rationale and clinical experience. Clin Cancer Res. 2012;18(14):3750–3761. [DOI] [PubMed] [Google Scholar]


