Abstract
Introduction:
Myotonic dystrophy type 1 (DM1) is a multisystemic disease caused by expansion of a CTG repeat in the 3’ UTR of the Dystrophia Myotonica-Protein Kinase (DMPK) gene. While multiple organs are affected, more than half of mortality is due to muscle wasting.
Methods:
It is unclear whether endurance exercise provides beneficial effects in DM1. Here, we show that a 10-week treadmill endurance exercise program leads to beneficial effects in the HSALR mouse model of DM1.
Results:
Animals that performed treadmill training displayed reduced CUGexp RNA levels, improved splicing abnormalities, an increase in skeletal muscle weight and improved endurance capacity.
Discussion:
These results indicate that endurance exercise does not have adverse effects in HSALR animals and contributes to beneficial molecular and physiological outcomes.
Keywords: endurance exercise, mouse model, myotonic dystrophy type I, skeletal muscle, splicing, treadmill
1 |. INTRODUCTION
Myotonic dystrophy type 1 (DM1) is an autosomal dominant neuromuscular disorder and is the most common form of muscular dystrophy in adults.1–3 While DM1 is a multi-systemic disorder significantly affecting cardiac muscle, brain and other tissues, a primary cause of mortality is due to skeletal muscle weakness and wasting of respiratory muscles.4–9 Weakness typically begins in distal muscles, leading to impaired ambulation, and difficulty with fine motor tasks and is a top concern among individuals affected by DM1.10,11 The mechanisms leading to wasting remain unknown and there are no available interventions to halt or reverse this wasting, highlighting a critical unmet clinical need.
DM1 is caused by a toxic gain-of-function RNA resulting from a CTG trinucleotide repeat expansion in the 3’ UTR of the Dystrophia Myotonica-Protein Kinase (DMPK) gene.12 The RNA produced (CUGexp RNA) from the expanded repeat contains CUG repeats that aggregate into nuclear foci and perturb the functions of RNA binding proteins (RBPs).13,14 Many of the perturbed RBPs antagonistically regulate a network of alternative splicing and other RNA processing mechanisms during development, leading to widespread misregulation of alternative splicing as being a key feature of the DM1.15–24 Disruption of specific developmentally regulated alternative splicing events have been directly linked to DM1 symptoms.25 Mis-splicing of the CLCN1 chloride channel in skeletal muscles, for example, results in myotonia (delayed muscle relaxation after initial contraction).26–29
There is limited literature available to evaluate the effect of exercise in individuals with myotonic dystrophy. Results from previous studies have ranged from no change from baseline to some improvement in strength and function.30–35 While informative, many prior studies have involved small numbers of subjects, and exercise regimens varied, leading to uncertainty as to which activities to recommend to patients with DM1. As highlighted in a recent comprehensive review,35 this question may be better addressed by improving our understanding of the exercise-induced molecular changes that occur in DM1 biology which are often more readily addressed in animal model studies.
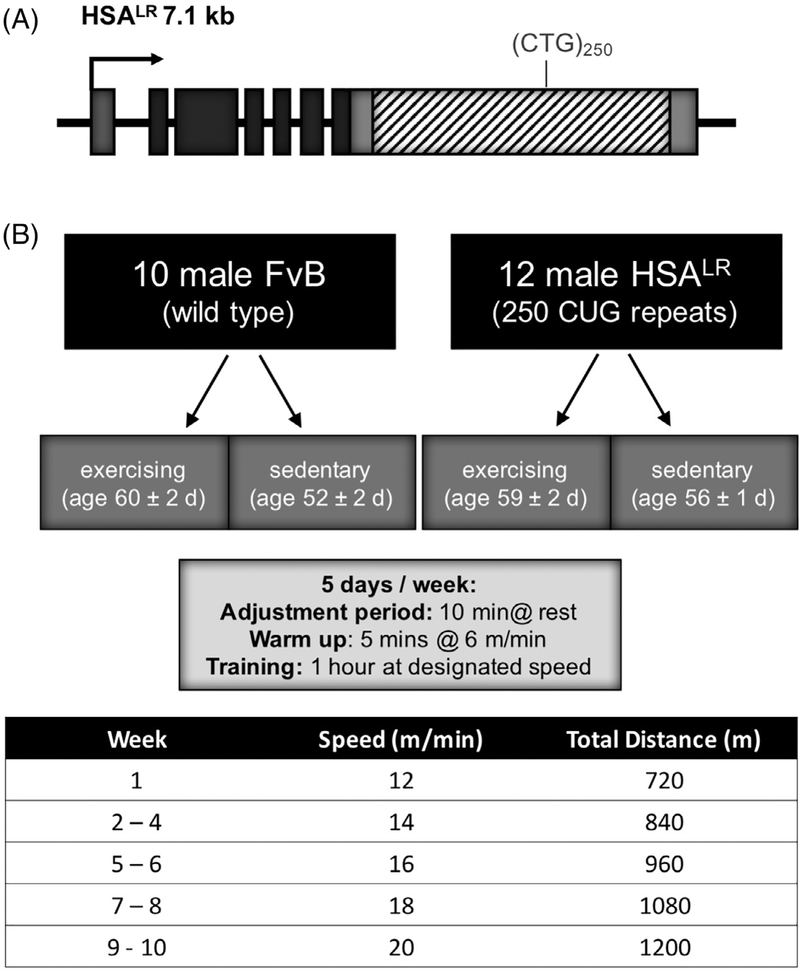
Transgenic mouse models have been developed to investigate the pathogenic effect of the repeat containing RNA. Mankodi et al. generated a transgenic line (HSALR mice) containing the human skeletal alpha actin gene with 250 CTG repeats inserted into the 3’ UTR to express CUGexp RNA specifically in skeletal muscle (Figure 1A).36 HSALR mice accumulate nuclear RNA foci, show Muscleblind-like (Mbnl) sequestration, develop myotonia, and mild-to-moderate myopathy, whereas those expressing a transgene containing short repeats do not.36 To determine the molecular consequences and whether endurance exercise would provide beneficial or harmful effects in skeletal muscle expressing CUGexp RNA, we tested the consequences of a 10-week treadmill training program in the HSALR repeat mouse model.
FIGURE 1.
HSALR mice were subjected to endurance exercise training. A, The transgene for HSALR mice contains a genomic segment of the HSA gene with an expanded CTG trinucleotide repeat (250 repeats) inserted into the 3’- UTR of the last exon. B, Adult HSALR (FvB) or age-matched WT FvB mice were randomly assigned to sedentary or exercised groups. The 10-week exercise protocol is outlined. Muscle was harvested at the conclusion of week 10 for muscle weights, histology, and molecular analysis (repeat RNA levels, splicing, MBNL levels)
2 |. METHODS
2.1 |. Transgenic mice
HSALR transgenic mice were developed previously by Mankodi et al. in a FvB/N background.36 The transgene contains the human skeletal muscle alpha actin (ACTA1) gene with 250 CTG repeats inserted into the 3’UTR of the last exon. Expression of the repeat RNA is restricted to skeletal muscle. A single cohort of male animals homozygous for the HSALR transgene or age-matched male nontransgenic FvB controls (referred to as wild-type [WT]) were used for the entirety of the study (Figure 1). All animals were 52–61 days of age at the start of the study (WT spread: 52–61 days, HSALR: 56–60 days). Age-matched sedentary HSALR animals serve as the control to determine the response of HSALR transgenic animals to endurance exercise as opposed to WT animals subjected to the same training. Each group contains 5 animals with the exception of the HSALR exercised group which contains 6. Muscle was harvested at the conclusion of week 10 for muscle weights, histology, and molecular analysis (repeat RNA levels, splicing, MBNL levels). All experiments involving mice were conducted in accordance with the NIH Guide for the Use and Care of Laboratory Animals and approved by the Baylor College of Medicine Institutional Animal Care and Use Committee.
2.2 |. Treadmill and grip strength
HSALR and WT mice were split into either sedentary or exercise groups. Exercise groups completed a treadmill exercise training protocol 5 days per week at a 15-degree incline. Animals were placed in the treadmill at rest for 10 min to acclimate followed by 5 min at 6 m/min and then put through a progressive endurance training protocol. In week 1, animals ran at 12 m/min, 720 m total distance; weeks 2–4, 14 m/min, 840 m total distance; weeks 5 and 6, 16 m/min, 980 m total distance; week 7 and 8, 18 m/min, 1080 m total and weeks 9 and 10, animals ran at 20 m/min, totaling 1200 m. Maximum distance run on exhaustive treadmill was measured at weeks 1 and 10 and was determined after 10 min of acclimation at a speed of 6 m/min. The speed was increased by 2 m/min every 2 min until exhaustion defined as the mouse stepping off of the treadmill and standing on an electric shock grid for 5 s. A grip strength meter (Columbus Instruments, Columbus, OH) was used to measure forelimb and all limb grip strength at weeks 1 and 10. As the mouse grasped the bar, the peak pull force in grams was recorded on a digital force transducer. Grip force was standardized to body weight.
2.3 |. Muscle and body weight
Skeletal muscle weight was measured and normalized to tibia length. Body weight of each animal was measured weekly.
2.4 |. Body fat and bone mineral density
Body fat and bone mineral density were determined by dual x-ray absorption using the Lunar PIXImus Mouse Densitometer (General Electric, New York, NY). Mice were immobilized with 2% isoflurane, placed prone on a disposable measuring tray, and body composition from the tip of the nose to the base of the tail was determined by means of the PIXImus software. Measurements were collected at the start of the study (start of week 1), midway through (end of week 5) and at the conclusion of the training protocol (end of week 10).
2.5 |. Maximal oxidative capacity measurements
Maximum oxidative capacity was measured during exhaustive exercise testing. Mice were placed in an enclosed treadmill and the speed was increased incrementally until exhaustion. The Oxymax indirect calorimeter (Columbus Instruments, Columbus, OH) was used to calculate oxygen consumption at 1-min intervals during exercise testing.
2.6 |. RNA isolation and reverse transcriptase polymerase chain reaction
Total RNA was isolated from individual skeletal muscles at the conclusion of the 10-week study using TRIzol reagent (Invitrogen, Waltham, MA) in a Bullet Blender (Next Advance, Troy, NY). cDNA was prepared using the High-Capacity cDNA Reverse Transcription Kit (Applied Biosystems, Waltman MA). Reverse transcriptase polymerase chain reaction (RT-PCR) was performed using amfiSure Ultra Fidelity PCR Master Mix (Gendepot, Katy, TX). Primers in exons 5 and 6 of hACTA1 were used to measure transgene expression levels normalized to Gapdh. Primers in exons 6/7 and exon 8 of mActa1 were used to measure levels of endogenous actin normalized to Gapdh. Primers for analysis of alternative splicing events (Supporting Information Table S1) were designed to anneal to flanking constitutive exons. PCR products were separated on a native 5% polyacrylamide gel and imaged using a E1 Logic 2200 imaging system (Kodak, Rochester, NY). Percent spliced in (PSI) was calculated after adjusting for ethidium bromide staining as (intensity of top band/intensity of both bands) × 100. PSI quantitates the percent of the mRNA from the gene that contains the alternative exon.
2.7 |. Protein isolation and Western blot
Total protein was isolated from skeletal muscles using a HEPES-sucrose lysis buffer (0.75 M HEPES, cOmplete™EDTA-free Protease Inhibitor Cocktail (Roche, Indianapolis, IN), 1.0 M sucrose, 0.5 M ethylenediamin- etetraacetic acid [EDTA]). Protein samples were separated on a 10% Tris-glycine sodium dodecyl sulfate polyacrylamide gel electrophoresis gel and transferred to 0.45 μm Immobilon-P polyvinylidene fluoride membranes (MilliporeSigma, Burlington, MA). Membranes were stained with Ponceau S before immunoblotting to visualize total protein and incubated with primary antibody in 5% milk/PBST (phosphate buffered saline and 0.1% Tween-20, Sigma, St. Louis, MO) overnight at 4°C. Antibodies: MBNL1: in-house rabbit polyclonal (1:1000), MBNL2: 3B4 mouse monoclonal (1:1000, sc-136167, Santa Cruz, Dallas, TX). Membranes were washed in PBST and incubated with secondary antibody in 5% milk/PBST for 1 h at room temperate (horseradish peroxidase [HRP]-conjugated goat anti-rabbit (1:5000, Invitrogen, Waltham, MA) or goat anti-mouse (1:3000, light-chain specific, (115–035-174), Jackson Immunoresearch, West Grove, PA.) Immunoreactivity was detected using West Pico HRP-chemiluminescence (Thermo Scientific, Waltham, MA) and Immobilon Western Chemiluminescent HRP Substrate (MilliporeSigma, Burlington, MA). Membranes were imaged on a ChemiDoc XRS+ Imaging system (BioRad, Hercules, CA) and processed in ImageJ (NIH, Bethesda, MD). Protein signal was measured by densitometry using the ImageJ Gel Analysis tool. Background was subtracted for each band and band intensity normalized to total protein (target protein signal for each sample divided by the sum of data obtained for that sample) using total protein staining as measured by Coomassie.
2.8 |. Statistical analysis
All data was presented as mean ± standard deviation. One-way analysis of variance (ANOVA), two-way ANOVA, or unpaired t-test were used to compare means between experimental groups, as appropriate and indicated in figure legends.
3 |. RESULTS
3.1 |. CUGexp RNA levels are reduced in HSALR skeletal muscle following endurance exercise training
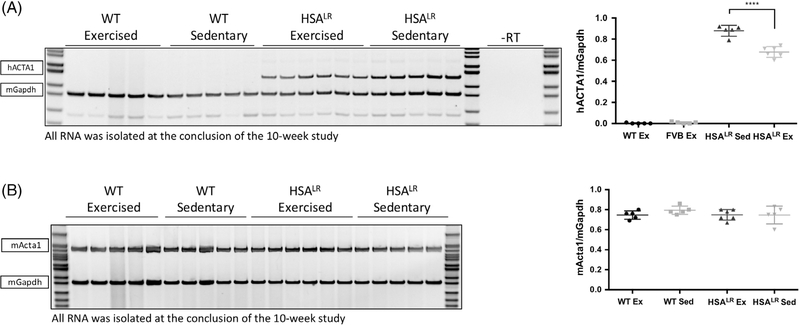
Age-matched sedentary HSALR animals serve as the control to determine the response of HSALR transgenic animals to endurance exercise as opposed to WT animals subjected to the same training. Animals in the exercise group were maintained on a 10-week treadmill exercise training protocol 5 days per week as indicated in Figure 1B and described in the Methods. Following completion of the 10-week endurance exercise protocol, skeletal muscle tissue was isolated for molecular analysis. We used RT-PCR to determine whether there was a difference in the level of transgene CUGexp RNA in the HSALR animals. Total RNA was extracted at the conclusion of the 10-week study from exercised and sedentary gastrocnemius muscle and RT-PCR was performed using primers in exons 5 and 6 of hACTA1 (located upstream of repeats within the mRNA) and transgene mRNA levels were normalized to Gapdh. We consistently observed a significant decrease (> 20%) in the levels of hACTA1 repeat mRNA in the HSALR exercised group in comparison to sedentary animals (Figure 2A). As expected, WT animals do not show the presence of hACTA1 as the WT animals do not have the HSALR transgene. No difference in endogenous mActa1 was observed (Figure 2B) indicating that decreased CUGexp RNA is not a generalized response of the actin promoter or actin mRNA stability to exercise but rather is a specific reduction in the levels of the pathogenic CUGexp RNA.
FIGURE 2.
HSALR exercised animals display a significant decrease in CUGexp RNA levels. Total RNA was extracted from gastrocnemius muscle of adult male animals, either homozygous for the HSALR transgene or age-matched male nontransgenic WT controls. Animals in the exercise group were maintained on a 10-week treadmill exercise training protocol 5 days per week as indicated in Figure 1B. All RNA was extracted at the conclusion of the 10-week study. RT-PCR was performed using primers in exons 5 and 6 of hACTA1 (upstream of repeats) (A) or exons 6/7 and exon 8 of mActa1 (B), and normalized to Gapdh. The primer pairs are specific for the human or mouse ACTA1/Acta1 gene. n = 5 per group (n = 6 for HSALR exercised). Statistical analysis was conducted by one-way ANOVA. Post-hoc analysis was performed using Tukey’s HSD correction. Error bars indicate ± SD. ****P < 0.0001
3.2 |. HSALR exercised animals show a reversion in a subset of alternative splicing events
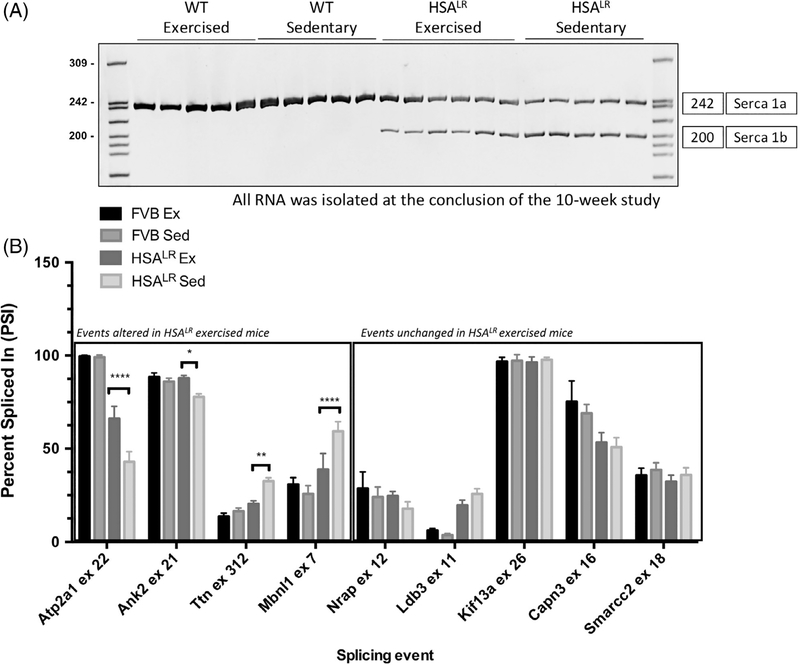
CUGexp RNA in DM1 tissues leads to the mis-regulation of alternative splicing due to disrupted functions of several RNA binding proteins.17,37 RT-PCR was used to quantify alternative splicing events previously shown to be misregulated in HSALR animals and DM1 skeletal muscle. RT-PCR was performed on total RNA extracted from gastrocnemius muscle at the conclusion of the 10-week study using primers flanking the alternative exons. Percent Spliced In (PSI) was calculated to determine the percent of the mRNA from the gene that contains the alternative exon, quantified as (intensity of top band/intensity of both bands) × 100. We found that several alternative splicing events in HSALR animals displayed a transition toward the WT adult splicing pattern following endurance exercise (Figure 3A,B). These splicing events were not affected in exercised WT animals demonstrating effects specific to muscle expressing CUGexp RNA. We observed a dramatic transition in the splicing pattern of Atp2a1 in exercised HSALR animals toward the normal splicing pattern as compared to HSALR sedentary animals (Figure 3A), with PSI values of 66 and 43, respectively. Similarly, the splicing pattern of Ank2 exon 21 fully reverted to the normal pattern and Ttn exon 312, and Mbnl1 exon 7 partially reverted toward the normal adult splicing pattern in exercised animals. Other splicing events (Ldb3 (Zasp) exon 11 and Capn 3 exon 16) were not affected. These results are consistent with reduced expression of CUGexp RNA demonstrated in Figure 2 as a reduction in CUGexp RNA would be expected to lead to decreased disruption of RNA binding proteins and, therefore, fewer aberrant alternative splicing changes.
FIGURE 3.
HSALR exercised animals display significant changes in alternative splicing. Total RNA was extracted from gastrocnemius muscle at the conclusion of the 10-week study. Standard RT-PCR was performed using primers to the constitutive exons flanking the alternative exons. Ratios of exon inclusion were quantified as: [intensity of top exon inclusion band/ (intensity of the top + bottom exon skipping band]) × 100, displayed as PSI. A, Representative RT-PCR of Atp2a1 exon 22 alternative splicing event illustrating decreased exon inclusion in HSALR sedentary animals in comparison to FVB controls. A dramatic transition in the splicing pattern of Atp2a1 was observed in exercised HSALR animals toward the WT adult splicing pattern as compared to HSALR sedentary animals. B, Quantification of alternative splicing events showing a transition in several splicing events in HSALR exercised animals (n = 5 per group, n = 6 for HSALR exercised). Statistical analysis was conducted with two-way ANOVA. Post-hoc analysis was performed using Tukey’s HSD correction. Error bars indicate ± SD. *P < .05, **P < .01, ****P < .0001
3.3 |. HSALR but not WT animals display a significant increase in muscle weight in response to exercise
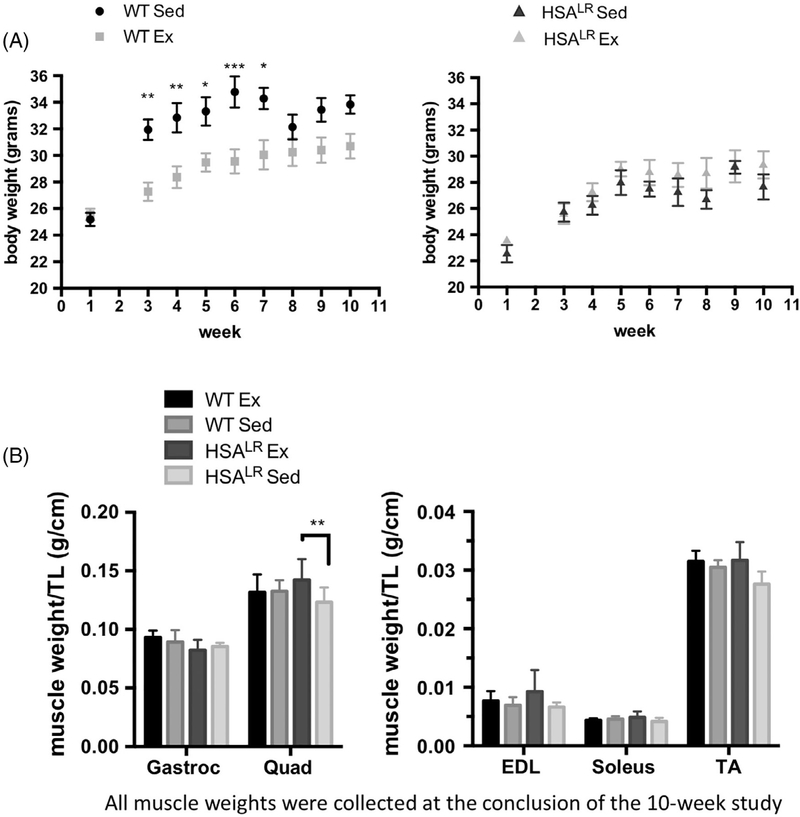
We measured total body weight of each animal throughout the course of the study as well as the weight of several skeletal muscles at the conclusion of week 10 (Figure 4). WT sedentary animals show a consistent increase in body weight throughout the course of the study (Figure 4A). In contrast, HSALR exercised and sedentary animals displayed comparable body weights throughout the entire 10-week study (Figure 4A). This observation indicates that HSALR sedentary animals do not gain weight at the same rate as WT sedentary animals. Importantly, we did not observe additional weight loss in the HSALR exercised animals relative to HSALR sedentary animals that could indicate muscle damage.
FIGURE 4.
HSALR exercised animals display an increase in muscle weight with no changes in body weight. Adult WT male FvB or HSALR were subjected to either no exercise or treadmill training for a period of 10 weeks. A, Body weight was measured throughout the time course. B, Muscle weights were measured at the conclusion of week 10 and normalized to tibia length. Mean for the group ± SD is displayed for each time point. Statistical analysis was conducted with two-way ANOVA. Post-hoc analysis was performed using Tukey’s HSD correction. Error bars indicate ± SD. *P < .05, **P < .01, ***P < .001
Of the five skeletal muscles examined, there were no significant differences in muscle mass between the WT sedentary and WT exercised groups at the conclusion of the study. In contrast, a significant increase in quadriceps muscle weight (~13%) was observed in HSALR exercised animals as compared to the HSALR sedentary group (Figure 4B). An increase was also observed in both the tibialis anterior and the extensor digitorum longus muscle but did not reach significance. The gastrocnemius and soleus muscles did not show any apparent differences in muscle weight.
We also examined skeletal muscle cross sections by hematoxylin and eosin staining. HSALR sedentary animals show scattered histological changes typically observed in dystrophic muscle, such as variability in myofiber size and centralized myonuclei, although overt muscle damage is not observed in this particular group of animals (Supporting Information Figure S1).36 Importantly, exercised HSALR muscle did not show differences in histology that would indicate muscle damage (Supporting Information Figure S1).
Taken together, these results indicate that the endurance exercise protocol is not detrimental to the HSALR animals based on results from muscle weight and histology analysis.
3.4 |. Exercised animals from both groups display a decrease in percentage body fat
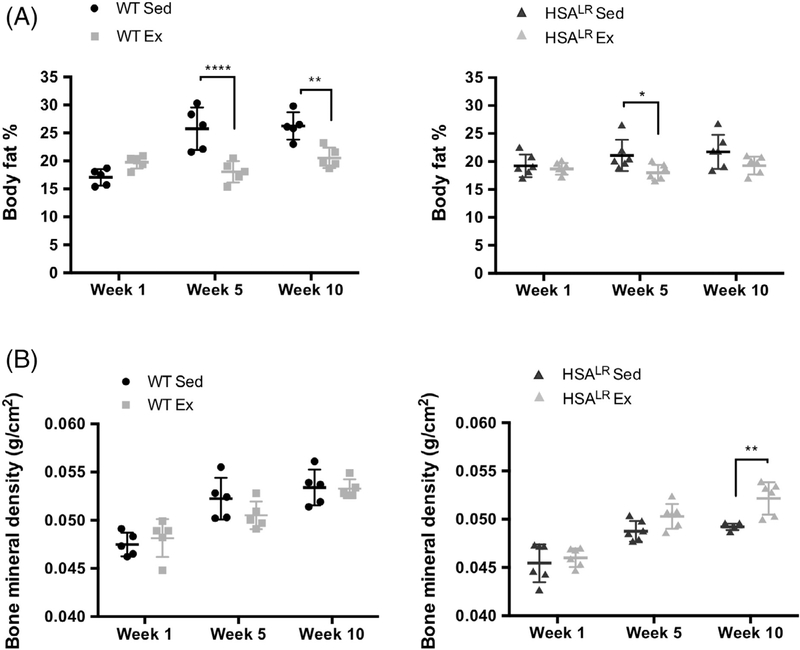
To determine the systemic response of HSALR animals to endurance exercise, we examined percent total body fat (Figure 5A). Total body fat was measured at the start of the study (start of week 1), midway through (end of week 5) and at the conclusion of the training protocol (end of week 10). All four groups had comparable average percent body fat at week 1 (Figure 5A). We observed a reduction in body fat in both the WT and HSALR exercised groups at week 5 compared with sedentary animals of the same genotype indicating that exercise reduces body fat in HSALR animals as well as WT animals.
FIGURE 5.
Exercised animals display significant decreases in body fat in HSALR and WT animals. Body fat percentage (A) and bone mineral density (B) was measured at the start of the study (start of week 1), midway through (end of week 5), and at the conclusion of the training protocol (end of week 10). Individual data points displayed with mean ± SD. Statistical analysis was conducted with two-way ANOVA. Post-hoc analysis was performed using Tukey’s HSD correction. *P < .05, **P < .01, ****p < .0001
Of interest, the total percent body fat of HSALR sedentary animals does not reach the level of the WT sedentary animals (21.7% and 26% at week 10, respectively) likely explaining the observed differences in body weight illustrated in Figure 4. In addition, the percent body fat of HSALR exercised vs sedentary animals did not reach significance at week 10 because HSALR sedentary animals appear to not gain fat comparable to WT sedentary animals.
Bone mineral density measured at weeks 1, 5, and 10 slightly increased in all four groups with age with a significant increase in the HSALR exercised group compared with HSALR sedentary animals by week 10 (Figure 5B). The WT sedentary and exercised animals displayed no differences in bone mineral density at any time point.
3.5 |. Exercised animals from both groups display improved endurance and maximal oxidative capacity
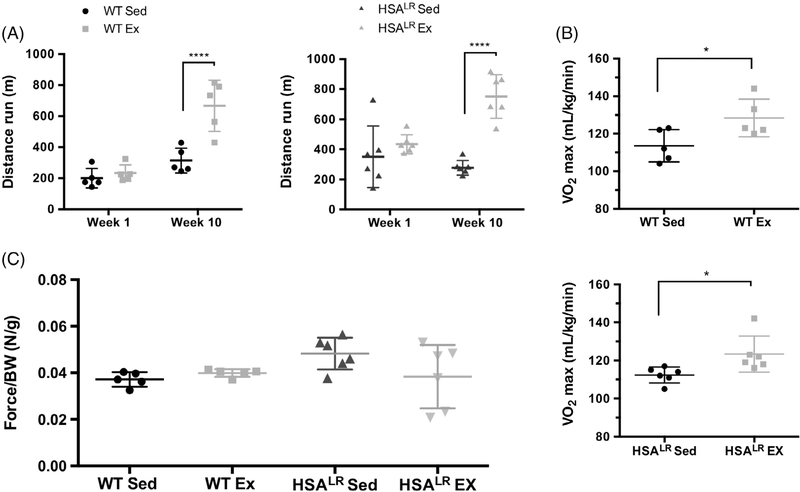
To determine the effect of the treadmill exercise training protocol on endurance we measured the distance run on exhaustive treadmill at weeks 1 and 10. Compared with sedentary animals, both WT and HSALR exercised animals exhibited a significant increase in the maximum distance run at week 10. WT exercised animals ran 2.1 times further than the WT sedentary group (666 m vs 314 m) while the HSALR exercised animals ran 2.7 times further than the HSALR sedentary group (751 m vs 277 m) (Figure 6A). The goal of the experiment was to determine whether HSALR transgenic mice respond to endurance exercise training.
FIGURE 6.
Exercised animals from HSALR or WT display significant changes in the distance run on exhaustive treadmill with no significant changes in grip strength. A, Maximum distance run on exhaustive treadmill was measured at the start of week 1 and the conclusion of week 10 with exercised animals displaying an increased time until exhaustion in both groups. B, VO2max was measured with exercised animals from both groups displaying a comparable increase in VO2max. C, Grip strength of front limbs measured at the conclusion of week 10 normalized to body weight shows no statistically significant changes in force although there is variability among HSALR exercised animals. We did observe two HSALR animals with substantially reduced grip strength. Statistical analysis was conducted by two-way ANOVA followed by Tukey’s HSD correction (A) or Kruskal-Wallis test (C). Error bars indicate ±SD. ****P < .0001
We also measured the maximal oxidative capacity of each group at the conclusion of the 10-week study (Figure 6B) to determine the effects of endurance exercise on respiratory and cardiac function in WT and HSALR animals (note that HSALR animals express CUGexp RNA only in skeletal muscle). We found that both the WT and HSALR exercised groups showed a similar increase in the maximal oxygen uptake (VO2max). Together these results indicate that in the HSALR mouse model of DM1, endurance exercise does in fact improve the endurance of these animals similar to WT animals and could help to prevent the decline in their endurance capacity.
Grip strength of these animals normalized to body weight was also measured as a readout of muscle strength (Figure 6C). There were no significant differences in grip strength between any of the four groups at week 10. Although there was not a significant decrease in grip strength of the HSALR exercised animals as a group, we did observe two HSALR animals with substantially reduced grip strength.
3.6 |. HSALR exercised animals display no significant differences in MBNL protein levels
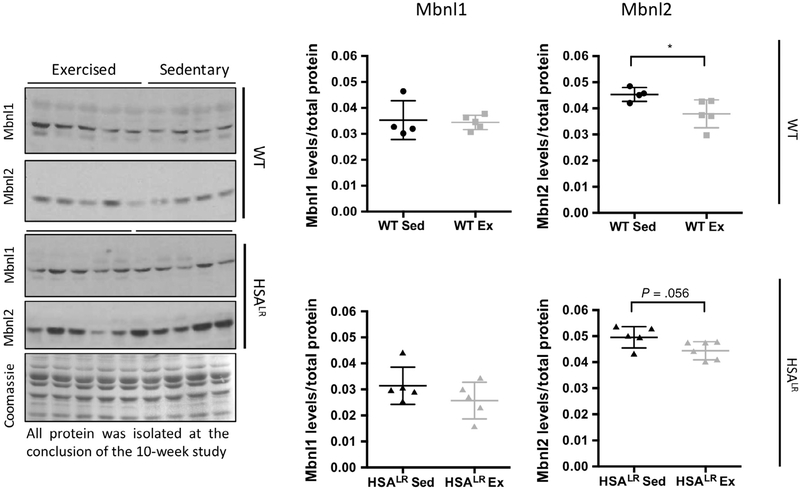
CUGexp RNA sequesters the MBNL family of RNA binding proteins producing a loss of function leading to RNA processing abnormalities that result in disease features.38 We observed a significant reduction in the levels of CUGexp RNA as well as significant reversion of aberrant splicing in the HSALR endurance exercised mice. To determine whether there were also differences in Mbnl protein levels in response to endurance exercise, western blots were used to quantify Mbnl1 and Mbnl2 protein levels in sedentary and exercised mice (Figure 7). Mbnl1 protein levels did not differ between exercised animals and sedentary controls. However, we did observe a slight decrease in Mbnl2 protein levels in WT exercised animals and the same trend in the HSALR animals. These results suggest that Mbnl2 protein levels may be sensitive to exercise, however, the reduced level of Mbnl2 is not sufficient to affect splicing of Mbnl targets in exercised WT mice (Figure 3).
FIGURE 7.
Exercised animals display a decrease in Mbnl2 protein levels. Total protein was isolated from gastrocnemius muscle at the conclusion of the 10-week study. Protein levels of Mbnl1 and Mbnl2 were detected by Western blot and normalized to total protein as determined by Coomassie (representative Coomassie shown). Statistical analysis was conducted using an unpaired t-test. Error bars indicate ± SD. *P < .05
4 |. DISCUSSION
We characterized the impact of endurance exercise in the HSALR mouse model of DM1 and demonstrate that following a 10-week treadmill training regimen, DM1 mice exhibit beneficial changes at both the molecular and phenotypic level. A main finding of this study is the decrease in CUGexp RNA in response to treadmill training with an associated rescue of alternative splicing defects in the HSALR DM1 mouse model. Splicing changes have been used as biomarkers that correlate with muscle weakness in affected individuals demonstrating their relevance to disease.25 The mechanism for correction in alternative splicing following endurance exercise is most likely a consequence of the reduction in CUGexp RNA. The mechanism for reduced CUGexp RNA remains unknown. The level of endogenous skeletal alpha actin mRNA was not affected in exercised muscle indicating that the loss of CUGexp RNA is not due to effects on the actin promoter (that is driving expression of the transgene) or actin mRNA stability. It is likely that exercise reduces CUGexp RNA at the level of the RNA by increased degradation.
To help understand the variability in DM1 transcriptome alterations, investigators have recently generated 120 RNA-Seq transcriptomes from heart and skeletal muscle derived from healthy and DM1 biopsies and autopsies.39 Alternative splicing and gene expression analysis was performed by Wang and colleagues and the results confirmed tissue-specific changes in RNA processing and identified transcriptome changes that strongly correlate with muscle strength, further highlighting the important contribution of splicing misregulation to DM1 disease progression.39 In the present study, we found that several alternative splicing events typically misregulated in HSALR animals displayed a transition toward the WT adult splicing pattern following endurance exercise (Figure 3). For example, in DM1 aberrant splicing of ATP2A1 (SERCA1) exon 22 is consistently observed in skeletal muscle of both DM1 patients and HSALR mice and is proposed to contribute to muscle wasting through disruption of Ca2+ homeostasis.40,41
Following endurance training of HSALR animals, we observed a splicing rescue of Atp2a1 exon 22 to approximately 67% the level of WT animals. We also observed splicing rescue of the cytoskeletal protein titin (Ttn), which has been previously shown to belong to a group of splicing events that typically displays early splicing misregulation in response to CUGexp RNA.25 However, not all splicing events tested were improved by exercise most likely reflecting the different responsiveness of individual splicing events to changes in MBNL availability. Previous work from Wagner et al. demonstrated different sensitivities of splicing events to MBNL perturbation.16 Of the 46 splicing events analyzed by Wagner et al. in the tibialis anterior muscle of individuals affected by DM1, Atp2a1 is one of the most sensitive events. Our results showing a transition in the Atp2a1 splicing pattern are indicative of changes in the amount of free Mbnl, whereas a less sensitive event (such as Ldb3 (Zasp) exon 11) would require a more dramatic shift in Mbnl sequestration to elicit a significant change in the splicing pattern.
Although there was not a significant decrease in grip strength of the HSALR exercised animals, we did observe two HSALR animals with substantially reduced grip strength. Because these animals were on an endurance exercise protocol and not a resistance exercise regime it would be valuable to determine whether addition of resistance exercise would lead to an increase in muscle strength as an endurance exercise regime increased endurance capacity in these animals.
We measured the total percent body fat in exercised and sedentary animals from control and transgenic groups to determine the systemic response of HSALR animals to endurance exercise. Our results indicate potential unrecognized metabolic differences associated with skeletal muscle in HSALR mice. In comparison to WT mice, sedentary HSALR mice did not gain as much total body weight during the 10-week study and the weights of sedentary and exercised HSALR mice remained the same. This difference can be explained in part by the differences in percent body fat between the WT control and HSALR groups. HSALR sedentary animals maintain a similar level of body fat for the entire 10 weeks while the WT sedentary group shows a dramatic increase with age by week 5. HSALR exercised animals also display an increase in skeletal muscle weight, such as a significant 13% increase in quadriceps muscle. While an increase in mass of appendicular muscles may initially seem surprising as traditionally endurance training would not necessarily be expected to increase appendicular muscle mass in a healthy population, this result is in agreement with human studies in which 12 DM1 patients who participated in a 12-week cycle ergometer exercise program displayed muscle hypertrophy, a finding not observed in healthy controls.31 The fact that HSALR sedentary animals do not accumulate fat at the same rate as age-matched WT animals, and HSALR mice also display an increase in bone mineral density and quadriceps muscle weight following treadmill exercise, reveals a potential area of future investigation into possible differences in metabolism in animals the express CUGexp RNA exclusively in skeletal muscle.
While previous human studies have aimed to understand the effects of endurance exercise on DM1 muscle, small numbers of patients and a lack of uniform exercise regimen have led to varied conclusions.30–35 Moreover, DM1 is extremely heterogeneous with regard to severity and disease onset, therefore, addressing this question in animal models helps to control for variability and derive an answer with more insight at the molecular level. Our results indicate that in the HSALR mouse model of DM1, endurance exercise is safe and has beneficial effects at both the molecular and phenotypic level. Our results validate and extend those from a recent study supporting the beneficial effects in exercised HSALR mice.42 Further exploration of the molecular mechanisms by which endurance exercise can elicit these alterations is merited. Ultimately, improved understanding of exercise-induced changes in DM1 biology will allow development of more effective lifestyle and/or pharmacological interventions to ultimately lead to an improved quality of life among the DM1 community.
Supplementary Material
ACKNOWLEDGMENTS
The authors thank Dr. Corey Reynolds, PhD, of the Mouse Metabolic and Phenotyping Core at BCM for use of Piximus for body composition and treadmill indirect calorimetry (NIH UM1HG006348, NIH R01DK114356).
Funding information
National Heart, Lung, and Blood Institute, Grant/Award Number: R01HL045565; National Institute of Arthritis and Musculoskeletal and Skin Diseases, Grant/Award Numbers: 1F31AR073088, R01AR045653, R01AR060733
Abbreviations:
- ANOVA
analysis of variance
- CUGexp RNA
RNA containing expanded CUG repeats
- DM1
myotonic dystrophy type 1
- EDTA
ethylenediaminetetraacetic acid
- HSA
human alpa-skeletal actin
- HRP
horseradish peroxidase
- HSALR
human alpha-skeletal actin gene containing 250 CTG repeats in the 3’ UTR; HSD, honestly significant difference
- Mbnl
, muscleblind-like (RNA binding protein)
- PBST
phosphate buffered saline and 0.1% Tween-20
- PSI
percent spliced in (quantitates the percent of the mRNA from the gene that contains the alternative exon)
- UTR
untranslated region; VO2max, maximal oxygen uptake
- VO2max
maximal oxygen uptake
- WT
wild-type.
Footnotes
CONFLICT OF INTEREST
None of the authors has any conflict of interest to disclose.
ETHICAL PUBLICATION STATEMENT
We confirm that we have read the Journal’s position on issues involved in ethical publication and affirm that this report is consistent with those guidelines.
NOTE ADDED IN PROOF
Consistent with our results, Ravel-Chapuis et. al. showed improved splicing in HSA (LR) muscle with voluntary exercise. Hum. Molec. Genet. 27, 3361.
SUPPORTING INFORMATION
Additional supporting information may be found online in the Supporting Information section at the end of this article.
REFERENCES
- 1.Suominen T, Bachinski LL, Auvinen S, et al. Population frequency of myotonic dystrophy: higher than expected frequency of myotonic dystrophy type 2 (DM2) mutation in Finland. Eur J Hum Genet. 2011; 19:776–782. [DOI] [PMC free article] [PubMed] [Google Scholar]
- 2.Norwood FL, Harling C, Chinnery PF, Eagle M, Bushby K, Straub V. Prevalence of genetic muscle disease in Northern England: in-depth analysis of a muscle clinic population. Brain. 2009;132:3175–3186. [DOI] [PMC free article] [PubMed] [Google Scholar]
- 3.Chau A, Kalsotra A. Developmental insights into the pathology of and therapeutic strategies for DM1: back to the basics. Dev Dyn. 2014; 244:377–390. [DOI] [PubMed] [Google Scholar]
- 4.Thornton CA. Myotonic dystrophy. Neurol Clin. 2015;32:705–719. [DOI] [PMC free article] [PubMed] [Google Scholar]
- 5.Turner C, Hilton-Jones D. Myotonic dystrophy: diagnosis, management and new therapies. Curr Opin Neurol. 2014;27:599–606. [DOI] [PubMed] [Google Scholar]
- 6.de Evangelista MA, Dias FA, Júnior ME, et al. Noninvasive assessment of respiratory muscle strength and activity in myotonic dystrophy. PLoS One. 2017;12:e0177318. [DOI] [PMC free article] [PubMed] [Google Scholar]
- 7.Heatwole C, Bode R, Johnson N, et al. Myotonic dystrophy health index: initial evaluation of a disease-specific outcome measure. Muscle Nerve. 2014;49:906–914. [DOI] [PMC free article] [PubMed] [Google Scholar]
- 8.Mauro A, Aliverti A. Physiology of respiratory disturbances in muscular dystrophies. Breathe (Sheff). 2016;12:318–327. [DOI] [PMC free article] [PubMed] [Google Scholar]
- 9.Serisier DE, Mastaglia FL, Gibson GJ. Respiratory muscle function and ventilatory control. I in patients with motor neurone disease. II in patients with myotonic dystrophy. Q J Med. 1982;202:205–226. [PubMed] [Google Scholar]
- 10.Heatwole C, Bode R, Johnson N, et al. Patient-reported impact of symptoms in myotonic dystrophy type 1 (PRISM-1). Neurology. 2012; 79:348–357. [DOI] [PMC free article] [PubMed] [Google Scholar]
- 11.Bouchard JP, Cossette L, Bassez G, Puymirat J. Natural history of skeletal muscle involvement in myotonic dystrophy type 1: a retrospective study in 204 cases. J Neurol. 2015;262:285–293. [DOI] [PubMed] [Google Scholar]
- 12.Brook JD, McCurrach ME, Harley HG, et al. Molecular basis of myotonic dystrophy: expansion of a trinucleotide (CTG) repeat at the 3’ end of a transcript encoding a protein kinase family member. Cell. 1992;68:799–808. [DOI] [PubMed] [Google Scholar]
- 13.Taneja KL, McCurrach M, Schalling M, Housman D, Singer RH. Foci of trinucleotide repeat transcripts in nuclei of myotonic dystrophy cells and tissues. J Cell Biol. 1995;128:995–1002. [DOI] [PMC free article] [PubMed] [Google Scholar]
- 14.Davis BM, McCurrach ME, Taneja KL, Singer RH, Housman DE. Expansion of a CUG trinucleotide repeat in the 3’ untranslated region of myotonic dystrophy protein kinase transcripts results in nuclear retention of transcripts. Proc Natl Acad Sci U S A. 1997;94: 7388–7393. [DOI] [PMC free article] [PubMed] [Google Scholar]
- 15.Wang ET, Ward AJ, Cherone JM, et al. Antagonistic regulation of mRNA expression and splicing by CELF and MBNL proteins. Genome Res. 2015;25:858–871. [DOI] [PMC free article] [PubMed] [Google Scholar]
- 16.Wagner SD, Struck AJ, Gupta R, Thornton CA, Wang ET, Berglund J. Dose-dependent regulation of alternative splicing by MBNL proteins reveals biomarkers for myotonic dystrophy. PLoS Genet. 2016;12: e1006316. [DOI] [PMC free article] [PubMed] [Google Scholar]
- 17.Lin X, Miller JW, Mankodi A, Moxley RT, Swanson MS, Thornton CA. Failure of MBNL1-dependent post-natal splicing transitions in myotonic dystrophy. Hum Mol Genet. 2006;15:2087–2097. [DOI] [PubMed] [Google Scholar]
- 18.Mankodi A, Urbinati C, Yuan QP, et al. Muscleblind localizes to nuclear foci of aberrant RNA in myotonic dystrophy types 1 and 2. Human Mol Genet. 2001;10:2165–2170. [DOI] [PubMed] [Google Scholar]
- 19.Miller J, Urbinati C, Tenq-Umnuay P, et al. Recruitment of human muscleblind proteins to (CUG)(n) expansions associated with myotonic dystrophy. EMBO J. 2000;19:4439–4448. [DOI] [PMC free article] [PubMed] [Google Scholar]
- 20.Timchenko L, Miller J, Timchenko N, et al. Identification of a (CUG)n triplet repeat RNA-binding protein and its expression in myotonic dystrophy. Nucleic Acids Res. 1996;24:4407–4414. [DOI] [PMC free article] [PubMed] [Google Scholar]
- 21.Philips A, Timchenko L, Cooper T. Disruption of splicing regulated by a CUG-binding protein in myotonic dystrophy. Science. 1998;280:737–741. [DOI] [PubMed] [Google Scholar]
- 22.Kuyumcu-Martinez NM, Wang GS, Cooper TA. Increased steady-state levels of CUGBP1 in myotonic dystrophy 1 are due to PKC-mediated hyperphosphorylation. Mol Cell. 2007;28:68–78. [DOI] [PMC free article] [PubMed] [Google Scholar]
- 23.Ward AJ, Rimer M, Killian JM, Dowling JJ, Cooper TA. CUGBP1 overexpression in mouse skeletal muscle reproduces features of myotonic dystrophy type 1. Hum Mol Genet. 2010;19:3614–3622. [DOI] [PMC free article] [PubMed] [Google Scholar]
- 24.Dasgupta T, Ladd AN. The importance of CELF control: molecular and biological roles of the CUG-BP, Elav-like family of RNA-binding proteins. Wiley interdisciplinary reviews. RNA. 2012;3:104–121. [DOI] [PMC free article] [PubMed] [Google Scholar]
- 25.Nakamori M, Osborne RJ, Wheeler TM, et al. Splicing biomarkers of disease severity in myotonic dystrophy. Ann Neurol. 2013;74: 862–872. [DOI] [PMC free article] [PubMed] [Google Scholar]
- 26.Charlet-B N, Savkur RS, Singh G, Philips AV, Grice EA, Cooper TA. Loss of the muscle-specific chloride channel in type 1 myotonic dystrophy due to misregulated alternative splicing. Mol Cell. 2002;10: 45–53. [DOI] [PubMed] [Google Scholar]
- 27.Mankodi A, Takahashi MP, Jiang H, et al. Expanded CUG repeats trigger aberrant splicing of ClC-1 chloride channel pre-mRNA and hyperexcitability of skeletal muscle in myotonic dystrophy. Mol Cell. 2002; 10:35–44. [DOI] [PubMed] [Google Scholar]
- 28.Savkur R, Philips A, Cooper TA. Aberrant regulation of insulin receptor alternative splicing is associated with insulin resistance in myotonic dystrophy. Nat Genet. 2001;29:40–47. [DOI] [PubMed] [Google Scholar]
- 29.Santoro M, Masciullo M, Bonvissuto D, Bianchi ML, Michetti F, Silvestri G. Alternative splicing of human insulin receptor gene (INSR) in type I and type II skeletal muscle fibers of patients with myotonic dystrophy type 1 and type 2. Mol Cell Biochem. 2013;380:259–265. [DOI] [PubMed] [Google Scholar]
- 30.Lindeman E, Leffers P, Spaans F, et al. Strength training in patients with myotonic dystrophy and hereditary motor and sensory neuropathy: a randomized clinical trial. Arch Phys Med Rehabil. 1995;76:612–620. [DOI] [PubMed] [Google Scholar]
- 31.Orngreen MC, Olsen DB, Vissing J. Aerobic training in patients with myotonic dystrophy type 1. Ann Neurol. 2005;57:754–757. [DOI] [PubMed] [Google Scholar]
- 32.Kierkegaard M, Harms-Ringdahl K, Edström L, Holmqvist WL, Tollbäck A. Feasibility and effects of a physical exercise programme in adults with myotonic dystrophy type 1: a randomized controlled pilot study. J Rehabil Med. 2011;43:695–702. [DOI] [PubMed] [Google Scholar]
- 33.Brady LI, MacNeil LG, Tarnopolsky MA. Impact of habitual exercise on the strength of individuals with myotonic dystrophy type 1. Am J Phys Med Rehabil. 2014;93:739–746. [DOI] [PubMed] [Google Scholar]
- 34.Okkersen K, Jimenez-Moreno C, Wenninger S, et al. Cognitive behavioural therapy with optional graded exercise therapy in patients with severe fatigue with myotonic dystrophy type 1: a multicentre, single-blind, randomised trial. Lancet Neurol. 2018;17: 671–680. [DOI] [PubMed] [Google Scholar]
- 35.Roussel MP, Morin M, Gagnon C, Duchesne E. What is known about the effects of exercise or training to reduce skeletal muscle impairments of patients with myotonic dystrophy type 1? A scoping review. BMC Musculoskelet Disord. 2019;20:101. [DOI] [PMC free article] [PubMed] [Google Scholar]
- 36.Mankodi A, Logigian E, Callahan L, McClain C, White R, Henderson D, Krym M, and Thornton CA. Myotonic dystrophy in transgenic mice expressing an expanded CUG repeat. Science. 2000;289:1769–1772. [DOI] [PubMed] [Google Scholar]
- 37.Kalsotra A, Xiao X, Ward AJ, et al. A postnatal switch of CELF and MBNL proteins reprograms alternative splicing in the developing heart. Proc Natl Acad Sci USA. 2008;105:20333–20338. [DOI] [PMC free article] [PubMed] [Google Scholar]
- 38.Lee KY, Li M, Manchanda M, et al. Compound loss of muscleblind-like function in myotonic dystrophy. EMBO Mol Med. 2013;5:1887–1900. [DOI] [PMC free article] [PubMed] [Google Scholar]
- 39.Wang ET, Treacy D, Eichinger K, et al. Transcriptome alterations in myotonic dystrophy skeletal muscle and heart. Hum Mol Genet. 2018; 28:1312–1321. [DOI] [PMC free article] [PubMed] [Google Scholar]
- 40.Kimura T, Nakamori M, Lueck JD, et al. Altered mRNA splicing of the skeletal muscle ryanodine receptor and sarcoplasmic/endoplasmic reticulum Ca2+-ATPase in myotonic dystrophy type 1. Hum Mol Genet. 2005;14:2189–2200. [DOI] [PubMed] [Google Scholar]
- 41.Vihola A, Sirito M, Bachinski L, et al. Altered expression and splicing of Ca2+ metabolism genes in myotonic dystrophies DM1 and DM2. Neuropathol App Neurobiol. 2013;39:390–405. [DOI] [PMC free article] [PubMed] [Google Scholar]
- 42.Manta A, Stouth DW, Xhuti D, et al. Chronic exercise mitigates disease mechanisms and improves muscle function in myotonic dystrophy type 1 mice. J Physiol. 2019;597:1361–1381. [DOI] [PMC free article] [PubMed] [Google Scholar]
Associated Data
This section collects any data citations, data availability statements, or supplementary materials included in this article.


