

Abstract
Twenty miles per hour (32 km/hour) or 30 km/hour speed limits represent a potential strategy to reduce urban road injuries and are becoming increasingly widespread. However, no study has conducted a robust evaluation of the effects of city-wide 20 mph speed limits on road injuries. This study reports the effects of such an intervention, based on a natural experiment that took place in Bristol, UK. Based on a stepped-wedge design using count data, negative binomial regressions showed that between 2008 and 2016, the 20 mph speed limit intervention was associated with a city-level reduction of fatal injuries of around 63% (95% CI 2% to 86%), controlling for trends over time and areas. There was also a general trend of reduction of the total number of injuries at city level and in 20 mph roads. These findings highlight the potential benefits of city-wide 20 mph speed limits. We hypothesise that this city-wide approach may encourage a general behaviour change in drivers that, in turn, may contribute to reducing injuries across the city.
Keywords: speed, 20 mph limits, road injuries, longitudinal, stepped-wedge design
Introduction
Twenty miles per hour (32 km/hour) or 30 km/hour speed limits represent a potential strategy to reduce urban road injuries and are becoming increasingly widespread in Western countries.1–3 This is because reducing road injuries is a priority for public health; as such, injuries are among the leading causes of death and disability worldwide, with more than one million individuals dying each year on the road.4 Previous research has shown that motorised vehicle speed is positively associated with risk of road traffic collisions5 6; therefore, reducing speed should have an effect on reducing injuries.4 Twenty miles per hour limits are sign-only interventions without engineering measures, such as speed bumps, as opposed to 20 mph speed zones, which also include speed-reduction engineering measures to slow traffic. According to the WHO, 20 mph limits are recommended for residential areas with high pedestrian activity.5
In 2009, a study found that 20 mph zones in London were associated with a 41.9% reduction in road casualties.7 However, despite 20 mph speed limits (ie, without engineering measures) becoming increasingly popular, little research has been conducted to test the effects of 20 mph limits on road injuries. A recent UK government study concluded that there is not enough evidence to suggest that 20 mph speed limits are associated with decreases in injuries in residential areas.8 However, no study has conducted a robust evaluation of the effects of a city-wide 20 mph speed limit intervention, defined as a majority of roads across an urban area being set at 20 mph, on road injuries. The implementation in Bristol, UK, was conceived in principle as being comprehensively city-wide, with exceptions for a few roads that remained at 30 mph. This paper reports findings from the first stepped-wedge design road injury evaluation of such an intervention. The study has the strengths of being based on a natural experiment and of being the first study to evaluate the effects of such a high-coverage policy on injuries with a robust methodology.
Methods
The Bristol 20 mph speed limit policy was implemented between 2010 and 2015.9 The 20 mph limit scheme was introduced in phases corresponding to seven areas (for details on the intervention, refer to Bornioli et al 10), enabling a stepped-wedge design analysis. This is a pragmatic design suited to interventions that are implemented in steps across several clusters (in this case, geographical areas). Such a design allows robust evaluation of the effects of natural experiments where interventions are implemented following political or logistic constraints.11 12
The current injury analysis was based on Police STATS19 data from 2008 to 2016. STATS19 records the date, location, and number and type of injury (slight, serious or fatal). An injury is defined as serious if the person is detained in the hospital as an inpatient or has any of the following injuries: fractures, concussion, internal injuries, crushing, non-friction burns, severe cuts and lacerations, or severe general shock requiring medical treatment. An injury is classified as fatal if the person dies within 30 days of the collision.
In the injury dataset, the Bristol City Council coded each injury with its area code, severity, the intervention period (preintervention or postintervention), the speed limit of the road (20 or 30mph) and sociodemographics of the injured people. The research team further classified each collision by year and calculated exposure times for each area in each year (eg, the number of months included in the study either preintervention or postintervention in each area; table 1). Figure 1 illustrates the stepped-wedge study design.
Table 1.
Number of injuries and equivalent annual rates of injury for all roads
| Area | Injury type | Months, rounded (n) | Injuries (n) | Equivalent annual rate of injuries | |||
| Pre | Post | Pre | Post | Pre | Post | ||
| 1 | All severity | 34 | 74 | 601 | 1143 | 212.1 | 185.4 |
| Fatal | 34 | 74 | 2 | 2 | 0.7 | 0.3 | |
| Serious | 34 | 74 | 60 | 116 | 21.2 | 18.8 | |
| Slight | 34 | 74 | 539 | 1025 | 190.2 | 166.2 | |
| 2 | All severity | 72 | 36 | 2092 | 862 | 348.7 | 287.3 |
| Fatal | 72 | 36 | 15 | 4 | 2.5 | 1.3 | |
| Serious | 72 | 36 | 228 | 105 | 38.0 | 35.0 | |
| Slight | 72 | 36 | 1849 | 753 | 308.2 | 251.0 | |
| 3 | All severity | 78 | 30 | 1208 | 462 | 185.8 | 184.8 |
| Fatal | 78 | 30 | 12 | 2 | 1.8 | 0.8 | |
| Serious | 78 | 30 | 138 | 65 | 21.2 | 26.0 | |
| Slight | 78 | 30 | 1058 | 395 | 162.8 | 158.0 | |
| 4 | All severity | 81 | 27 | 939 | 243 | 139.1 | 108.0 |
| Fatal | 81 | 27 | 19 | 3 | 2.8 | 1.3 | |
| Serious | 81 | 27 | 109 | 33 | 16.1 | 14.7 | |
| Slight | 81 | 27 | 811 | 207 | 120.1 | 92.0 | |
| 5 | All severity | 87 | 21 | 1284 | 260 | 177.1 | 148.6 |
| Fatal | 87 | 21 | 19 | 0 | 2.6 | 0.0 | |
| Serious | 87 | 21 | 116 | 28 | 16.0 | 16.0 | |
| Slight | 87 | 21 | 1149 | 232 | 158.5 | 132.6 | |
| 6 | All severity | 89 | 19 | 631 | 107 | 85.1 | 67.6 |
| Fatal | 89 | 19 | 4 | 1 | 0.5 | 0.6 | |
| Serious | 89 | 19 | 73 | 15 | 9.8 | 9.5 | |
| Slight | 89 | 19 | 554 | 91 | 74.7 | 57.5 | |
| 7 | All severity | 93 | 15 | 852 | 133 | 109.9 | 106.4 |
| Fatal | 93 | 15 | 9 | 0 | 1.2 | 0.0 | |
| Serious | 93 | 15 | 85 | 11 | 11.0 | 8.8 | |
| Slight | 93 | 15 | 758 | 122 | 97.8 | 97.6 | |
Figure 1.
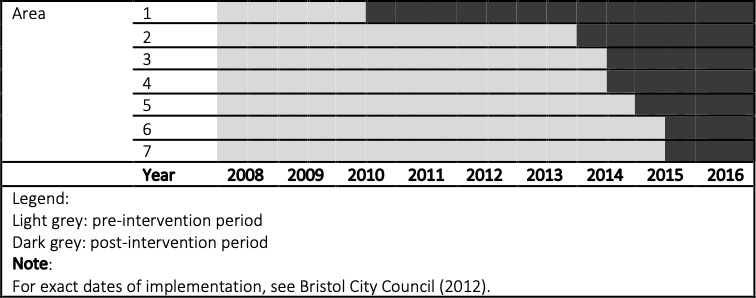
Stepped-wedge study design.
Statistical methods
The analysis compared injury counts before and after the introduction of the 20 mph speed limit while controlling for year and areas. A stepped-wedge design enables a robust evaluation based on a natural experiment, allowing for the rolling nature of the intervention, implemented in several steps.11 12 In addition, controlling for calendar year (as a continuous variable) allows for changes in injury rates over time that were not associated with the intervention (eg, national trends). Two analyses were undertaken: (1) at city level (including roads with postintervention limits of 20 and 30 mph) and (2) on 20 mph roads only. This is because previous analyses2 12 found that average speeds in Bristol decreased following the intervention from 27.1 to 23.7 mph, with postintervention mean speeds of 22.5 mph in 20 mph roads and of 25.9 mph in 30 mph roads. Analyses of injuries, rather than collisions, was undertaken because this is the primary outcome of public health interest.
Count data are often analysed using Poisson regression. However, the goodness-of-fit test in Stata 14 (estat gof) showed overdispersion. Therefore, negative binomial regression was used instead (nbreg command). Adjusted incident rate ratios (IRRs) were estimated to compare injuries preintervention and postintervention. Analyses were run separately for each injury type (slight, serious and fatal). In 2016, a revision to the injury reporting regime called CRASH was introduced. This has resulted in an increase in the proportion of non-fatal injuries categorised as ‘serious’.8 For this reason, sensitivity analyses were performed by re-running the analyses for serious and slight injuries excluding observations from year 2016. Results did not vary, but these are available on request.
Sites for traffic safety interventions are sometimes selected based on relative performance, with the worst performing sites being selected for treatment. If sites displayed high preintervention levels of collisions and injuries because of randomness, then over time, we would expect these sites to revert to a lower mean value.13 However, regression to the mean was not considered an issue in this study, as the 20 mph limits were introduced across the majority of the city’s roads, rather than focused on known collision sites.
Results
Descriptive analyses showed that annual postintervention rates of fatal, serious and slight injuries in each Bristol area are generally lower than the respective injury rate before the limits were introduced (table 1). Given that areas had different implementation dates, it was not possible to run descriptive analyses on city-level injury rates.
Inferential analysis
Table 2 summarises the estimated effects of the 20 mph limit on injuries. This shows a general trend of injury reductions following the intervention, both city-wide and in 20 mph roads only, and strong evidence of a city-wide reduction of fatal injuries of around 63%, though this estimate was imprecise (95% CI 2% to 86%). No temporal trend was detected.
Table 2.
IRRs comparing injuries preintervention and postintervention, by injury type, for all roads and for 20 mph roads only
| Injury severity | IRR (95% CI)* | P value | |
| All roads (20 and 30 mph roads) | Fatal | 0.37 (0.14 to 0.98) | 0.04 |
| Serious | 1.02 (0.77 to 1.34) | 0.86 | |
| Slight | 0.94 (0.84 to 1.06) | 0.39 | |
| 20 mph roads only | Fatal | 0.65 (0.15 to 2.83) | 0.57 |
| Serious | 0.84 (0.60 to 1.17) | 0.32 | |
| Slight | 0.91 (0.78 to 1.07) | 0.26 |
*Controlling for calendar year (continuous variable) and areas (categorical variable).
IRR, incidence rate ratio.
Discussion
The analysis highlights a general reduction in injuries and suggests evidence of a city-level reduction in fatalities of 63%. These findings are in line with the reductions of injuries in Brighton City Centre, where a similar area-wide (but not city-wide) scheme has been implemented.8 Interestingly, the reductions in fatalities in Bristol are larger than the 46% reduction in London associated with the introduction of traffic-calmed 20 mph zones, as identified by Grundy et al.7 The city-level reduction of fatal injuries identified in our study should also be set against national trends, which show that the number of deaths on built-up roads has increased from the 2010–2014 annual average of 585 to a 2017 figure of 607 deaths.14 Therefore, this finding goes some way to supporting city-wide 20 mph speed limits as an intervention to reduce road injuries.
The fact that such a solid reduction was observed on city level, rather than on 20 mph roads only, might be explained by the fact that average speeds decreased overall in Bristol following the intervention, and not only in 20 mph roads.2 12 Preintervention average speed in 30 mph roads was relatively high, and the reduction in speed may have contributed to reducing fatal injuries in these roads. This is similar to findings from Brighton, where reductions in collisions were observed especially in major strategic roads.8 This also suggests that the reduction in injuries is due to a general change in driving behaviour related to the city-wide nature of the 20 mph speed limit, with slower driving speeds also in 30 mph roads, where speed tends to be higher than in 20 mph roads.
To our knowledge, the current study is the first study examining the effects of a city-wide 20 mph speed limit. The study is also the first to apply a stepped-wedge design with injury count data for a 20 mph speed limit intervention, based on a natural experiment. While a recent national report has found that there is insufficient evidence to conclude that 20 mph speed limits implemented in specific city areas can reduce injuries, the current findings suggest there are benefits of city-wide 20 mph interventions. Therefore, city-wide measures, as opposed to more geographically restricted 20 mph speed limits, such as those targeting areas of perceived higher risk, outside schools for example, may help to reduce road injuries.
Limitations
A limitation of the analysis is the potential inaccuracy of STATS19 data, which are known to under-report injuries. A second limitation is the relatively short time frame of the study, with 9 years of data available. However, time frames are similar to those of Department of Transport (DfT)8; more robust evidence will be available in the long term. Third, there was no randomisation in the design, but this is a common feature in natural experiments. In addition, the wide 95% CIs might be due to the relatively small number of injuries observed, particularly fatal injuries. Finally, although we controlled for linear trends in casualties over time, we could not include a comparator area controlling for other factors (eg, weather and changes in emergency care) as in DfT8 because the intervention was applied to the whole of the study. We recognise that the strength of the statistical analysis could have been improved by the inclusion of a comparator city without city-wide 20 mph limits.
Conclusions
The paper reported findings from the first stepped-wedge design evaluation of the effects of a city-wide 20 mph speed limit intervention on road injuries. Findings have identified a general trend of reductions in road injuries and strong evidence of a reduction of city-level fatal injuries following the 20 mph speed limit intervention. This suggests that city-wide 20 mph speed limits could be an effective strategy for reducing injuries, as it encourages safer driving behaviour that is not restricted to 20 mph roads. The policy recommendation that would follow from this is to implement city-wide 20 mph limits, rather than 20 mph limits in restricted areas of a city. Further research is needed and changes in injury rates should be monitored over longer time frames.
What is already known on the subject.
Motorised vehicle speed is positively associated with risk of road traffic injuries.
Twenty miles per hour (30 km/hour) limits as a road safety tool to reduce casualties are increasingly popular.
There is no city-wide robust evaluation of the effects of city-wide 20 mph speed limits on road injuries.
What this study adds.
This is the first study to apply a stepped-wedge design with count data to a city-wide 20 mph limit case study.
The study identifies a general trend of injury reductions and strong evidence of reduction of fatal injuries following a city-wide 20 mph speed limit intervention.
Footnotes
Funding: This study was supported by Bristol City Council.
Competing interests: None declared.
Patient consent for publication: Not required.
Provenance and peer review: Not commissioned; externally peer reviewed.
References
- 1. Hu W, Cicchino JB. Lowering the speed limit from 30 mph to 25 mph in Boston: effects on vehicle speeds. Inj Prev 2019. doi: 10.1136/injuryprev-2018-043025 10.1136/injuryprev-2018-043025 [DOI] [PubMed] [Google Scholar]
- 2. Pilkington P, Bornioli A, Bray I, et al. The Bristol twenty miles per hour limit evaluation (BRITE) study. University of the West of England, Bristol 2018. [Google Scholar]
- 3. Fridman L, Rothman L, Hagel B, et al. The effect of lowering residential speed limits to 30 km/h on child pedestrian injuries in Toronto, Canada. Injury Prevention 2018;24. [Google Scholar]
- 4. World Health Organisation Global status report on road safety 2018 World Health Organisation; 2018. [Google Scholar]
- 5. Elvik R. Speed and road safety: synthesis of evidence from evaluation studies. 1908 Journal of the Transportation Research Board: Transportation Research Record, 2005: 59–69. [Google Scholar]
- 6. Rosén E, Stigson H, Sander U. Literature review of pedestrian fatality risk as a function of car impact speed. Accid Anal Prev 2011;43:25–33. 10.1016/j.aap.2010.04.003 [DOI] [PubMed] [Google Scholar]
- 7. Grundy C, Steinbach R, Edwards P, et al. Effect of 20 mph traffic speed zones on road injuries in London, 1986-2006: controlled interrupted time series analysis. BMJ 2009;339 10.1136/bmj.b4469 [DOI] [PMC free article] [PubMed] [Google Scholar]
- 8. Department of Transport 20mph research study report: process and impact evaluation technical report; 2018.
- 9. Bristol City Council 20mph speed limit pilot areas: monitoring report Bristol City Council; 2012. [Google Scholar]
- 10. Bornioli A, Bray I, Pilkington P, et al. The effectiveness of a 20 mph speed limit intervention on vehicle speeds in Bristol, UK: A non-randomised stepped wedge design. J Transp Health 2018;11:47–55. 10.1016/j.jth.2018.09.009 [DOI] [Google Scholar]
- 11. Hemming K, Haines TP, Chilton PJ, et al. The stepped wedge cluster randomised trial: rationale, design, analysis, and reporting. BMJ 2015;350:h391 10.1136/bmj.h391 [DOI] [PubMed] [Google Scholar]
- 12. Hussey MA, Hughes JP. Design and analysis of stepped wedge cluster randomized trials. Contemp Clin Trials 2007;28:182–91. 10.1016/j.cct.2006.05.007 [DOI] [PubMed] [Google Scholar]
- 13. Hauer E. Observational before/after studies in road safety. estimating the effect of highway and traffic engineering measures on road safety. Emerald Group Publishing Limited 1997. [Google Scholar]
- 14. Department for Transport Reported road casualties great Britain, annual report: 2017; 2017.