Figure 2.

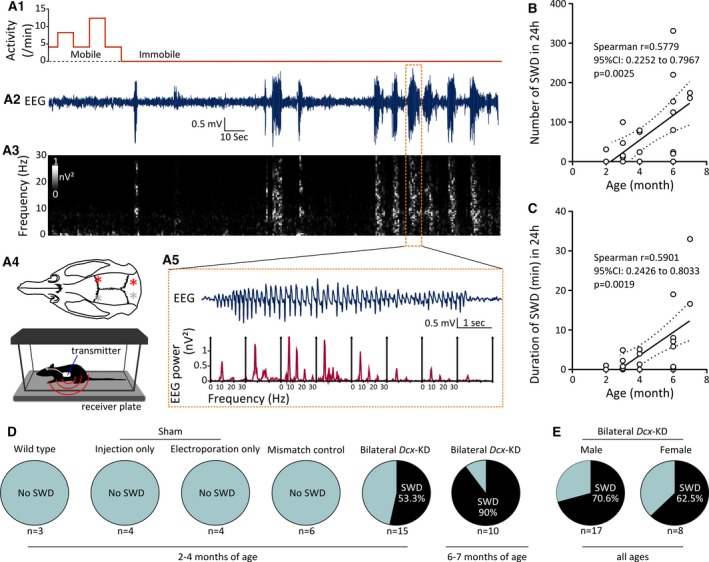
Characterization of epileptiform activity in bilateral Dcx‐knockdown (KD) rats. A, Representative electroencephalographic (EEG) recording from the right primary somatosensory (S1) cortex of a bilateral Dcx‐KD rat. A1, Animal movement, as detected by the activity sensor during EEG recording. A2, A3, EEG trace (A2), showing several epileptiform events, and the corresponding grayscale‐coded time‐frequency and spectral power analysis (A3). A5, EEG trace is further expanded to illustrate a selected epileptiform event (top) and the corresponding periodogram‐based spectral density analysis of 1‐second bins (bottom), with typical spike‐and‐wave discharge properties. A prominent ~9‐Hz peak and harmonics are visible. A4, Top, Dorsal view of the rat skull showing locations (red and gray asterisks) of the two subdural recording electrodes over the S1 cortex, and reference electrodes placed over the cerebellum. Most rats were recorded unilaterally from the right hemisphere (red asterisks). A4, Bottom, Cartoon showing a freely behaving rat implanted with a telemetry unit, placed in a cage over the receiver plate. (B) Number of spike‐and‐wave discharges (SWDs) in 24 hours plotted as a function of age (in months), and best‐fit linear regression line showing an age‐dependent increase in the occurrence of SWDs in bilateral Dcx‐KD rats. CI, confidence interval. (C) Duration of SWDs (in minutes) in 24 hours plotted as a function of age (in months), and best‐fit linear regression line showing an age‐dependent increase in the duration of SWDs in bilateral Dcx‐KD rats. Dotted lines in B and C show 95% prediction bands of the regression lines. Open circles in B and C correspond to values for individual rats. (D) Pie charts showing the prevalence of SWDs in the control groups and bilateral Dcx‐KD rats at variable ages. (E) Pie charts showing the prevalence of SWDs in male versus female bilateral Dcx‐KD rats
