

Abstract
We describe and compare the growth of three groups of juveniles, age 0 to 18, who experience different degrees of market integration and acculturation in the Ecuadorian Amazon. These include 1,384 indigenous Shuar from the Upano Valley of Ecuador and surrounding areas, 570 non-indigenous colono (or colonist) children from the same area, and 42 Shiwiar from the interior of Ecuador. We use differences between these populations in National Health and Nutrition Examination Survey (NHANES) z-scores to assess the effects of changing subsistence patterns on Shuar growth and nutrition. Although, for all three groups, mean height-for-age z-scores were negative, Shuar z-scores were significantly lower than either colono or Shiwiar z-scores. Mean weight-for-age z-scores were also negative for Shuar and colono juveniles, while mean BMI-for-age and weight-for-height z-scores were greater than zero for all three groups. Using NHANES standards, 41% of male and 38% of female Shuar were classified as stunted, versus 16% of male and 20% of female colonos. Compared to Shuar, colonos were three times less likely to be stunted (OR = 0.33, p < 0.01) and Shiwiar were eight times less likely to be stunted (OR = 0.13, p = 0.01). These differences suggest that changes in diet have negatively affected Shuar growth and nutrition.
Keywords: Amazonia, market integration, growth, Shuar, stunting
Increasing integration of indigenous groups with non-native society often brings benefits such as education, economic opportunities, and access to health care. However, a growing number of studies have also documented an increase in negative chronic health outcomes such as obesity and type-2 diabetes (Baker et al., 1986; Friedlaender et al., 1987; Huss-Ashmore et al., 1992; Lindgarde et al., 2004; Lindgarde et al., 2006; Pavan et al., 1999; Popkin, 2004; Shephard & Rode, 1996). For instance in two Amazonian populations, traditionally living individuals have healthier measures of leptin, insulin, body fat, and blood pressure compared to those with greater market integration (Lindgarde et al., 2004; Pavan et al., 1999). Many of these changes are linked to changes in diet, activity, and pathogen exposure. In some instances, increased market integration increases consumption of animal products at a cost to fruits and vegetables, as fewer crops are grown for consumption within the home and more high fat, high sugar products are purchased (Bermudez & Tucker, 2003; Rivera et al., 2004; WHO/FAO, 2003). In other instances market integration is linked to decreases in protein consumption with concomitant increases in the use of tubers or other carbohydrates, such as when hunting people move towards settled agriculture.
Dietary, economic, and demographic differences related to differing cultural practices and acculturation also affect growth outcomes in children (Bogin, 1999; Bronte-Tinkew & DeJong, 2004; Foster et al., 2005; Godoy et al., 2008; Johnston, 2002; Larrea & Kawachi, 2005; Leonard et al., 2000). In this paper we describe and compare the growth of juveniles from three groups living in Amazonian Ecuador and experiencing different degrees of market integration and acculturation. From most to least market access, these include 570 non-indigenous colono (or colonist) children from the Upano River Valley, 1,384 indigenous Shuar from the Upano Valley and surrounding areas, and 42 Shiwiar from the interior of Ecuador. Shuar and Shiwiar are both Jivaroan speaking groups, and traditionally lived very similar lifestyles based on hunting, fishing, and horticulture (Karsten, 1935; Stirling, 1938). However, Upano Valley Shuar today are increasingly integrated into markets and have seen large declines in hunting due to conversion of forest to pasture, logging, and depletion of wildlife. Moreover, they live in the same environment as their non-indigenous colono neighbors. This situation provides an opportunity to compare people from similar cultural and ethnic backgrounds living under two different socio-ecological conditions (Shuar vs. Shiwiar), as well as people from a different cultural background living in the same ecology (Shuar vs. colonos). For these groups we describe height-for-age, weight-for-age, weight-for-height, BMI-for-age and growth rates relative to National Health and Nutrition Examination Survey (NHANES) references. We then compare all three groups to assess the effects of market integration and acculturation on child-juvenile growth outcomes.
METHODS
Study Populations
Shuar.
Traditionally, Shuar lived in scattered households across the Upano River Valley, between the eastern Andean foothills and the Cutucu range (Fig. 1). Early in the 20th century, introduction of firearms allowed them to expand eastward across the Cutucu into the territory of the neighboring Achuar, so that Shuar now live on both sides of the Cutucu, and throughout the Upano River Valley from the Peruvian border past the Rio Pastaza and north across the Rio Napo. Traditionally, Shuar economy was based on horticulture, hunting, and fishing (Descola, 1996; Harner, 1984; Karsten, 1935; Rubenstein, 2001; Stirling, 1938). East of the Cutucu, where there is no road access, some Shuar continue to subsist primarily by hunting, fishing, and horticulture. However, a main road (recently paved) runs the length of the Upano valley, and Shuar are experiencing widely different effects of economic development across their territory.
Fig. 1.
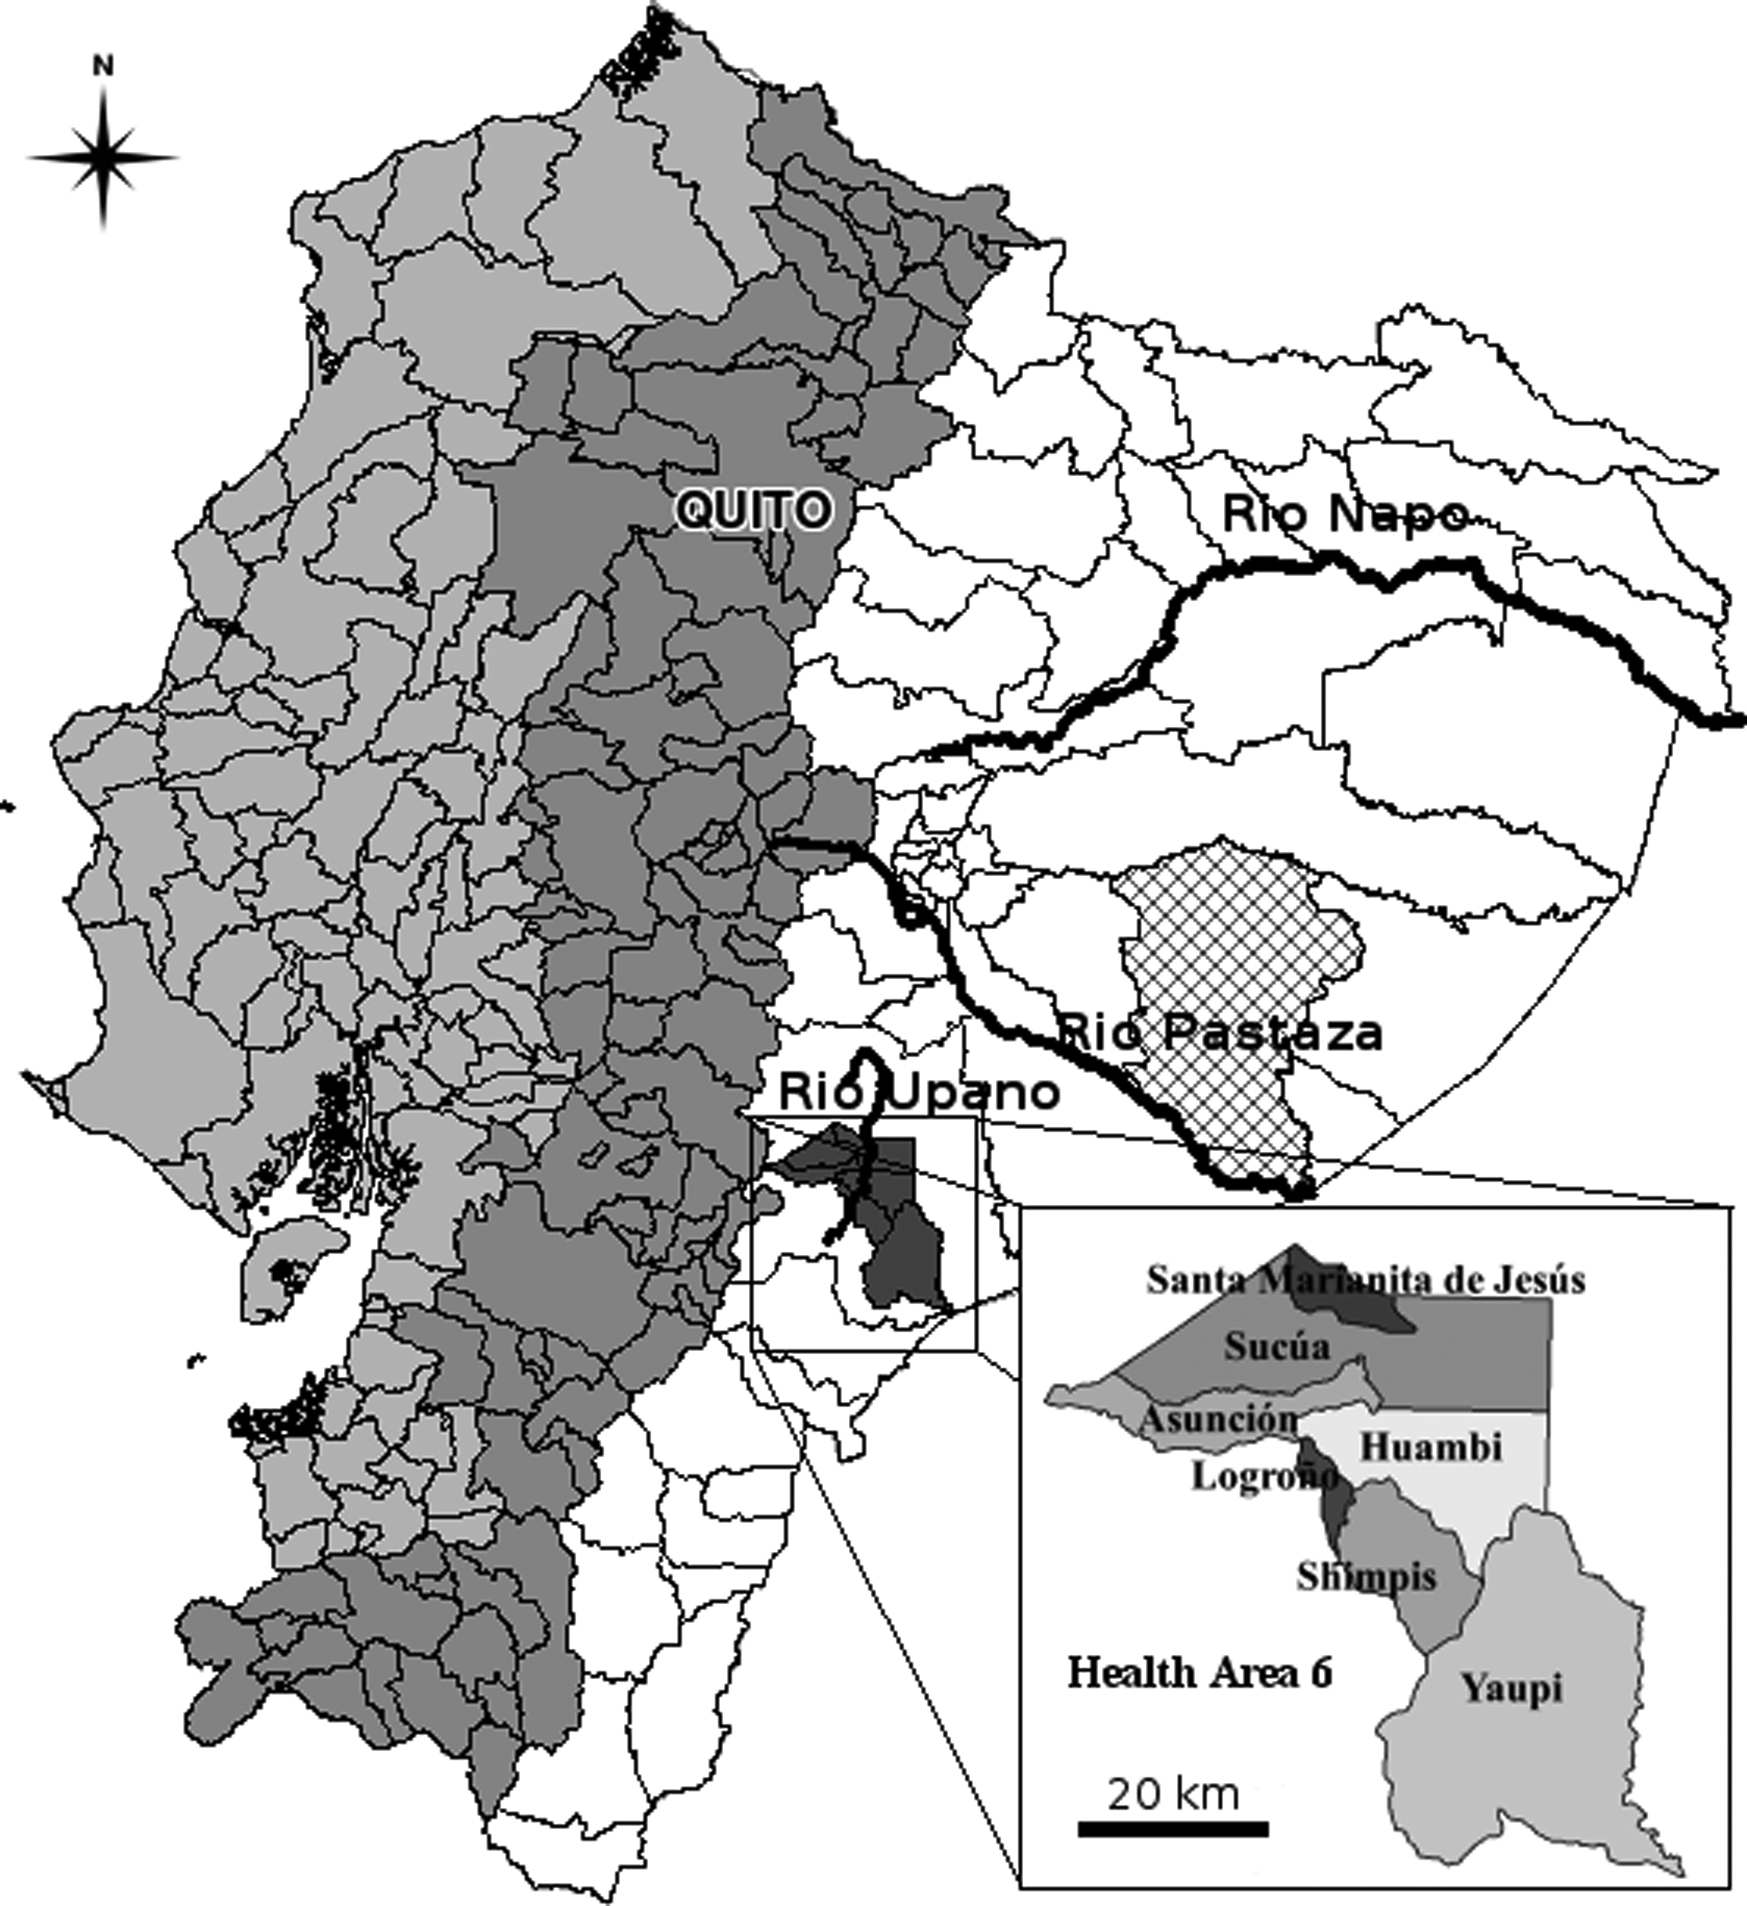
Map of Ecuador showing the three regions of the coast (light gray) the Andean highlands (medium gray) and the Amazon (white), as well as the major rivers in the area. Health Area 6 is shown in dark gray and at higher scale to show the parroquias it includes. The Cutucu range is not shown on the map, but runs parallel to the Upano River and divides Health Area 6 such that Yaupi lies to the east of the Cutucu, while the Upano River lies to the west. The area of Pastaza where Shiwiar data was collected is indicated with crosshatching. Maps are based on data from the Sistema Integrado de Indicadores Sociales del Ecuador released by the Secretaría Técnica del Frente Social of Ecuador.
In the Upano Valley, many Shuar are within walking distance of road access, live in larger communities, and have divided community lands into individually held plots (sometimes within communally held lands). Hunting and fishing are no longer critical parts of the economy, available land is limited, and land conflict between Shuar and with non-Shuar colonists (colonos) is a recurrent problem. Shuar of the Upano valley appear to have diets and subsistence regimes based largely on small-field horticulture, animal husbandry, and wage labor. No quantitative data based on direct observation of these aspects of Shuar economy and subsistence are currently available for the Upano Valley, although survey results (Pozo & Posligua, 2006) and our own (unpublished) interviews conducted in 2005 and 2007 support these descriptions. Results from Shuar living a few hundred kilometers to the north of the study area suggest that Shuar continue to consume significant animal protein, despite significant market integration (Lu, 2007).
Colonos.
Upano Valley Shuar live adjacent to communities of colonos, or colonists of mixed indigenous/European descent who have moved into the area. Colonos in the Upano Valley area either live in town, or in small rural communities scattered across the area. Colonos in town, particularly around Sucúa, typically work in wage jobs, attend school, grow and purchase food and otherwise live a small-town (but not necessarily cosmopolitan) life. Although colonos and Shuar live in communities that may be quite near each other (for instance a short walk across a small valley) and are not segregated by geography, ethnic tensions, sometimes fueled by conflicts over land or between the Ecuadorian authorities and the Shuar Federation, keep the Shuar community and the colono community largely socially and politically divided.
Shiwiar.
Shiwiar are a Jivaroan speaking people closely related to the Shuar and Achuar, who live in small scattered communities in the upper Amazonian neo-tropical forests of Ecuador and northwestern Peru. At the time of study (1994–1998) Shiwiar numbered about 2000 and continued to follow traditional subsistence patterns, even more so than interior Shuar (Sugiyama, 2004; Sugiyama & Chacon, 2000). No roads entered the study area. In the rainy season, the bulk of protein came from hunting, accompanied by fishing with hook and line. Hunting was largely successful, with 73% of hunts yielding meat for an average daily per capita meat intake of 56 g (Sugiyama & Chacon, 2000). As the dry season progressed, fishing gradually increased as rivers become shallow and fishing with poison becomes increasingly efficient. The bulk of calories came from a wide variety of horticultural products, the most important being manioc, plantains, yams, sweet potatoes and maize. Foraging for palm heart and palm grubs was a regular contributor to the diet, which was rounded out by small amounts of seasonal wild fruits, honey, insects, frogs and other occasional foods. At the time of study the two study villages were comprised of 8 and 12 households respectively.
Data Sources
2005 School Childrens’ Health Diagnostic.
Shuar and colono data come from a previously unpublished 2005 health diagnostic conducted with the Federacíon Interprovincial de Centros Shuar (FICSH) and Hospital Pio XII in Sucúa, Ecuador, which included 2171 Shuar and non-Shuar school-age children living within Morona Santiago, Health Area 6 (Fig. 1). Our collaboration with this study and use of this data was approved by the University of Oregon Institutional Review Board and by FICSH. A physical and dental exam was administered at village schools by four medical teams comprised of a physician, dentist, and two nurses or nurse auxiliaries. Height was measured using a standard metric tape measure attached to a vertical surface. Weight was measured using a standard bathroom scale.
The sample includes nearly 100% of children attending school on the day of the team’s visit, as well as a few non-attendees. Although we cannot state the exact percentage of the population represented, most children attend school so it is expected to be near 100% for elementary school age children. Ages were available for 2110 individuals (range = 1–17 years, mean = 8.3 ± 2.6). The majority of children were elementary-school age; only 4% were younger than five, and only 2% older than thirteen (Table 1). Children’s ethnicity was assessed based on self-report and community membership. Some communities are exclusively Shuar since FISCH law bans the sale of Shuar lands to non-Shuar. The sample includes 1384 Shuar children (52% male, 48% female). Of these, 92.5% were from the Upano Valley, with the majority (65% of the total) living in Sucúa parroquia (Fig. 1). The remaining 7.5% were from Yaupi parroquia, which lies across the Cutucu from the Upano Valley (Fig. 1). The sample also includes 570 colonos from the Upano Valley (56% male, 44% female). Excluded from analyses were 245 children of unknown (52 children) or other ethnicities (193 children, most of whom were listed as mestizo, or mixed ethnicity).
Table 1.
Shuar mean growth outcomes, z-scores, and sample sizes by sex and yearly age cohort
| Height-for-age | Weight-for-age | BMI-for-age | Weight-for-height | ||||||||||||||
|---|---|---|---|---|---|---|---|---|---|---|---|---|---|---|---|---|---|
| Age | n | Mean (cm) | Mean z | % z ≤ −2 | Mean (kg) | Mean z | % z ≤ −2 | Mean BMI | Mean z | % z ≤ −2 | n | Mean z | % z ≤ −2 | ||||
| Males | 0 | 4 | 67.0 | - | - | 7.3 | - | - | 18.2 | - | - | - | - | - | |||
| 1 | 5 | 72.6 | - | - | 8.1 | - | - | 15.4 | - | - | - | - | - | ||||
| 2 | 4 | 84.9 | −0.57 | 0% | 10.5 | −1.84 | 50% | 14.6 | −1.89 | 75% | 4 | −2.06 | 75% | ||||
| 3 | 6 | 97.3 | 0.29 | 0% | 14.3 | −0.35 | 17% | 15.1 | −1.05 | 33% | 6 | −0.98 | 17% | ||||
| 4 | 13 | 96.1 | −1.78 | 54% | 16.0 | −0.63 | 23% | 17.2 | 0.99 | 8% | 13 | 0.61 | 15% | ||||
| 5 | 58 | 103.8 | −1.29 | 31% | 17.8 | −0.55 | 7% | 16.5 | 0.58 | 7% | 57 | 0.41 | 9% | ||||
| 6 | 97 | 109.2 | −1.31 | 26% | 19.6 | −0.65 | 12% | 16.3 | 0.37 | 7% | 94 | 0.27 | 7% | ||||
| 7 | 97 | 113.1 | −1.67 | 37% | 21.1 | −0.88 | 12% | 16.4 | 0.29 | 6% | 88 | 0.35 | 8% | ||||
| 8 | 98 | 117.7 | −1.87 | 42% | 23.3 | −0.85 | 9% | 16.8 | 0.36 | 5% | 78 | 0.52 | 6% | ||||
| 9 | 79 | 123.2 | −1.78 | 41% | 26.0 | −0.80 | 10% | 17.1 | 0.30 | 3% | 32 | 0.99 | 0% | ||||
| 10 | 79 | 127.1 | −1.82 | 42% | 27.7 | −1.06 | 16% | 17.1 | −0.02 | 3% | 13 | 0.84 | 0% | ||||
| 11 | 56 | 130.4 | −1.96 | 57% | 29.9 | −1.26 | 13% | 17.5 | −0.06 | 5% | 7 | 1.05 | 0% | ||||
| 12 | 39 | 133.6 | −2.20 | 64% | 30.4 | −1.87 | 33% | 17.1 | −0.84 | 15% | 3 | 0.90 | 0% | ||||
| 13 | 26 | 137.8 | −2.42 | 65% | 35.3 | −1.66 | 42% | 18.5 | −0.16 | 4% | 1 | −0.44 | 0% | ||||
| 14 | 12 | 142.5 | −2.50 | 58% | 43.6 | −0.93 | 9% | 20.2 | 0.32 | 0% | - | - | - | ||||
| 15 | 7 | 154.3 | −1.91 | 43% | 52.5 | −0.57 | 0% | 21.9 | 0.48 | 0% | - | - | - | ||||
| 16 | 2 | 149.5 | −2.97 | 100% | 44.0 | −2.23 | 50% | 19.6 | −0.37 | 0% | - | - | - | ||||
| 17 | 1 | 138.6 | −4.67 | 100% | 41.8 | −3.29 | 100% | 21.8 | 0.18 | 0% | - | - | - | ||||
| Females | 0 | 1 | . | - | - | 5.0 | - | - | . | - | - | - | - | - | |||
| 1 | 6 | 72.6 | - | - | 8.9 | - | - | 17.2 | - | - | - | - | - | ||||
| 2 | 3 | 85.4 | −0.52 | 0% | 11.3 | −1.00 | 0% | 15.5 | −0.62 | 0% | 3 | −0.82 | 33% | ||||
| 3 | 5 | 85.9 | −2.37 | 60% | 11.4 | −2.19 | 40% | 15.6 | −0.49 | 20% | 4 | −1.17 | 50% | ||||
| 4 | 9 | 96.4 | −1.41 | 44% | 15.5 | −0.63 | 22% | 16.5 | 0.77 | 0% | 9 | 0.37 | 0% | ||||
| 5 | 71 | 103.1 | −1.11 | 23% | 17.2 | −0.62 | 14% | 16.1 | 0.28 | 7% | 71 | 0.06 | 7% | ||||
| 6 | 83 | 108.2 | −1.41 | 33% | 18.9 | −0.72 | 8% | 16.1 | 0.32 | 6% | 83 | 0.20 | 6% | ||||
| 7 | 85 | 112.6 | −1.78 | 35% | 20.5 | −0.93 | 15% | 16.1 | 0.19 | 2% | 82 | 0.22 | 5% | ||||
| 8 | 84 | 117.1 | −1.94 | 45% | 22.4 | −1.00 | 11% | 16.4 | 0.08 | 4% | 73 | 0.33 | 4% | ||||
| 9 | 73 | 121.4 | −1.99 | 52% | 25.1 | −1.05 | 22% | 16.9 | 0.14 | 0% | 39 | 0.44 | 0% | ||||
| 10 | 74 | 127.8 | −1.62 | 38% | 28.3 | −1.00 | 12% | 17.3 | 0.03 | 1% | 14 | 0.66 | 0% | ||||
| 11 | 55 | 134.5 | −1.36 | 20% | 32.1 | −1.02 | 18% | 17.6 | −0.11 | 4% | 3 | 1.34 | 0% | ||||
| 12 | 38 | 138.5 | −1.73 | 37% | 36.3 | −0.89 | 8% | 18.9 | 0.08 | 3% | - | - | - | ||||
| 13 | 20 | 139.3 | −2.59 | 65% | 37.8 | −1.25 | 25% | 19.6 | 0.09 | 0% | 1 | 3.20 | 0% | ||||
| 14 | 8 | 142.4 | −2.75 | 88% | 42.8 | −0.99 | 11% | 21.3 | 0.32 | 0% | - | - | - | ||||
| 15 | 3 | 149.3 | −1.95 | 33% | 46.2 | −0.92 | 25% | 20.0 | −0.04 | 0% | - | - | - | ||||
| 16 | 1 | 136.0 | −4.13 | 100% | 39.0 | −2.55 | 100% | 21.1 | 0.20 | 0% | - | - | - | ||||
| 17 | - | - | - | - | - | - | - | - | - | - | |||||||
1994–1998 Shiwiar Data.
Shiwiar health and anthropometric data were gathered by Sugiyama during separate field trips in two communities between 1994 and 1998. Shiwiar data was collected from the villages of Alto Corrientes and Kurintza, located in the region of Pastaza indicated in Fig. 1. The dataset includes 42 Shiwiar children under age 18, including 25 males between the ages of 3 and 12 and 16 females between the ages of 2 and 18. Anthropometric measures were collected as part of a larger health study, and additional details have been described elsewhere (Sugiyama, 2004; Sugiyama & Scalise Sugiyama, 2003). Briefly, height was measured using a standard portable stadiometer. Weight was measured by having subjects sit in a hammock suspended from a 100 or 50 kg spring scale. Height was available for 36 individuals and weight for 21. Ages are based on informant reports and/or birth records, such that at least year of birth was known for all individuals.
Analysis
Growth reference z-scores were calculated from National Health and Nutrition Examination Survey (NHANES) LMS data files available from the National Center for Health Statistics at the Center for Disease Control (www.cdc.gov/growthcharts/) and based on references developed in the year 2000. The LMS data files contain values for the median (M), generalized coefficient of variation (S), and Box-Cox power (L) by age or stature, as appropriate for the measure. These were used to convert Shuar, colono, and Shiwiar BMI, weight, and height to z-scores according to the equation Z = ((X/M)L-1)/(LS), where X is the measure in question (Box & Cox, 1964; Cole TJ, 1990). NHANES references include ages 2–20 for weight, height, and BMI, as well as weight-for-heights standards for individuals between 77 and 121 cm. Thus, some individuals in our data were excluded from analysis because they were outside of reference ranges, and sample size and composition differ slightly depending on the measure under analysis.
Using these standards, we defined stunting as a height-for-age z-score ≤ −2, wasting as a weight-for-height z-score ≤ −2, underweight as a weight-for-age z-score ≤ −2, and low BMI as a BMI-for-age z-score ≤ −2. Two-tailed, one sample t-tests were used to compare mean z-scores with zero. Independent samples t-tests assuming equal variances were used to compare scores by sex. ANCOVA and binary logistic regression were used to compare groups while controlling for age and sex. All calculations and analysis were done using SPSS 15.0 (SPSS Inc.).
Z-scores were also calculated based on World Health Organization (WHO) references available from the WHO (http://www.who.int/childgrowth/en/). The use of WHO z-scores yielded qualitatively similar results to the use of NHANES standards, reported below, so results with WHO references are not reported in this paper. However, they are available upon request from the authors.
RESULTS
Comparison between Shuar and colono children
Shuar children’s growth.
Shuar children’s mean height, weight, and BMI by age and sex are listed in Table 1, and illustrated graphically in Figs. 2 and 3. Compared to NHANES growth references, mean z-scores for Shuar children were significantly below zero for height-for-age (HAZ) and weight-for-age (WAZ) (Table 3). Stunting was prevalent in both males (41%) and females (38%). Underweight was less common (males: 14%, females: 15%). Conversely, mean z-scores for BMI-for-age (BAZ) and weight-for-height (WHZ) were significantly higher than zero for both sexes (males: 0.18 and 0.41, respectively; females: 0.14 and 0.24, p < 0.01 for all tests). Low BMI was uncommon (males 6%, females 3%) as was wasting (males 8%, females 5%).
Fig. 2.
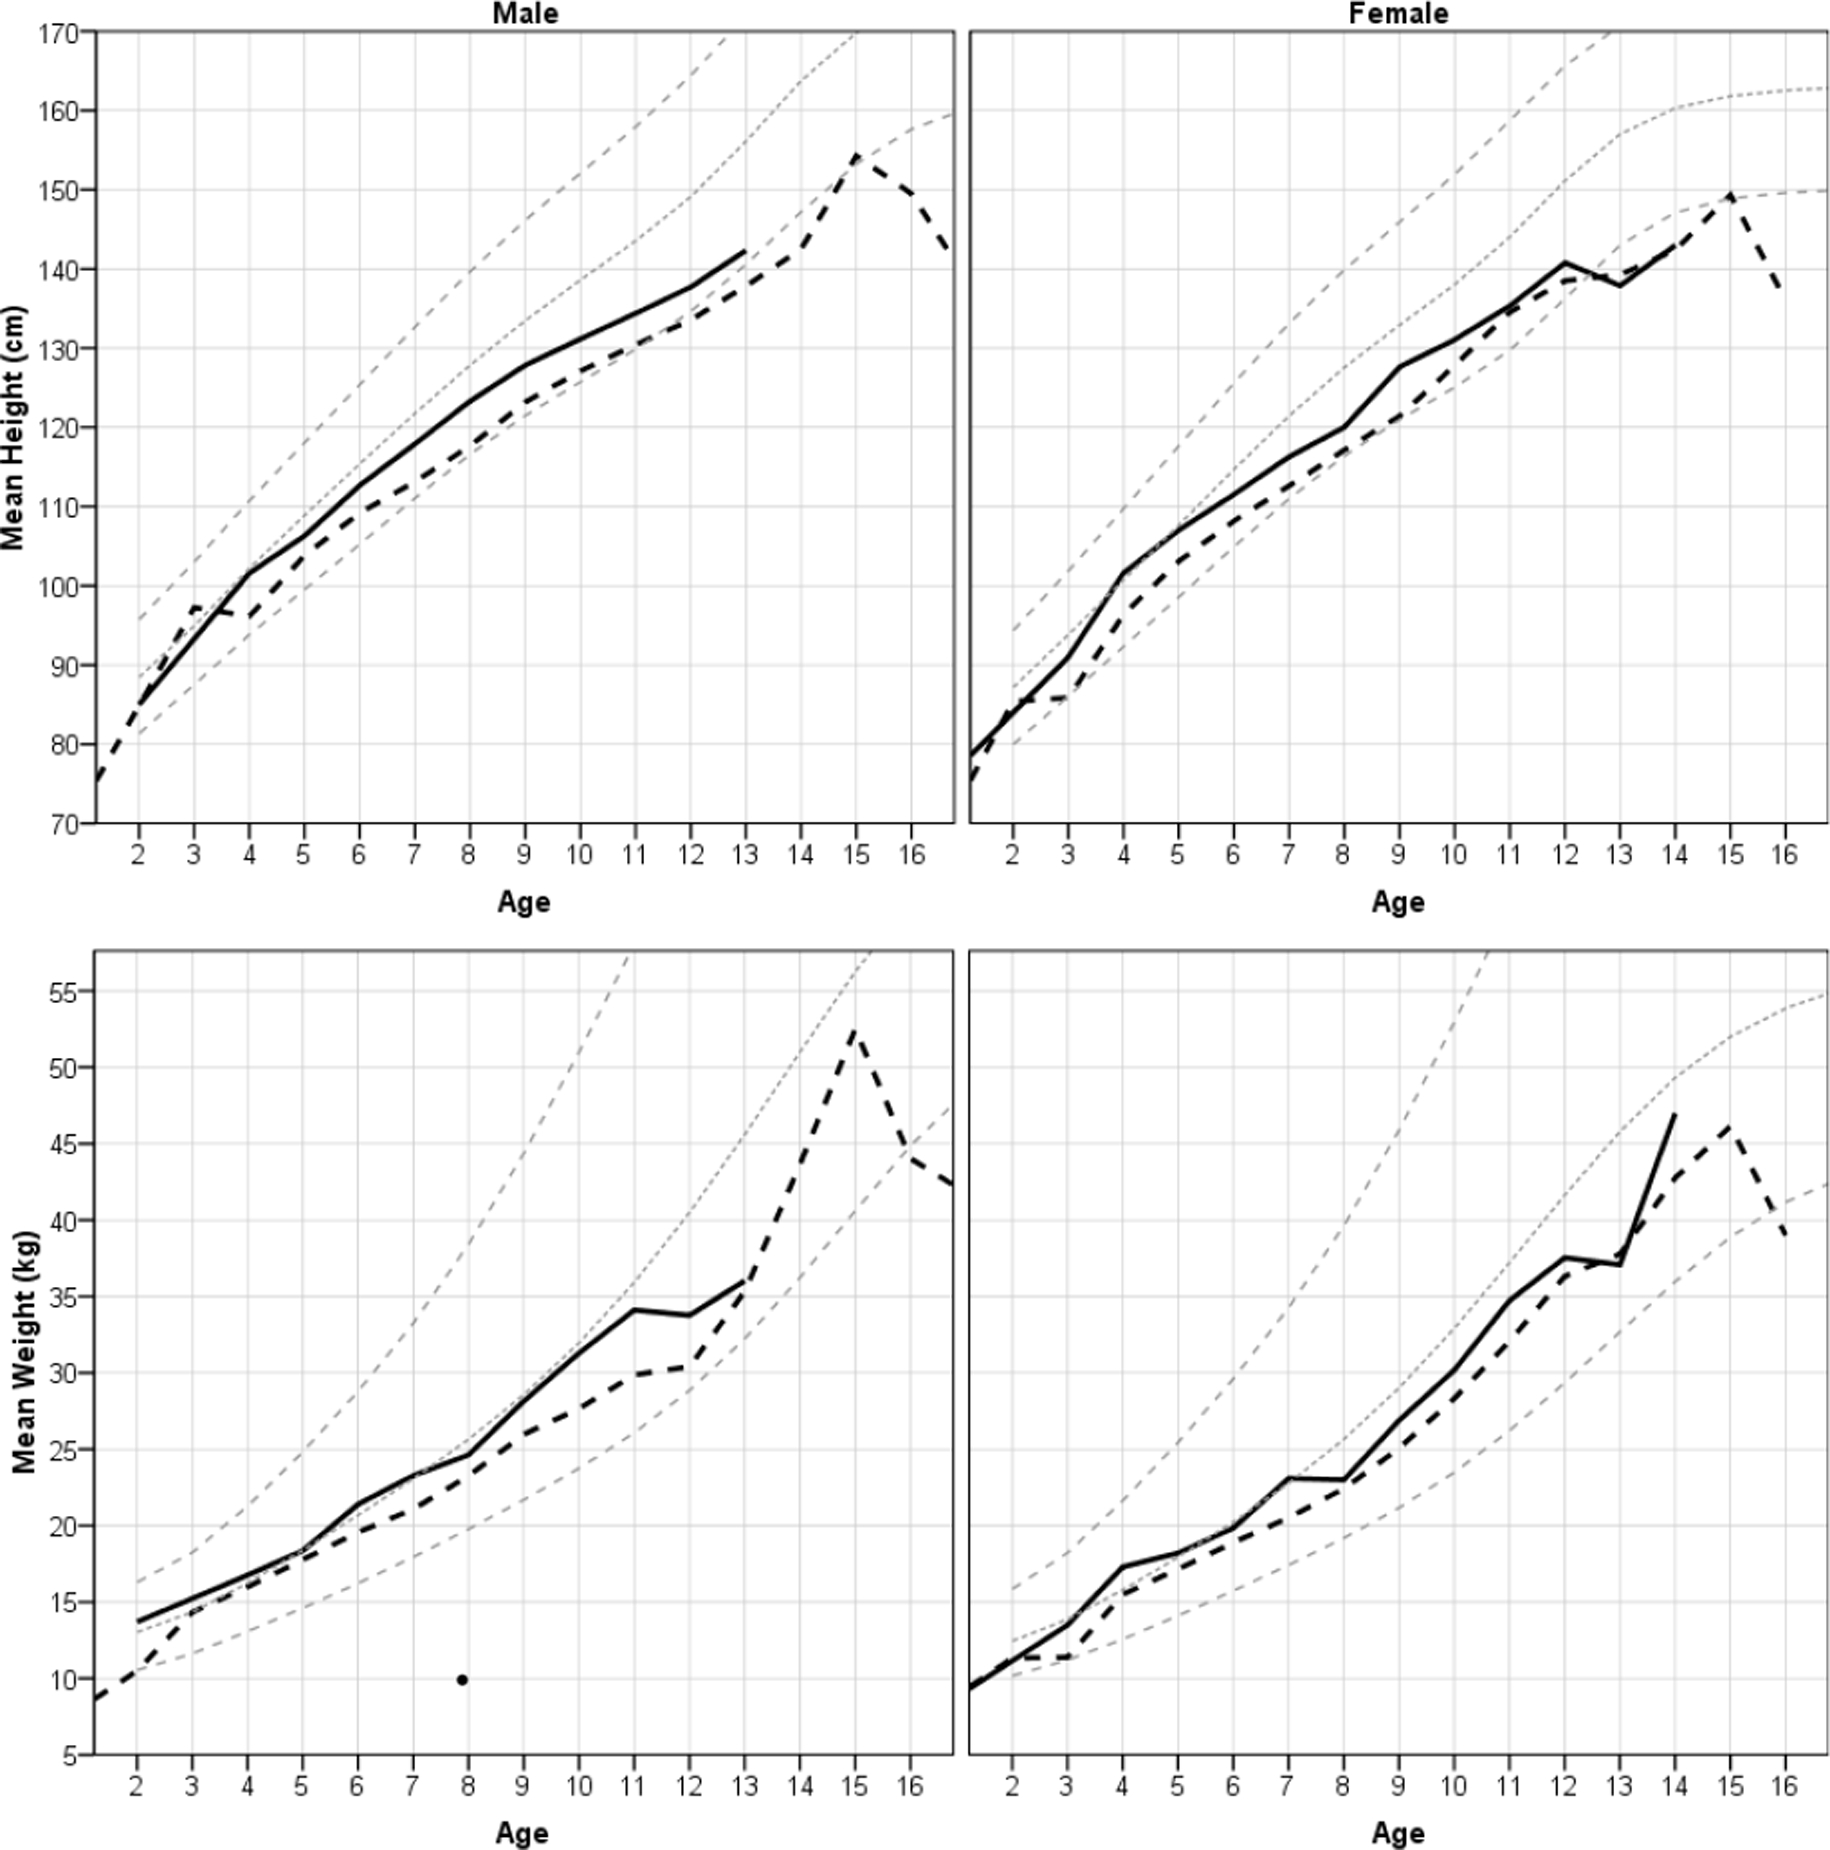
Mean weight and height by age and sex cohort for colono (solid black line) and Shuar (long dashes) children. For comparison, NHANES standard z-scores of 0, +2, and −2 are shown in gray. In the dataset most ages were reported in whole years. Those that were not were rounded down to the nearest year before graphing. See Tables 1 and 2 for sample sizes and cohort values.
Fig. 3.
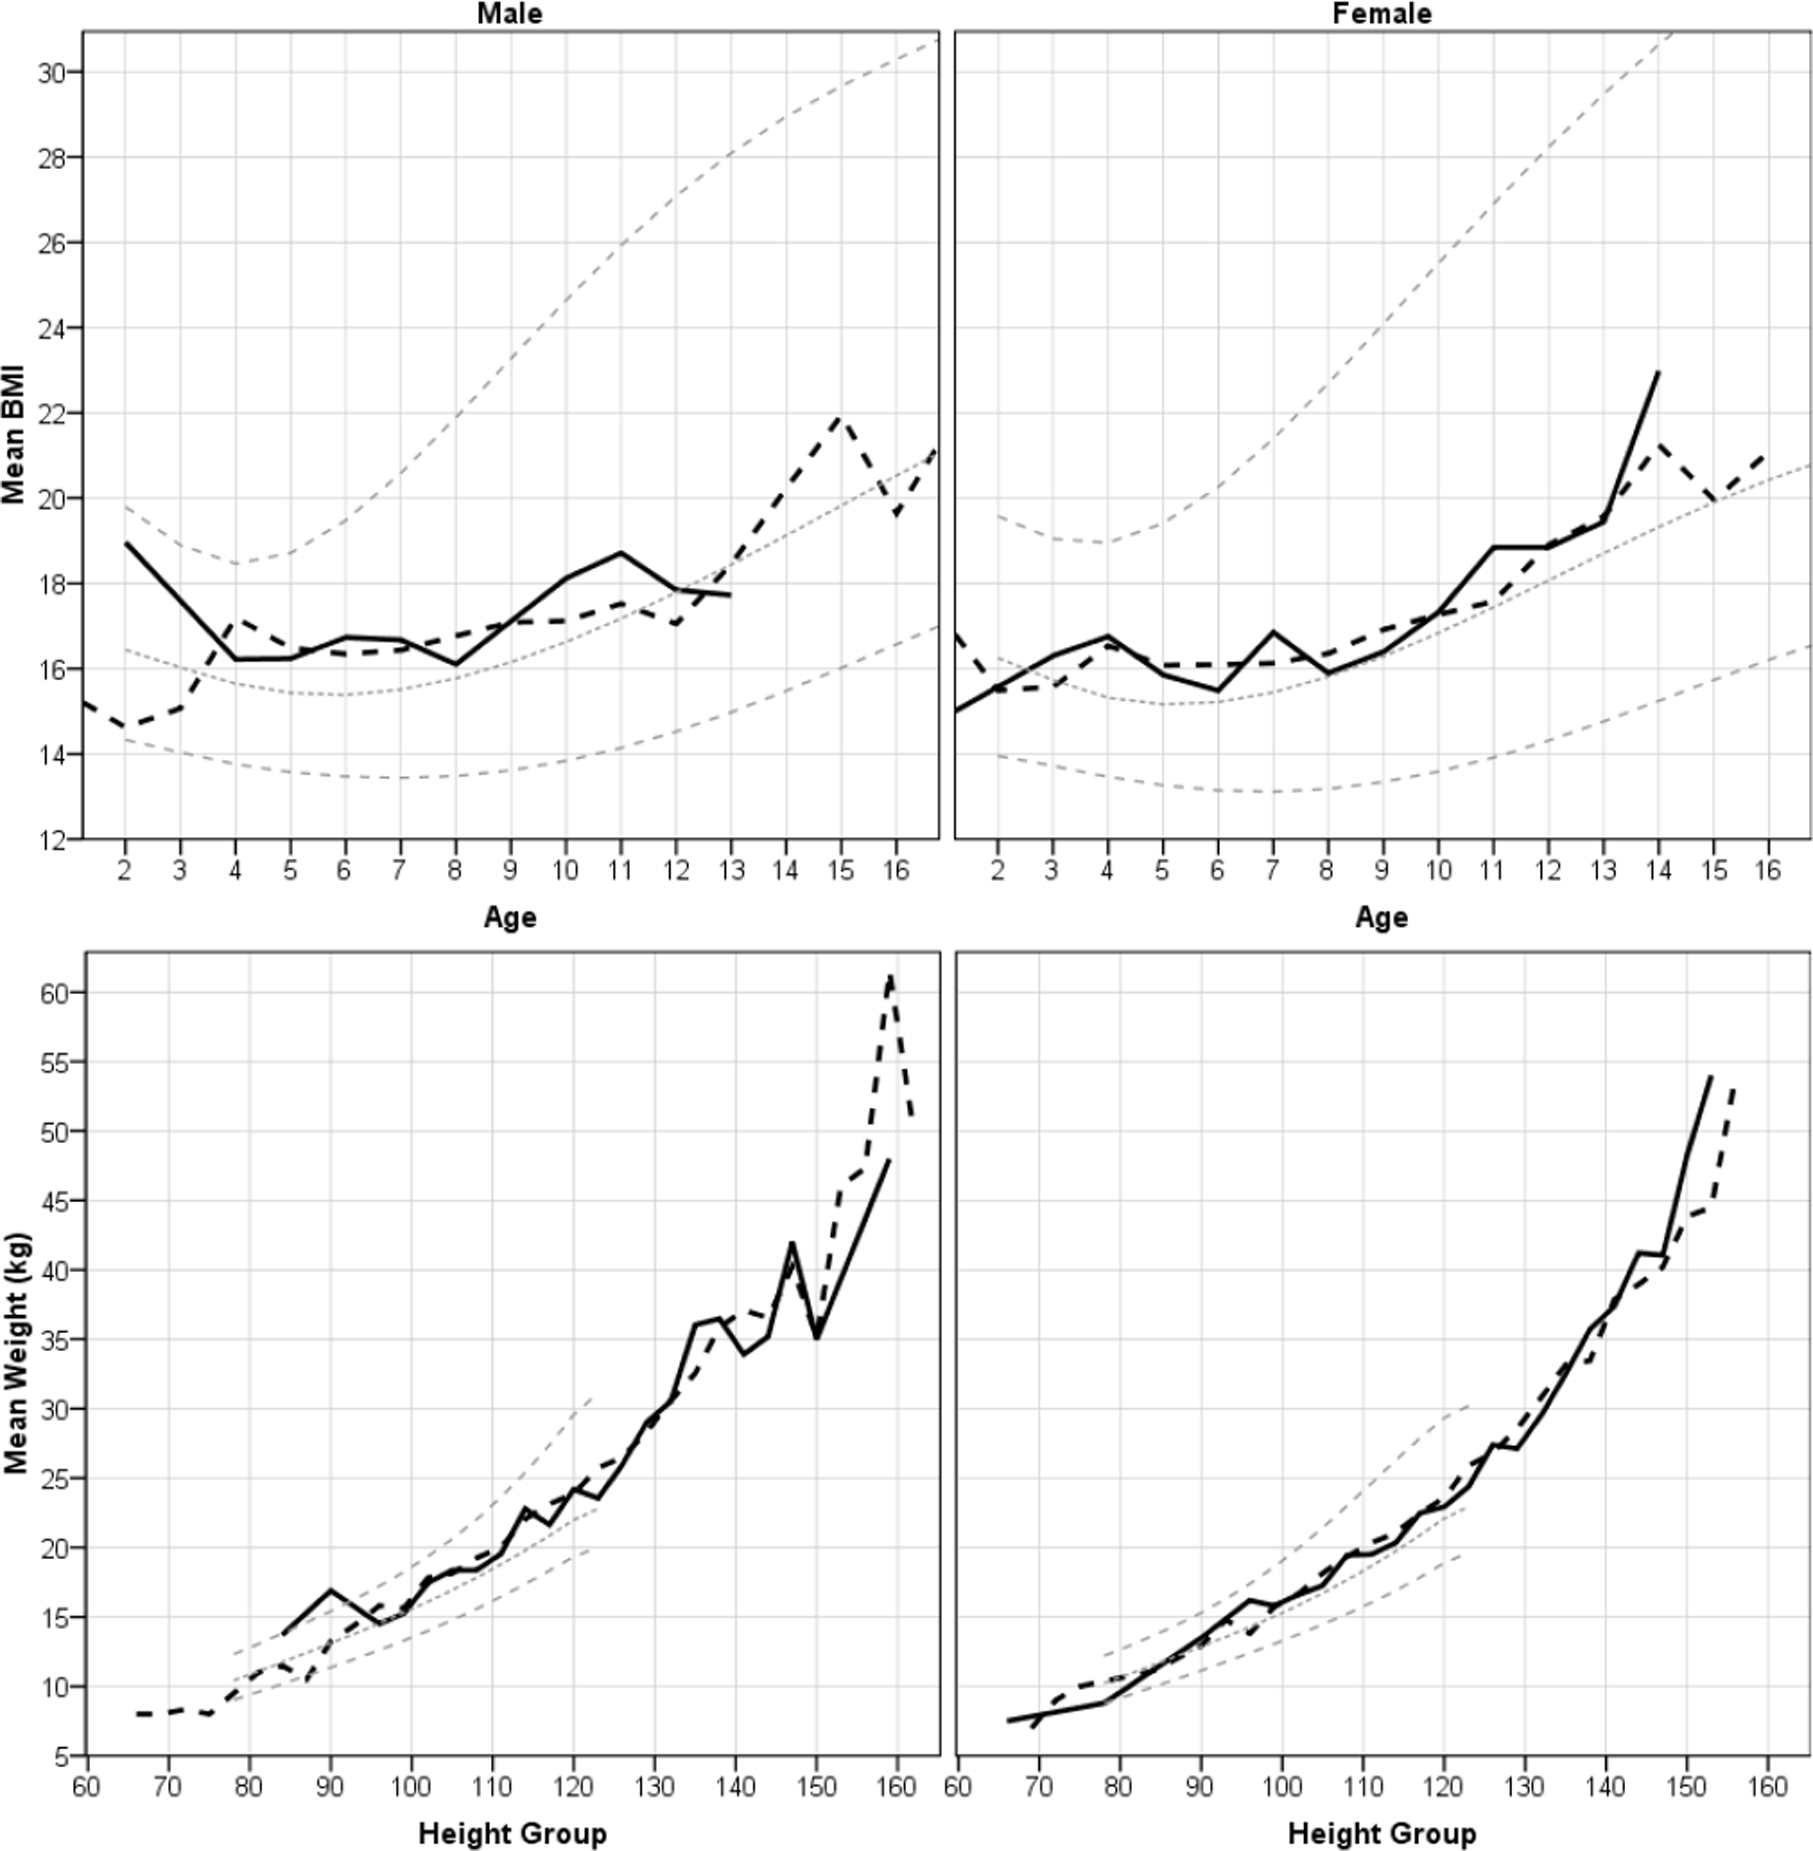
Mean BMI by yearly age cohort and weight by height for male and female colono (solid black line) and Shuar (long dashes) children. NHANES standard z-scores of 0, +2, and −2 are shown in gray. To smooth lines, ages were rounded down to the nearest year and heights to increments of 3 cm. See Tables 1 and 2 for sample sizes and cohort values.
Table 3.
Summary of growth outcome z-scores
| N | Percent z ≤ −2 | Percent z ≥ 2 | Mean z-score |
S.D. | t* | p** | |||
|---|---|---|---|---|---|---|---|---|---|
| Shuar | Males | Height-for-age | 674 | 41% | 0% | −1.73 | 1.15 | −39.12 | <0.01 |
| Weight-for-age | 672 | 14% | 0% | −0.95 | 1.16 | −21.26 | <0.01 | ||
| BMI-for-age | 671 | 6% | 2% | 0.18 | 1.40 | 3.29 | <0.01 | ||
| Weight-for-height | 398 | 8% | 3% | 0.41 | 1.39 | 5.90 | <0.01 | ||
| Females | Height-for-age | 612 | 38% | 0% | −1.68 | 1.21 | −34.30 | <0.01 | |
| Weight-for-age | 614 | 15% | 0% | −0.92 | 1.13 | −20.31 | <0.01 | ||
| BMI-for-age | 612 | 3% | 2% | 0.14 | 1.08 | 3.24 | <0.01 | ||
| Weight-for-height | 385 | 5% | 4% | 0.24 | 1.23 | 3.88 | <0.01 | ||
| Colono | Males | Height-for-age | 315 | 16% | 1% | −0.93 | 1.09 | −15.17 | <0.01 |
| Weight-for-age | 303 | 9% | 1% | −0.43 | 1.21 | −6.23 | 0.01 | ||
| BMI-for-age | 302 | 8% | 5% | 0.10 | 1.39 | 1.25 | 0.21 | ||
| Weight-for-height | 143 | 7% | 6% | 0.25 | 1.31 | 2.25 | 0.03 | ||
| Females | Height-for-age | 241 | 20% | 0% | −0.98 | 1.14 | −13.42 | <0.01 | |
| Weight-for-age | 230 | 12% | 0% | −0.54 | 1.16 | −7.00 | <0.01 | ||
| BMI-for-age | 229 | 7% | 1% | 0.02 | 1.33 | 0.26 | 0.80 | ||
| Weight-for-height | 116 | 6% | 2% | 0.06 | 1.19 | 0.55 | 0.58 |
A one-sample t-test was used to determine whether mean z-scores differed significantly from zero.
P-values are 2-tailed
Comparing males and females, there were no significant differences in mean z-scores (all t-tests, p > 0.05). When we examine results by age cohorts, prevalence of stunting appears to increase with age, particularly in males (Table 1). Prevalence of wasting appears to decrease with age, and to be common only in children age under four (Table 1). To separate the effects of age and sex on Shuar z-scores, we used multiple ANCOVAs with age, sex, and an age by sex interaction term as independent variables. HAZ was found to decrease with age for both sexes (β = −0.08, t = −4.44, p < 0.01) as did WAZ (β = −0.04, t = −2.22, p = 0.03). WHZ increased with age for both sexes (β = 0.14, t = 3.43, p < 0.01). There was no significant effect of age on BAZ. The only significant main effect of sex was on WAZ, with males having higher z-scores than females (β = 0.51, t = 2.36, p = 0.02). For WAZ there was also a significant interaction between sex and age, with males decreasing more with age (β = −0.06, t = −2.56, p = 0.01). A similar, but not quite significant interaction was observed for HAZ (β = −0.05, t = −1.88, p = 0.06).
Colono children’s growth.
Mean colono growth measures by age cohort are shown in Table 2, and presented graphically in Figs. 2 and 3. Like the Shuar, colono children had mean HAZ and WAZ significantly below zero (Table 3). Only male colonos had mean WHZ significantly above zero (Table 3). Sixteen percent of colono males and 20% of colono females could be classified as stunted. Underweight was not very prevalent among colono children (9% for males and 12% for females). Low BMI was uncommon (8% for males, 7% for females) as was wasting (7% for males, 6% for females) (Table 3). No measured differences between male and female colonos were significant (all t-tests, p > 0.05).
Table 2.
Colono mean weight, height, BMI, and sample size by sex and yearly age cohort
| Height-for-age | Weight-for-age | BMI-for-age | Weight-for-height | ||||||||||||||
|---|---|---|---|---|---|---|---|---|---|---|---|---|---|---|---|---|---|
| Age | n | Mean (cm) | Mean z | % z ≤ −2 | Mean (kg) | Mean z | % z ≤ −2 | Mean BMI | Mean z | % z ≤ −2 | n | Mean z | % z ≤ −2 | ||||
| 0 | - | - | - | - | - | - | - | - | - | - | - | - | - | ||||
| 1 | - | - | - | - | - | - | - | - | - | - | - | - | - | ||||
| Males | 2 | 1 | 85.0 | −1.36 | 0% | 13.7 | 0.28 | 0% | 19.0 | 1.70 | 0% | 1 | 1.46 | 0% | |||
| 3 | - | - | - | - | - | - | - | - | - | - | - | - | - | ||||
| 4 | 14 | 101.6 | −0.71 | 7% | 16.8 | −0.22 | 7% | 16.2 | 0.39 | 0% | 14 | 0.22 | 0% | ||||
| 5 | 45 | 106.3 | −0.67 | 11% | 18.4 | −0.23 | 5% | 16.2 | 0.44 | 5% | 44 | 0.30 | 5% | ||||
| 6 | 30 | 112.7 | −0.59 | 10% | 21.4 | −0.08 | 11% | 16.7 | 0.33 | 12% | 24 | 0.20 | 13% | ||||
| 7 | 22 | 117.9 | −0.77 | 9% | 23.3 | −0.15 | 5% | 16.7 | 0.49 | 0% | 16 | 0.46 | 0% | ||||
| 8 | 81 | 123.3 | −0.85 | 11% | 24.6 | −0.60 | 9% | 16.1 | −0.26 | 10% | 33 | −0.10 | 15% | ||||
| 9 | 46 | 127.8 | −0.98 | 22% | 28.2 | −0.44 | 13% | 17.1 | −0.07 | 13% | 9 | 0.71 | 0% | ||||
| 10 | 31 | 131.2 | −1.19 | 26% | 31.3 | −0.40 | 7% | 18.1 | 0.28 | 3% | 1 | 1.06 | 0% | ||||
| 11 | 28 | 134.4 | −1.36 | 21% | 34.1 | −0.56 | 9% | 18.7 | 0.22 | 4% | - | - | - | ||||
| 12 | 14 | 137.7 | −1.63 | 43% | 33.8 | −1.20 | 25% | 17.8 | −0.33 | 17% | 1 | 1.51 | 0% | ||||
| 13 | 3 | 142.3 | −1.80 | 33% | 36.0 | −1.43 | 33% | 17.7 | −0.49 | 0% | - | - | - | ||||
| 14 | - | - | - | - | - | - | - | - | - | - | - | - | |||||
| 15 | - | - | - | - | - | - | - | - | - | - | - | - | - | ||||
| 16 | - | - | - | - | - | - | - | - | - | - | - | - | - | ||||
| 17 | - | - | - | - | - | - | - | - | - | - | - | - | - | - | |||
| Females | 0 | 1 | 65.0 | - | - | 7.5 | - | - | 17.8 | - | - | - | - | - | |||
| 1 | 1 | 77.0 | - | - | 8.8 | - | - | 14.8 | - | - | 1 | −1.94 | - | ||||
| 2 | - | - | - | - | - | - | - | - | - | - | - | - | - | ||||
| 3 | 1 | 91.0 | −0.82 | 0% | 13.5 | −0.27 | 0% | 16.3 | 0.46 | 0% | 1 | 0.16 | 0% | ||||
| 4 | 8 | 101.6 | −0.45 | 13% | 17.3 | 0.23 | 0% | 16.8 | 0.95 | 0% | 8 | 0.75 | 0% | ||||
| 5 | 39 | 107.0 | −0.36 | 5% | 18.2 | −0.16 | 5% | 15.9 | 0.31 | 8% | 37 | 0.12 | 8% | ||||
| 6 | 30 | 111.5 | −0.72 | 17% | 19.8 | −0.30 | 5% | 15.5 | −0.09 | 5% | 21 | −0.24 | 5% | ||||
| 7 | 23 | 116.3 | −1.05 | 22% | 23.1 | −0.20 | 9% | 16.9 | 0.50 | 5% | 19 | 0.35 | 5% | ||||
| 8 | 23 | 120.0 | −1.40 | 26% | 23.0 | −0.85 | 13% | 15.9 | −0.07 | 0% | 16 | −0.04 | 0% | ||||
| 9 | 49 | 127.6 | −0.92 | 20% | 26.9 | −0.75 | 19% | 16.4 | −0.44 | 13% | 10 | −0.48 | 20% | ||||
| 10 | 31 | 131.1 | −1.12 | 10% | 30.2 | −0.76 | 17% | 17.3 | −0.21 | 10% | 1 | 2.64 | 0% | ||||
| 11 | 16 | 135.3 | −1.24 | 13% | 34.7 | −0.56 | 13% | 18.8 | 0.29 | 0% | 1 | 1.55 | 0% | ||||
| 12 | 13 | 140.8 | −1.43 | 46% | 37.5 | −0.73 | 0% | 18.8 | 0.06 | 8% | - | - | - | ||||
| 13 | 7 | 137.9 | −2.77 | 86% | 37.1 | −1.47 | 43% | 19.4 | −0.12 | 0% | - | - | - | ||||
| 14 | 1 | 143.0 | −2.66 | 100% | 47.0 | −0.28 | 0% | 23.0 | 0.96 | 0% | - | - | - | ||||
| 15 | - | - | - | - | - | - | - | - | - | - | - | - | - | ||||
| 16 | - | - | - | - | - | - | - | - | - | - | - | - | - | ||||
| 17 | - | - | - | - | - | - | - | - | - | - | - | - | - | ||||
By age cohort, stunting becomes more prevalent in colono children with age (Table 2). Using multiple ANCOVAs as with the Shuar, HAZ decreased with age (β = −0.16, t = −5.57, p < 0.01) as did WAZ (β = −0.12, t = −3.57, p < 0.01). BAZ and WHZ were not significantly affected by age. However, there are few young colono children in the sample, which may obscure early wasting. There was no significant main effect of sex on any z-score, nor any significant interaction between sex and age.
Comparison between Shuar and colono children.
Fig. 2 suggests that Shuar children have lower weights-for-age and heights-for-age than colono children, regardless of sex or age. Fig. 3 suggests no systematic differences for BMI-for-age and weight-for-height. Statistical comparisons support these qualitative observations. We performed a series of ANCOVAs with age as a covariate, sex and ethnicity as factors, and all two and three way interactions included. Ethnicity had a significant main effect on HAZ (F = 23.19, 1 df, p < 0.01) and WAZ (F = 10.38, 1 df, p < 0.01), with colono children having higher z-scores on both. Age had a significant main effect on HAZ (F = 101.72, 1 df, p < 0.01), WAZ (F = 48.02, 1 df, p < 0.01), and BAZ (F = 18.27, 1 df, p < 0.01), all of which decreased with age for both Shuar and colono children. Age also had a significant main effect on WHZ, which increased with age (F = 6.84, 1 df, p = 0.01). For HAZ there was a nearly significant 3-way interaction between ethnicity, sex, and age (F = 3.28, 1 df, p =0.07) corresponding to a smaller age-related decrease in HAZ for Shuar females than for Shuar males or colonos of either sex. There was also a significant interaction between ethnicity and age on WHZ (F = 6.24, 1 df, p = 0.01) since Shuar increased in WHZ with age, whereas colono children did not.
To make these results more easily interpretable and to estimate the actual z-score differences associated with ethnicity, we performed separate ANCOVAs for males and females (Table 4). For males, the estimated HAZ difference between colonos and Shuar was 0.67, expressed in the model as the beta coefficient controlling for age and sex. For females the HAZ difference between colonos and Shuar was 1.32. Male Shuar and colonos did not differ in WAZ, but for females being a colono increased WAZ by 1.00. For both sexes age was related to decreases in HAZ and WAZ, and for males, BAZ (Table 4). However, being colono interacted with age, such that colono females had greater age related decreases in HAZ and WAZ than did Shuar females. Age was also related to increases in WHZ, but only for Shuar. Being colono interacted with age to cancel the overall age related increase in the model (Table 4).
Table 4.
ANCOVAs with NHANES z-scores as dependent variables
| Males | Females | |||||||||||||
|---|---|---|---|---|---|---|---|---|---|---|---|---|---|---|
| Dependent | Parameter | β | β 95% CI | SE | t | p | β | β 95% CI | SE | t | p | |||
| Height-for-age | Intercept | −0.64 | (−0.92 | −0.36) | 0.14 | −4.48 | <0.01 | −0.99 | (−1.31 | −0.68) | 0.16 | −6.12 | <0.01 | |
| Colono vs. Shuar | 0.67 | (0.13 | 1.21) | 0.27 | 2.45 | 0.01 | 1.32 | (0.71 | 1.94) | 0.31 | 4.23 | <0.01 | ||
| Age | −0.13 | (−0.16 | −0.10) | 0.02 | −7.99 | <0.01 | −0.08 | (−0.12 | −0.05) | 0.02 | −4.39 | <0.01 | ||
| Colono × Age | 0.01 | (−0.05 | 0.07) | 0.03 | 0.28 | 0.78 | −0.08 | (−0.15 | −0.01) | 0.04 | −2.16 | 0.03 | ||
| Weight-for-age | Intercept | −0.08 | (−0.38 | 0.22) | 0.15 | −0.54 | 0.59 | −0.59 | (−0.90 | −0.28) | 0.16 | −3.78 | <0.01 | |
| Colono vs. Shuar | 0.38 | (−0.20 | 0.96) | 0.30 | 1.29 | 0.20 | 1.00 | (0.39 | 1.60) | 0.31 | 3.24 | <0.01 | ||
| Age | −0.10 | (−0.14 | −0.07) | 0.02 | −5.98 | <0.01 | −0.04 | (−0.08 | 0.00) | 0.02 | −2.22 | 0.03 | ||
| Colono × Age | 0.01 | (−0.06 | 0.08) | 0.04 | 0.30 | 0.76 | −0.08 | (−0.15 | 0.00) | 0.04 | −2.10 | 0.04 | ||
| BMI-for-age | Intercept | 0.77 | (0.41 | 1.13) | 0.18 | 4.20 | 0.00 | 0.40 | (0.08 | 0.71) | 0.16 | 2.46 | 0.01 | |
| Colono vs. Shuar | −0.07 | (−0.77 | 0.64) | 0.36 | −0.18 | 0.85 | 0.18 | (−0.44 | 0.80) | 0.32 | 0.56 | 0.58 | ||
| Age | −0.07 | (−0.11 | −0.03) | 0.02 | −3.38 | <0.01 | −0.03 | (−0.07 | 0.01) | 0.02 | −1.66 | 0.10 | ||
| Colono × Age | −0.01 | (−0.09 | 0.08) | 0.04 | −0.14 | 0.89 | −0.04 | (−0.11 | 0.04) | 0.04 | −0.99 | 0.32 | ||
| Weight-for-height | Intercept | −0.66 | (−1.22 | −0.11) | 0.28 | −2.34 | 0.02 | −0.71 | (−1.24 | −0.18) | 0.27 | −2.65 | 0.01 | |
| Colono vs. Shuar | 0.92 | (−0.16 | 1.99) | 0.55 | 1.68 | 0.09 | 0.74 | (−0.32 | 1.80) | 0.54 | 1.37 | 0.17 | ||
| Age | 0.16 | (0.08 | 0.24) | 0.04 | 3.92 | <0.01 | 0.14 | (0.06 | 0.22) | 0.04 | 3.65 | <0.01 | ||
| Colono × Age | −0.16 | (−0.32 | 0.00) | 0.08 | −1.93 | 0.05 | −0.13 | (−0.29 | 0.03) | 0.08 | −1.62 | 0.11 | ||
Comparison with a sample of Shiwiar children
Data on a small sample of Shiwiar children was available for comparison with Shuar and colono children. The sample included 42 Shiwiar children under age 18, including 25 males and 16 females. Since the sample is small we did not have enough power to provide useful Shiwiar data by age as sex cohort, as was done with the Shuar and Shiwiar data. However, the sample is sufficient to make age and sex controlled comparisons between ethnic groups.
We used ANCOVA to estimate the mean z-score differences between Shiwiar and the other two groups of children while controlling for age and sex differences in the two samples. Shuar had significantly lower z-scores than Shiwiar in HAZ (β = −0.84, t = −3.40, p < 0.01) and WAZ (β = −0.75, t = −3.88, p <0.01), but colono and Shiwiar did not differ significantly from one another in either measure. In contrast, Shuar and Shiwiar did not differ significantly in BAZ, while there was a trend for colono children to be lower in BAZ than Shiwiar (β = −0.54, t = −1.83, p = 0.07). Colono children were also significantly lower than Shiwiar in WHZ (β = −0.89, t = −2.03, p = 0.04). There was also a trend for Shuar children to have lower WHZ than Shiwiar (β = −0.78, t = −1.80, p = 0.07).
Finally, we used logistic regression to calculate odds-ratios (OR) for effects of age, ethnicity, and sex on likelihood of z-scores ≤ −2 for the four growth measures, comparing all three ethnic groups (Table 5). Ethnicity had a significant impact on the likelihood of stunting, with colono children being about three times less likely to be stunted than Shuar children (OR = 0.33; CI: 0.26 – 0.43, p < 0.01) and Shiwiar children being about eight times less likely to be stunted than Shuar (OR = 0.13, CI: 0.03 – 0.56, p = 0.01).
Table 5.
Binary logistic regressions
| Dependent | Factor | OR | 95% C.I. for OR | p | |
|---|---|---|---|---|---|
| Lower | Upper | ||||
| Stunting | Colono vs. Shuar | 0.33 | 0.26 | 0.43 | <0.01 |
| (Low height-for-age) | Shiwiar vs. Shuar | 0.13 | 0.03 | 0.56 | 0.01 |
| Male vs. Female | 1.06 | 0.86 | 1.29 | 0.59 | |
| Age (per year) | 1.17 | 1.13 | 1.22 | <0.01 | |
| Constant | 0.17 | <0.01 | |||
| Low weight-for-age | Colono vs. Shuar | 0.71 | 0.52 | 0.98 | 0.04 |
| Shiwiar vs. Shuar | 0.31 | 0.07 | 1.31 | 0.11 | |
| Male vs. Female | 0.93 | 0.71 | 1.23 | 0.62 | |
| Age (per year) | 1.11 | 1.06 | 1.18 | <0.01 | |
| Constant | 0.07 | <0.01 | |||
| Low BMI-for-age | Colono vs. Shuar | 1.45 | 0.95 | 2.20 | 0.09 |
| Shiwiar vs. Shuar | 1.06 | 0.14 | 8.09 | 0.96 | |
| Male vs. Female | 1.65 | 1.08 | 2.51 | 0.02 | |
| Age (per year) | 0.91 | 0.83 | 0.99 | 0.03 | |
| Constant | 0.08 | <0.01 | |||
| Wasting | Colono vs. Shuar | 0.87 | 0.49 | 1.55 | 0.64 |
| (Low weight-for-height) | Shiwiar vs. Shuar | 0.00 | 0.00 | . | 1.00 |
| Male vs. Female | 1.41 | 0.85 | 2.35 | 0.18 | |
| Age (per year) | 0.74 | 0.63 | 0.86 | <0.01 | |
| Constant | 0.42 | 0.12 | |||
DISCUSSION
Our results describe the growth of three distinct but related ethnic groups living in the Ecuadorian Amazon: Upano Valley Shuar living in relatively acculturated circumstances, colonos living in the same geographical area as many of the Shuar considered, and Shiwiar living traditionally. Although the Shiwiar sample is limited, the Shuar and colono samples are both large and likely accurate. Measurements were taken by medical teams composed of doctors and nurses, and data collection was observed first hand by Sugiyama for a sample of communities. The ages of children are also likely to be accurate, since these children attend school and records exist for their birth dates. While it is worth noting that ages given in school records were not re-checked against birth records to verify accuracy, the children themselves and/or their siblings served as a cross-check on the accuracy of the recorded ages.
Despite the large sample, the Shuar and colono samples do have some limitations which should be noted. First, the use of standard bathroom scales and tape measures may have introduced some errors relative to more accurate instruments. Second, the ages represented in the sample are limited. There are very few children younger than four or older than thirteen in the sample. Thus, the sample is not very informative with regard to the timing of adolescent growth, nor with regard to growth in the first few years of life. These limitations should be taken into account when drawing conclusions from this data.
The strongest finding from this study is that Shuar children have higher prevalence of stunting than either of the other two groups considered. About 40% of the Shuar children in this study were classified as stunted. In contrast, only about 18% of the colono children had z-scores indicative of stunting. The odds of stunting for Shuar were three times greater than the odds for stunting for colonos and eight times the odds for the Shiwiar. In terms of z-scores, Shuar were exceeded by both colono and Shiwiar. Shuar also had relatively high levels of underweight for age, around 15%. This is higher than the 6.2% reported for Ecuador as a whole (World Health Organization, 2007), but lower than the median prevalence of 22.8% reported for the entirety of Latin America (Victora, 1992).
Human growth is highly plastic and growth in height is strongly influenced by environmental and social factors which impact nutrition and disease (Benefice et al., 2006; Bogin, 1999; Bogin & Loucky, 1997; Bronte-Tinkew & DeJong, 2004; Foster et al., 2005; Godoy et al., 2008; Johnston, 2002; Leonard et al., 2000; Norgan, 2002; Schell & Knutsen, 2002; Victora, 1992; Walker et al., 1996). For example, rainfall during early childhood has been linked to adult height outcomes in Bolivia (Godoy et al., 2008) and a number of factors, including maternal schooling, indigenous status, tuber consumption, maternal fertility, and economic inequality correlate with height across a broad sample in Ecuador (Larrea & Kawachi, 2005). Among Shuar, tradeoffs have been found between family size and the height and weight of offspring (Hagen et al., 2006). Therefore differences between colono, Shuar, and Shiwiar are likely attributable to cultural and environmental differences, rather than genetic factors. This is particularly likely to be the case for the comparison between Shiwiar and Shuar children who are ethnically and culturally linked, but who experience different degrees of acculturation based on their geographical proximity to market economies and availability traditional resources such as forest game. Further evidences comes from comparison with the Achuar, who are closely related to the Shuar, and of which the Shiwiar we report on can be considered a less acculturated subgroup. Among male Achuar under age seventeen, 29% of males and 19% of females were stunted (Orr et al., 2001), compared to 41% of male and 38% of female Shuar in this study.
The high prevalence of stunting among Upano Valley Shuar is comparable to the prevalence reported for many other South American groups. Among the Tsimane of Bolivia, prevalences of stunting between 40–50% have been reported (Benefice et al., 2006; Foster et al., 2005). In Ecuador as a whole, 25–30% of children under age five are reported to be stunted, with a prevalence of 58% for all indigenous groups combined (Larrea & Kawachi, 2005; World Health Organization, 2007). In contrast, Shuar prevalence of stunting is considerably lower than that for other indigenous South American groups, such as the Tukanoan of Columbia (Orr et al., 2001) and Chachi of Ecuador (Stinson, 1989), both of which have stunting prevalence ranging from 70%−82%.
It has been suggested that the Achuar have relatively low levels of stunting because they have one of the highest protein intakes recorded among native Amazonians (Descola, 1994; Orr et al., 2001; Sugiyama & Chacon, 2000). The fact that Upano Valley Shuar have higher levels of stunting suggests that acculturation is negatively impacting protein levels, perhaps by replacing hunted food with more tubers, rice, and other carbohydrate rich foods, or with purchased sources of protein that are infrequently available. Although at present we do not have quantitative data to test this hypothesis, preliminary food frequency and open-ended interview data supports this view: in the Upano Valley hunting is relatively infrequent, game is scarce, and purchased meats infrequent in the diet. Acculturation may also decrease traditional activities such as the sharing of meat between families, such as has occurred among the Tsimane (Brabec et al., 2007).
Considering the overall prevalences of wasting in all three ethnic groups we found few surprises. Wasting and low BMI-for-age were uncommon in all three groups, affecting < 8% of children. This pattern of high stunting prevalence with low prevalence of wasting is common across Latin America (Godoy et al., 2005). Victora (1992) compiled 37 studies from Latin America and found that the median prevalence of stunting was 34% whereas the median prevalence of wasting was only 3%. However, Shuar prevalences of wasting are strongly linked to age and are much higher in younger age cohorts, particularly those under five. This could be the product of sampling bias, since our sample of Shuar under age five is small and we lack a complete comparative sample of young colono or Shiwiar. However, two things lead us to suspect this finding may be real. First, there is a steady decrease in wasting prevalence with age, suggesting a consistent pattern. Second, both male and female Shuar show similar patterns of stunting. Nevertheless, these patterns could be the result of consistent bias, for example if sick children were more likely to be included due to parents bringing them to see the doctors and nurses during data collection. Thus, any conclusions about wasting in young Shuar children should be considered tentative.
It is frequently suggested that stunting represents chronic undernutrition or pathogen costs, whereas wasting is an indicator of short term lack, since weight can fluctuate over relatively short periods of time (Fernandez et al., 2002; Walker et al., 1996). Thus, wasting and underweight are seen as preceding stunting. However, some, such as Victora (1992) argue against this simple picture, suggesting that stunting and wasting may have distinct etiologies based on limiting factors besides energy availability, such as the availability of specific nutrients.
Our results support this view, at least in terms of the short-term connection between stunting and wasting. For the Shuar in our sample, HAZ is negatively correlated with WHZ (r = −0.14, p < 0.01), suggesting that the same individuals are not both stunted and wasted. This is largely due to fact that HAZ decreases with age, while WHZ increases. Controlling for age and sex, HAZ and WHZ are not significantly correlated (r = −0.04, p = 0.28). If stunting were the consequence of persistent or repeated periods of wasting, we would expect a positive correlation, albeit possibly a weak one. Since the age-related patterns of wasting and stunting are opposite to one another, either separate factors must limit height growth and weight growth or the connection between stunting and wasting must be long-term rather than short-term.
For example, stunting might result from insults during sensitive periods, such as during infancy or weaning. Considered by itself, stunting does not appear to be the effect of insults early in life, since height-for-age z-scores decrease with age. However, considered with weight-for-height z-scores this seems plausible. Early wasting might lead to later stunting by shifting the long-term allocation of energy away from height growth and towards weight growth. It seems possible that natural selection has shaped the way such tradeoffs are negotiated, much as it has shaped the tradeoffs between other life history demands. We might also predict differences in allocation tradeoffs when comparing populations, due to differing costs and benefits of increased height and weight due to differing local ecologies. For Shuar and most of South America, weight growth appears to be prioritized over height growth since stunting is reported to be prevalent, while wasting and underweight are uncommon.
Why should this be the case? We can think of several possible explanations, although at present cannot support one over the other. Climate likely plays a role in shaping target body shapes (Bindon & Baker, 1997; Katzmarzyk & Leonard, 1998; Roberts, 1978; Ruff, 1993; Schell & Knutsen, 2002). In warm, dry climates, such as those found in parts of Africa, height growth may be prioritized over weight growth in order to achieve the long shape that best dissipates heat (Roberts, 1978; Ruff, 1993). In warm, humid environments, such as that found in the Amazon, the opposite may be true: a small body size may be beneficial since heat will be more difficult to dissipate, minimizing the benefits of height growth (Diamond, 1991; Schell & Knutsen, 2002; Stinson, 1990; Stinson, 2000). However, stunting is not limited to Amazonian populations; it is common across South American in diverse ecologies, including high altitude Andean and coastal populations (e.g. Stinson, 1980; Greksa et al., 1984; Leonard et al., 1990). Thus, it may be that for these populations it is the absence of selection for height that makes increased height “optional”, rather than any positive selection for small body size. In populations with strong positive selection for height, such as the dry, hot savannas of East Africa, height may be “conserved”, leading to increased relative prevalence of wasting instead of stunting.
A small body size may also be the result of life history tradeoffs between growth and reproduction—by terminating growth earlier, reproduction can begin earlier. Early termination of growth should be selected for in populations with high extrinsic mortality and short life expectancies (Migliano et al., 2007; Walker et al., 2006). Targeting energy into gain in weight rather than gain in height may also facilitate early reproduction due to early accumulation of the energy stores needed to reproduce. Such effects may be exaggerated by population history of resource stress and selection for so-called thrifty genes, which prioritize energy stores and thus weight growth (Bindon & Baker, 1997). Finally, if Shuar weight is primarily lean body mass (muscle), it may be that arduous work effort is better supported by relatively muscular short bodies than tall thin ones, particularly in neo-tropical forest populations. For instance, Hill & Hurtado (1996) find an inverted U-shaped relationship (skewed toward the high end) between foraging returns and Ache male height.
While one or more of these factors may explain why Jivaroan children, in general, have slow height growth relative to weight growth, they are insufficient to explain the differences observed between Shuar, Shiwiar, and colono children, since these populations (with the possible exception of colono, whose ethnic history is less defined) are thought to be genetically similar with similar adaptive histories. To explain these differences multiple levels of explanation are needed. On an ultimate level, population adaptation to climate or resource availability may explain why height growth suffers more than weight growth under limiting conditions. These ultimate explanations still require proximate explanations for differences in resources between these populations, such as change in market integration.
Although this study benefits from its large sample sizes, future studies will need to address growth at both levels of explanation. Although our data suggests that market integration is negatively impacting growth in Shuar children, until data is available on diet, activity, pathogen exposure, and life histories, no conclusive statements can be made about the mechanisms causing these outcomes. Only with detailed, integrated data on all of these factors across a range of ecological conditions will we be able to parse out the competing environmental and demographic demands affecting allocations of energy into weight gain, height gain, and maturation.
Acknowledgments
We thank the doctors and nurses of the Shuar Federation and Ecuadorian Health Area #6 for their collaboration, our undergraduate assistants, two anonymous reviewers and J. Josh Snodgrass for helpful comments on this paper, and the Shuar, Shiwiar, and colonos who helped to make this work possible.
Research sponsored by: NIH 5DP1O000516-04 to Leda Cosmides at the UCSB Center for Evolutionary Psychology; James S. McDonnell Foundation and NSF BNS9157-449 to John Tooby; Fulbright Foundation, Wenner-Gren Foundation, UO Anthropology Department and UO Office of Research Grants to Larry Sugiyama; Ryoichi Sasakawa Young Leaders Fellowship, UO Anthropology Department, and UO Institute of Cognitive and Decision Sciences Research Grants to Aaron Blackwell; and the Ministerio de Salud Pública de Morona Santiago, Ecuador.
LITERATURE CITED
- Baker P, Hanna J, Baker T. 1986. The Changing Samoans: Behavior and Health in Transition. Oxford University Press. [Google Scholar]
- Benefice E, Monroy S, Jiménez S, López R. 2006. Nutritional status of Amerindian children from the Beni River (lowland Bolivia) as related to environmental, maternal and dietary factors. Public Health Nutrition 9:327–335. [DOI] [PubMed] [Google Scholar]
- Bermudez O, Tucker K. 2003. Trends in dietary patterns of Latin American populations. Cadernos de Saúde Pública 19:87–99. [DOI] [PubMed] [Google Scholar]
- Bindon JR, Baker PT. 1997. Bergmann’s rule and the thrifty genotype. Am J Phys Anthropol 104:201–210. [DOI] [PubMed] [Google Scholar]
- Bogin B 1999. Patterns of human growth. Cambridge University Press, Cambridge, U.K. New York. [Google Scholar]
- Bogin B, Loucky J. 1997. Plasticity, political economy, and physical growth status of Guatemala Maya children living in the United States. Am J Phys Anthropol 102:17–32. [DOI] [PubMed] [Google Scholar]
- Box G, Cox D. 1964. An analysis of transformations. Journal of the Royal Statistical Society, Series B 26:211–252. [Google Scholar]
- Brabec M, Godoy R, Reyes-Garcia V, Leonard W. 2007. BMI, income, and social capital in a native Amazonian Society: Interaction between relative and community variables. Am J Hum Bio 19:474. [DOI] [PubMed] [Google Scholar]
- Bronte-Tinkew J, DeJong G. 2004. Children’s nutrition in Jamaica: do household structure and household economic resources matter? Soc Sci Med 58:499–514. [DOI] [PubMed] [Google Scholar]
- Cole TJ. 1990. The LMS method for constructing normalized growth standards. Eur J Clin Nutr 44:45–60. [PubMed] [Google Scholar]
- Descola P 1994. In the society of nature: a native ecology in Amazonia. Cambridge University Press, Cambridge [England]; New York. [Google Scholar]
- Descola P 1996. The spears of twilight: life and death in the Amazon jungle. New Press, New York. [Google Scholar]
- Diamond J 1991. Why are pygmies small? Nature 354:111–112. [DOI] [PubMed] [Google Scholar]
- Fernandez I, Himes J, Onis M. 2002. Prevalence of nutritional wasting in populations: building explanatory models using secondary data. Bulletin of the World Health Organization 80:282–291. [PMC free article] [PubMed] [Google Scholar]
- Foster Z, Byron E, Reyes-García V, Huanca T, Vadez V, Apaza L, Pérez E, Tanner S, Gutierrez Y, Sandstrom B, Yakhedts A, Osborn C, Godoy R, Leonard W. 2005. Physical growth and nutritional status of Tsimane’ Amerindian children of lowland Bolivia. Am J Phys Anthropol 126:343–351. [DOI] [PubMed] [Google Scholar]
- Friedlaender J, Howells W, Rhoads J. 1987. The Solomon Islands Project: A Long-Term Study of Health, Human Biology, and Culture Change. Oxford University Press, USA. [Google Scholar]
- Godoy R, Reyes-García V, Byron E, Leonard W, and Vadez V. 2005. The effect of market economies on the well-being of indigenous peoples and on their use of renewal natural resources. Ann Rev Anthropol 34:121–138. [Google Scholar]
- Godoy R, Tanner S, Reyes-García V, Leonard WR, Mcdade TW, Vento M, Broesch J, Fitzpatrick IC, Giovannini P, Huanca T, Jha N, Bolivian TAPS Study Team. 2008. The effect of rainfall during gestation and early childhood on adult height in a foraging and horticultural society of the Bolivian Amazon. Am J Hum Bio 20:23–34. [DOI] [PubMed] [Google Scholar]
- Greksa LP, Spielvogel H, Paredes-Fernandez L, Paz-Zamora M, Caceres E. 1984. Physical growth of urban children at high altitude. Am J Phys Anthropol 65:315–322. [DOI] [PubMed] [Google Scholar]
- Hagen EH, Barrett HC, Price ME. 2006. Do human parents face a quantity-quality tradeoff?: Evidence from a Shuar community. Am J Phys Anthropol 130:405–418. [DOI] [PubMed] [Google Scholar]
- Harner MJ. 1984. The Jívaro, people of the sacred waterfalls. University of California Press, Berkeley. [Google Scholar]
- Hill K, Hurtado AM. 1996. Aché life history: the ecology and demography of a foraging people. Aldine de Gruyter, New York. [Google Scholar]
- Huss-Ashmore R, Schall J, Hediger M. 1992. Health and lifestyle change. MASCA, The University Museum of Archaeology and Anthropology, University of Pennsylvania. [Google Scholar]
- Johnston FE. 2002. Social and Economic Influences on Growth and Secular Trends In Cameron N, editor. Human growth and development. Academic Press, San Diego, Calif: p 197–212. [Google Scholar]
- Karsten R 1935. The Head-Hunters of Western Amazonas: The Life and Culture of the Jibaro Indians of Eastern Ecuador and Peru. Societas Scientiarum Fennica. [Google Scholar]
- Katzmarzyk P, Leonard W. 1998. Climatic influences on human body size and proportions: Ecological adaptations and secular trends. Am J Phys Anthropol 106:483–503. [DOI] [PubMed] [Google Scholar]
- Larrea C, Kawachi I. 2005. Does economic inequality affect child malnutrition? The case of Ecuador. Soc Sci Med 60:165–178. [DOI] [PubMed] [Google Scholar]
- Leonard WR, Leatherman TL, Carey JW, Thomas RB. 1990. Contributions of nutrition versus hypoxia to growth in rural Andean populations. Am J Hum Biol 2:613–626. [DOI] [PubMed] [Google Scholar]
- Leonard W, Dewalt K, Stansbury J, McCaston M. 2000. Influence of dietary quality on the growth of highland and coastal Ecuadorian children. Am J Hum Bio 12:825–837. [DOI] [PubMed] [Google Scholar]
- Lindgarde F, Vessby B, Ahren B. 2006. Serum cholesteryl fatty acid composition and plasma glucose concentrations in Amerindian women. Am J Clin Nutrition 84:1009. [DOI] [PubMed] [Google Scholar]
- Lindgarde F, Widen I, Gebb M, Ahren B. 2004. Traditional versus agricultural lifestyle among Shuar women of the Ecuadorian Amazon: effects on leptin levels. Metabolism 53:1355–1358. [DOI] [PubMed] [Google Scholar]
- Lu F 2007. Integration into the Market among Indigenous Peoples: A Cross‐Cultural Perspective from the Ecuadorian Amazon. Current Anthropology 48:593–602. [Google Scholar]
- Migliano A, Vinicius L, Lahr M. 2007. Life history trade-offs explain the evolution of human pygmies. PNAS 104:20216. [DOI] [PMC free article] [PubMed] [Google Scholar]
- Norgan NG. 2002. Nutrition and Growth In Cameron N, editor. Human growth and development. Academic Press, San Diego, Calif: p 139–164. [Google Scholar]
- Orr CM, Dufour DL, Patton JQ. 2001. A comparison of anthropometric indices of nutritional status in Tukanoan and Achuar Amerindians. Am J Hum Bio 13:301–309. [DOI] [PubMed] [Google Scholar]
- Pavan L, Casiglia E, Braga L, Winnicki M, Puato M, Pauletto P, Pessina A. 1999. Effects of a traditional lifestyle on the cardiovascular risk profile: the Amondava population of the Brazilian Amazon. Comparison with matched African, Italian and Polish populations. J Hypertens 17:749–756. [DOI] [PubMed] [Google Scholar]
- Popkin BM. 2004. The Nutrition Transition: An Overview of World Patterns of Change. Nutrition Reviews 62:140–143. [DOI] [PubMed] [Google Scholar]
- Pozo J, Posligua R. 2006. Diagnostico de Salud de Las Comunidades Shuar y Achuar se Morona Santiago. Presentation to UNICEF, Ecuador. [Google Scholar]
- Rivera J, Barquera S, Gonzalez-Cossio T, Olaiz G, Sepulveda J. 2004. Nutrition transition in Mexico and in other Latin American countries. Nutrition Reviews 62:S149–S157. [DOI] [PubMed] [Google Scholar]
- Roberts D 1978. Climate and human variability. Menlo Park. [Google Scholar]
- Rubenstein S 2001. Colonialism, the Shuar Federation, and the Ecuadorian state. Environment and Planning D: Society and Space 19:263–293. [Google Scholar]
- Ruff CB. 1993. Climatic adaptation and hominid evolution: The thermoregulatory imperative. Evolutionary Anthropology 2:53–60. [Google Scholar]
- Schell LM, Knutsen KL. 2002. Environmental Effects on Growth In Cameron N, editor. Human growth and development. Academic Press, San Diego, Calif: p 165–196. [Google Scholar]
- Shephard R, Rode A. 1996. The health consequences of ‘modernization’: Evidence from circumpolar peoples. Cambridge University Press. [Google Scholar]
- Stinson S 1980. The physical growth of high altitude Bolivian Aymara children. Am J Phys Anthropol 52:377–385. [DOI] [PubMed] [Google Scholar]
- Stinson S 1989. Physical growth of Ecuadorian Chachi Amerindians. Am J Hum Biol 1:697–707. [DOI] [PubMed] [Google Scholar]
- Stinson S 1990. Variation in body size and shape among South American Indians. Am J Hum Bio 2:37–51. [DOI] [PubMed] [Google Scholar]
- Stinson S 2000. Growth Variation: Biological and Cultural Factors In Stinson S, Bogin B, Huss-Ashmore R, O’Rourke D, editors. Human biology: an evolutionary and biocultural perspective. Wiley, New York: p 425–464. [Google Scholar]
- Stirling M 1938. Historical and ethnographical material on the Jivaro Indians. Government Printing Office; Washington, D.C. [Google Scholar]
- Sugiyama LS. 2004. Illness, injury, and disability among Shiwiar forager-horticulturalists: implications of health-risk buffering for the evolution of human life history. Am J Phys Anthropol 123:371–389. [DOI] [PubMed] [Google Scholar]
- Sugiyama LS, Chacon R. 2000. Effects of illness and injury on foraging among the Yora and Shiwiar: pathology risk as adaptive problem In Cronk L, Chagnon N, Irons W, editors. Human behavior and adaptation: an anthropological perspective. Aldine, New York: p 371–395. [Google Scholar]
- Sugiyama LS, Scalise Sugiyama M. 2003. Social roles, prestige, and health risk: Social niche specialization as a risk-buffering strategy. Human Nature 14:165–190. [DOI] [PubMed] [Google Scholar]
- Victora C 1992. The Association between Wasting and Stunting: An International Perspective. J Nutr 122:1105. [DOI] [PubMed] [Google Scholar]
- Walker R, Gurven M, Hill K, Migliano H, Chagnon N, De Souza R, Djurovic G, Hames R, Hurtado AM, Kaplan H, Kramer K, Oliver WJ, Valeggia C, Yamauchi T. 2006. Growth rates and life histories in twenty-two small-scale societies. Am J Hum Bio 18:295–311. [DOI] [PubMed] [Google Scholar]
- Walker S, Grantham-McGregor S, Himes J, Powell C. 1996. Relationships between wasting and linear growth in stunted children. Acta Paediatr 85:666–669. [DOI] [PubMed] [Google Scholar]
- World Health Organization. 2007. World health statistics 2007. World Health Organization, Geneva. [Google Scholar]
- World Health Organization/Food and Agriculture Organization [WHO/FAO]. 2003. Diet, nutrition and the prevention of chronic diseases: overcoming impediments to prevention and control. WHO Technical Report Series 916. [PubMed] [Google Scholar]