Abstract
Background
β-catenin/T-cell factor 4 (TCF4) signaling is enhanced in ischemic heart disease in which ventricular tachycardia/fibrillation (VT/VF) occurs frequently. How this signaling links to arrhythmogenesis remains unclear.
Objective
To investigate the role of β-catenin gain of function in the development of arrhythmia.
Methods
A mouse model with conditional deletion of CTNNB1 exon 3 resulting in cardiac exon 3-deleted and stabilized β-catenin (β-catΔE3) was used to determine the role of β-catenin gain of function in the regulation of cardiac rhythm.
Results
Western blotting showed β-catΔE3 expression and significantly decreased NaV1.5 protein in CTNNB1 E3−/− and CTNNB1 E3+/− mouse hearts. Real-time qRT-PCR revealed significantly decreased NaV1.5 mRNA with no changes of Na+ channel β1 to β4 expression in these hearts. Immunofluorescence revealed accumulation of β-catΔE3 in the nuclei of CTNNB1 E3−/− cardiomyocytes. Immunohistochemistry demonstrated nuclear localization of β-catenin in cardiomyocytes which was associated with significantly decreased NaV1.5 mRNA in human ischemic hearts. Immunoprecipitation revealed that β-catΔE3 interacted with TCF4 in CTNNB1 E3−/− cardiomyocytes. Whole-cell recordings showed that Na+ currents and depolarization and amplitude of action potentials were significantly decreased in CTNNB1 E3−/− ventricular myocytes. Electrocardiogram recordings demonstrated that in mice with cardiac CTNNB1 E3−/− the QRS complex was prolonged and VT was induced by the Na+ channel blocker, flecainide. However, cardiac function, as determined by echocardiography and heart/body weight ratios, remained unchanged.
Conclusions
Enhancement of β-catenin/TCF4 signaling led to prolongation of the QRS complex and increase of susceptibility to VT by suppression of NaV1.5 expression and Na+ channel activity in mice.
Keywords: β-catenin, TCF4, NaV1.5, Na+ channel, cardiac arrhythmia
Introduction
Voltage-gated cardiac Na+ channel activity is mainly determined by the SCN5a-encoded NaV1.5 α subunit. The importance of this channel activity related to cardiac excitation and electrical conduction has been demonstrated in several studies. Genetic analysis revealed that SCN5a mutations cause inherited arrhythmogenic diseases, including long QT,1 Brugada syndrome2 and idiopathic ventricular fibrillation.3 Homozygous SCN5a deletion was lethal, while hemizygous SCN5a deletion led to ventricular tachycardia (VT) in mice.4, 5 Downregulation of NaV1.5 expression has been reported in mouse myocardial infarction6 and human heart failure. 7 In the latter, VT and ventricular fibrillation (VF) frequently occur and cause cardiac sudden death.8 Regulation of NaV1.5 expression at transcriptional, post-transcriptional, translational and post-translational levels has been studied as distinct mechanisms underlying cardiac Na+ channel activity,9 but a direct link of this regulation to cardiac arrhythmias remains challenging. Canonical Wnt/β-catenin signaling plays important roles in various physiological and pathological conditions, including embryonic development, apoptosis, stem cell differentiation, cell cycle arrest, oxidative stress, and heart failure.10–12 In the absence of a Wnt stimulus, β-catenin is constitutively degraded by the proteasome.13, 14 Cytoplasmic β-catenin forms a “destruction complex” with adenomatous polyposis coli (APC)/axin/casein kinase (CK)-1α/glycogen synthase kinase (GSK) 3β and is then phosphorylated and ubiquitinated.15 When Wnt signaling is activated, the β-catenin destruction complex is disassembled, which leads to stabilization of β-catenin. Stabilized β-catenin translocates to the nucleus and interacts with T-cell factor/lymphoid enhancer factor (TCF/LEF) to transcriptionally regulate gene expression.16 In vitro studies showed that β-catenin negatively regulates NaV1.5 expression by affecting SCN5a promoter activity,17, 18 and the GSK 3β inhibitor, lithium chloride, decreased NaV1.5 expression and Na+ channel activity by stabilizing β-catenin.17 The cardiac-specific deletion of CTNNB1 exon 3 (CTNNB1 E3−/−) mouse model showed enhancement of β-catenin/TCF4 signaling by increasing nuclear localization of β-catΔE3.19–21 β-catΔE3 lacking serine (Ser)/threonine (Thr) residues for phosphorylation by GSK 3β (Ser33, Ser37 and Thr 41) is resistant to phosphorylation and subsequent degradation.22 In this study, we used this conditional mouse model with β-catenin gain of function in cardiomyocytes to directly probe the effects of β-catenin/TCF4 signaling on NaV1.5 expression and Na+ channel activity in the regulation of cardiac electrical activity.
Methods
Experimental protocols
Mice were handled according to the National Institutes of Health (NIH) Guide for the Care and Use of Laboratory Animals. Experimental procedures were approved by the Animal Research Committee at the University of California, Los Angeles, and the Institutional Animal Care and Use Committee at the University of Washington. The use of human heart tissue in the study was approved by the University of Minnesota. The research was conducted in compliance with NIH research requirements. The methods/protocols used in the present study are detailed in the online Supplemental Material. Supplemental Figure S1 and S2 showed mouse genotyping results and measurement of the parameters of electrocardiogram (ECG). Primer sequences used to amplify the cDNA of the genes are as shown in Supplemental Table S1
Statistics
Results are presented as mean ± standard error (SE). The statistical significance of differences was assessed by using one-way ANOVA with Bonferroni post-hoc, two-way ANOVA, and Mann-Whitney tests, and Student’s t-test as indicated in the figure legends; the significance level was set at p value <0.05.
Results
Deletion of CTNNB1 exon 3 led to production of β-catΔE3 and decrease in cardiac NaV1.5 expression
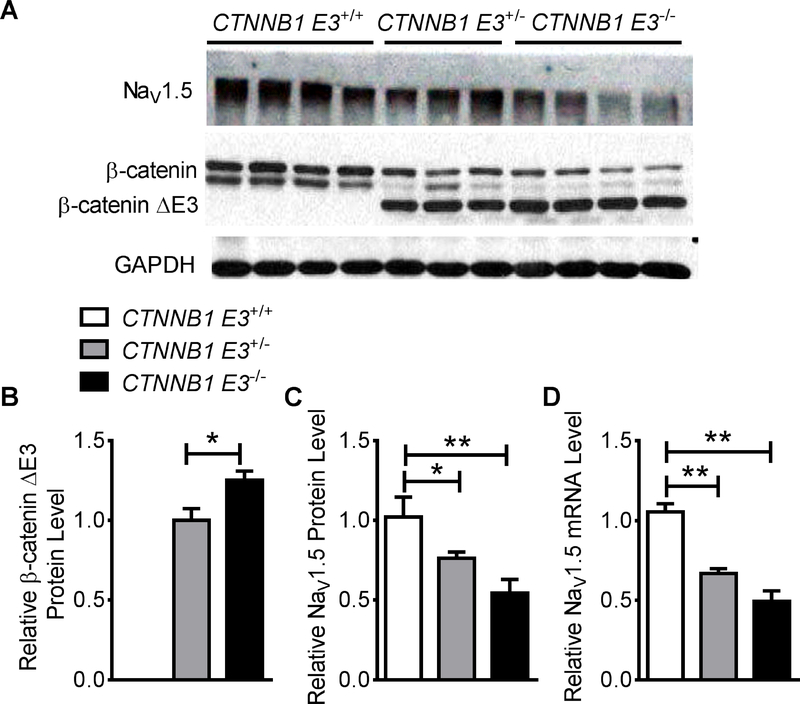
Western blotting was performed on protein extracts from CTNNB1 E3+/+, CTNNB1 E3+/− and CTNNB1 E3−/− mouse ventricles (MVs). The results showed β-catΔE3 expression in CTNNB1 E3+/− and CTNNB1 E3−/− MVs (Figure 1A). Mann-Whitney test analysis showed that β-catΔE3 protein was significantly increased (p<0.05) in CTNNB1 E3−/− compared to CTNNB1 E3+/− MVs (Figure 1B). NaV1.5 protein and mRNA were decreased in CTNNB1 E3+/− and CTNNB1 E3−/− MVs (Figure 1A, C and D). One-way ANOVA analysis showed that NaV1.5 protein and mRNA were significantly reduced (p<0.01) in CTNNB1 E3+/− and CTNNB1 E3−/− MVs compared to CTNNB1 E3+/+ MV (Figure 1C and D), and Bonferroni post-hoc test demonstrated that NaV1.5 protein and mRNA were significantly decreased (p<0.05 or p<0.01) in CTNNB1 E3+/− or CTNNB1 E3−/− MVs compared to CTNNB1 E3+/+ MV (Figure 1C and D). They were lower in CTNNB1 E3−/− MV but did not reach significance compared to CTNNB1 E3+/− MV (Figure 1C and D). One-way ANOVA analysis showed that mRNA levels of Na+ channel β1 to β4 subunits were not significantly different among CTNNB1 E3+/+, CTNNB1 E3+/− and CTNNB1 E3−/− MVs (Supplemental Figure S3).
Figure 1. Expression of β-catΔE3 decreases NaV1.5 expression in mouse hearts.
Western blot showing that β-catΔE3 is expressed in CTNNB1 E3+/− and CTNNB1 E3−/− MVs and NaV1.5 protein is decreased in CTNNB1 E3+/− and CTNNB1 E3−/− MVs (A). Mann-Whitney test showing that β-catΔE3 is significantly expressed (p<0.05) in CTNNB1 E3−/− (n=4) than CTNNB1 E3+/− MVs (n=3) (B). One-way ANOVA analyses showing that NaV1.5 protein and mRNA levels are significantly different (**p<0.01) among CTNNB1 E3+/+, CTNNB1 E3+/− and CTNNB1 E3−/− MVs (protein: CTNNB1 E3+/+; n=4; CTNNB1 E3+/−; n=3, CTNNB1 E3−/−, n=4; mRNA: CTNNB1 E3+/+; n=4; CTNNB1 E3+/−; n=4, CTNNB1 E3−/−; n=4); Bonferroni post-hoc test demonstrating that they are significantly decreased (*p<0.05 or **p<0.01) in CTNNB1 E3+/− and CTNNB1 E3−/− MVs compared to CTNNB1 E3+/+ MV, and they are further decreased in CTNNB1 E3−/− MV, but did not reach statistical significance compared to CTNNB1 E3+/− MV (C, D).
Deletion of CTNNB1 exon 3 led to accumulation of β-catΔE3 in the nuclei of cardiomyocytes
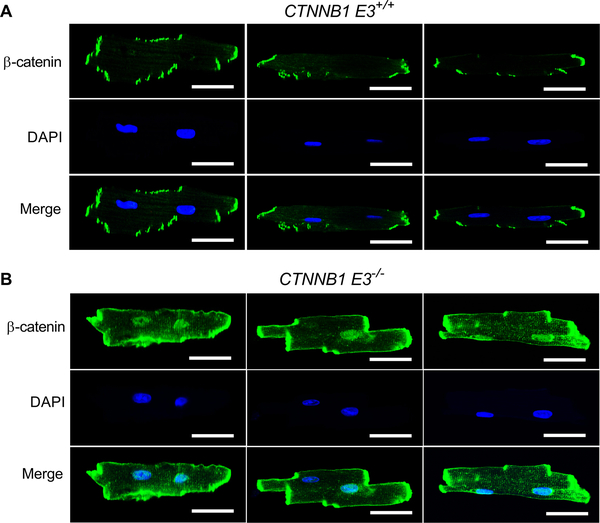
Immunofluorescence was performed on isolated CTNNB1 E3+/+ and CTNNB1 E3−/− ventricular myocytes (VMs) using a β-catenin antibody. Immunofluorescent staining revealed that there was increased nuclear localization of β-catenin in CTNNB1 E3−/− VMs compared to CTNNB1 E3+/+ VMs (Figure. 2A and B).
Figure 2. β-catΔE3 localizes in both nuclei and intercalated discs of cardiomyocytes.
Immunofluorescent staining showing that β-catenin is more localized in the nuclei and intercalated discs in CTNNB1 E3−/− VMs (B) than CTNNB1 E3+/+ VMs (A). Representative images from 3 sets of staining. Scale bar, 30 μm.
Decreased NaV1.5 expression was accompanied by nuclear accumulation of β-catenin in cardiomyocytes of human ischemic hearts
Immunohistochemical staining revealed increased nuclear accumulation of β-catenin in the cardiomyocytes of human hearts with ischemic heart disease (IHD) compared to non-failing hearts (NFHs) (Supplemental Figure S4A). These β-catenin positive nuclei were enlarged and had irregular contours (Supplemental Figure S4A). RNA was extracted from human hearts with IHD and NFHs, and real-time qRT-PCR assays showed that NaV1.5 mRNA was significantly decreased (p<0.05) in ischemic hearts compared to NFHs (Supplemental Figure S4B).
β-catΔE3 interacted with TCF4
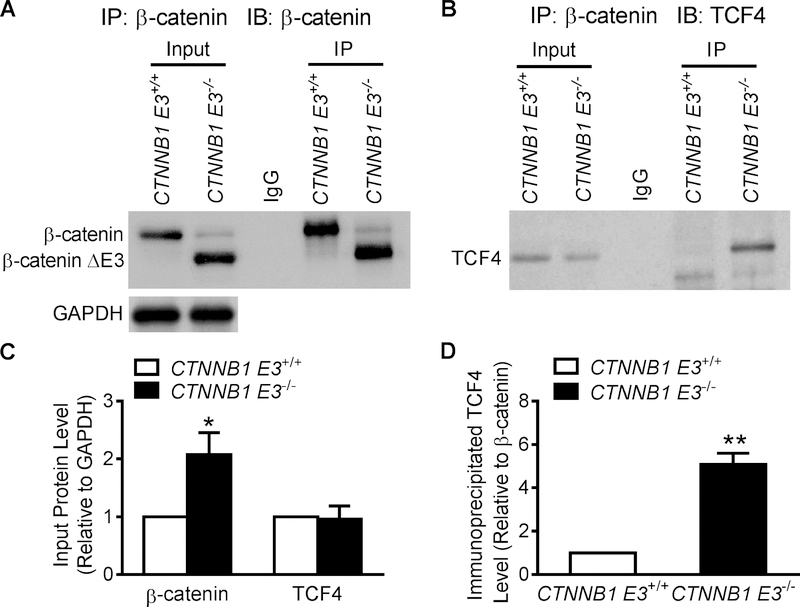
Total protein was extracted from adult CTNNB1 E3+/+ and CTNNB1 E3−/− VMs. Western blotting showed β-catΔE3 expression in CTNNB1 E3−/− VMs; abundant full-length β-catenin was detected in CTNNB1 E3+/+ VMs, while a small amount of full-length β-catenin was observed in CTNNB1 E3−/− VMs. TCF4 was detected in both CTNNB1 E3+/+ and CTNNB1 E3−/− VMs (Figure 2B). A β-catenin antibody was able to pull down full-length β-catenin, β-catΔE3 and TCF4 (Figure 3A and B). Abundant β-catΔE3 along with a small amount of full-length β-catenin was pulled down in CTNNB1 E3−/− VMs (Figure 3A). More TCF4 was immunoprecipitated by the β-catenin antibody in CTNNB1 E3−/− than CTNNB1 E3+/+ VMs (Figure 3B). Statistical analyses showed that total β-catenin, including full-length β-catenin and β-catΔE3, was significantly increased (p<0.01) in CTNNB1 E3−/− than CTNNB1 E3+/+ VMs (Figure 3C), and TCF4 was not significantly different between these two groups (Figure 3C). The amount of TCF4 immunoprecipitated by the β-catenin antibody was significantly larger (p<0.01) in CTNNB1 E3−/− than CTNNB1 E3+/+ VMs (Figure 3D).
Figure 3. β-catΔE3 interacts with TCF4.
Total protein was extracted from isolated adult CTNNB1 E3+/+ (n=3 mice) and CTNNB1 E3−/− VMs (n=3 mice). Western blot analysis showing β-catΔE3 in CTNNB1 ES−/− VMs and abundant full-length β-catenin detected in CTNNB1 E3+/+ VMs, but not in CTNNB1 E3−/− VMs (A). TCF4 detected in both CTNNB1 E3+/+ and CTNNB1 E3−/− VMs (B). IP was performed on the same amount of protein extracted from isolated adult CTNNB1 E3+/+ and CTNNB1 E3−/− VMs by using a β-catenin antibody and Western blotting showing that this antibody pulls down β-catenin in CTNNB1 E3+/+ MV and β-catΔE3 with much less full-length β-catenin in CTNNB1 E3−/− MV (A). This antibody pulled down more TCF4 in CTNNB1 E3−/− than CTNNB1 E3+/+ MV (B). Student’s t-test showing that β-catΔE3 protein in CTNNB1 E3−/− VMs is significantly increased (*p<0.05) compared to full-length β-catenin in CTNNB1 E3+/+ VMs (C); there is no significant difference in TCF4 expression between CTNNB1 E3+/+ and CTNNB1 E3−/− VMs (C). Immunoprecipitated TCF4 relative to β-catenin is significantly increased (**p<0.01) in CTNNB1 E3−/− VMs compared to that CTNNB1 E3+/+ VMs (D).
β-catΔE3 led to decrease of Na+ channel activity, right shift of the steady-state activation of Na+ channel and acceleration of Na+ channel recovery from inactivation
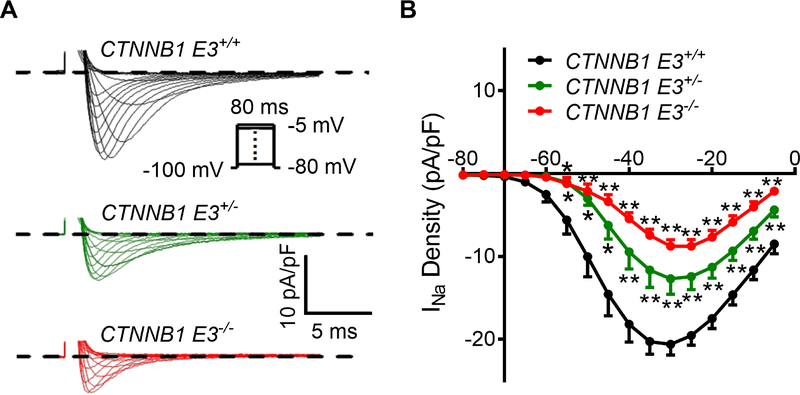
Na+ currents were recorded from isolated CTNNB1 E3+/+, CTNNB1 E3+/− and CTNNB1 E3−/− VMs. Individual VMs were depolarized from −80 mV to −5 mV at the hold potential, −100 mV. Current densities at different voltages were obtained from peak currents divided by capacitance. Representative traces showed that Na+ currents were decreased in CTNNB1 E3+/− and CTNNB1 E3−/− VMs (Figure 4A). Peak current densities and voltages were plotted (Figure 4B). One-way ANOVA analysis showed that the peak current densities were significantly decreased (p<0.01) at the voltages from −55 mV to −5 mV in CTNNB1 E3+/− and CTNNB1 E3−/− VMs compared to CTNNB1 E3+/+ VMs; Bonferroni post-hoc test showed that the peak current densities were significantly decreased (p<0.01 or p<0.05) at the voltages from −55 mV to −5 mV in CTNNB1 E3+/− and CTNNB1 E3+/− VMs, compared to CTNNB1 E3+/+ VMs; the peak current densities were further decreased in CTNNB1 E3−/− VMs compared to CTNNB1 E3+/− VMs, but the difference did not reach statistical significance (Figure 4B).
Figure 4. β-catΔE3 inhibits cardiac Na+ channel activity.
(A) Typical Na+ currents recorded during 80 ms depolarizing voltage steps to potentials between −80 mV and −5 mV from a holding potential of −100 mV from CTNNB1 E3+/+, CTNNB1 E3+/− and CTNNB1 E3−/− VMs. Peak current densities of INa are lower in CTNNB1 E3+/− and CTNNB1 E3−/− VMs compared to those in CTNNB1 E3+/+ VMs. (B) One-way ANOVA analysis showing that peak current densities obtained from the peak currents divided by individual cell capacitances are significantly different (**p<0.01) at voltages from −55 mV to −5 mV among CTNNB1 E3+/+ (n=14 from 8 mice), CTNNB1 E3+/− (n=11 from 5 mice) and CTNNB1 E3−/− (n=13 from 6 mice) VMs; Bonferroni post-hoc test demonstrating that peak current densities are significantly decreased (*p<0.05 or **p<0.01) at the voltages from −55 mV to −5 mV in CTNNB1 E3+/− and CTNNB1 E3−/− VMs compared to CTNNB1 E3+/+ VMs; they are further decreased in CTNNB1 E3−/− VMs, but they did not reach statistical significance compared to CTNNB1 E3+/− VMs.
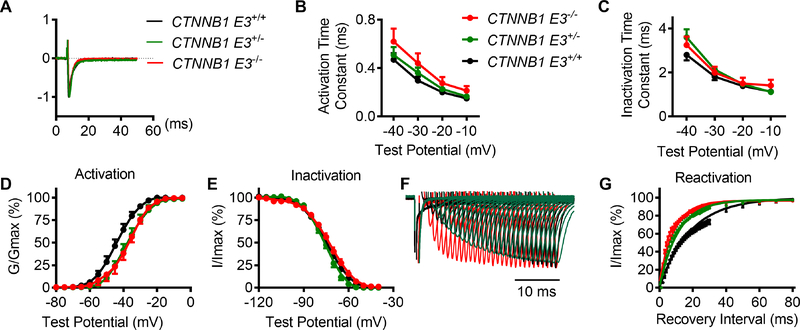
To determine the effects of β-catΔE3 on Na+ channel activation and inactivation, time constants of activation (tauactivation) and inactivation (tauinactivaiton) were analyzed by fitting the upstroke and decay traces of INa using single exponential function, respectively. One-way ANOVA analysis showed that there were no statistical differences in the tauactivation and tauinactivaiton of INa at voltages from −40 mV to −10 mV among CTNNB1 E3+/+, CTNNB1 E3+/− and CTNNB1 E3−/− VMs (Figure 5A–C). To determine whether there were any differences in Na+ channel kinetics among these groups of VMs, steady-state activation, steady-state inactivation and recovery from inactivation of INa were recorded and analyzed. Steady-state activation of the Na+ channel showed a significant right shift for CTNNB1 E3+/− and CTNNB1 E3−/− VMs by 8 mV (Figure 5D). One-way ANOVA analysis showed that half-maximal activation voltage was significantly different (p<0.01) among CTNNB1 E3+/+ (V1/2 =−44.2±1.7 mV), CTNNB1 E3+/− (V1/2 = −37.1±2.0 mV) and CTNNB1 E3−/− (V1/2 = −36.6±1.5 mV) VMs; Bonferroni post-hoc test demonstrated that half-maximal activation voltage was significantly different (p<0.01) between CTNNB1 E3+/− or CTNNB1 E3−/− and CTNNB1 E3+/+ VMs, respectively. There were no significant changes in K slope factor among these groups (CTNNB1 E3+/+, 4.85±0.23; CTNNB1 E3+/−, 5.18±0.16; CTNNB1 E3−/− 4.82±0.25). Voltage-dependent inactivation of INa was recorded by a two-pulse protocol with conditioning potentials from −120 mV to −20 mV, followed by a test potential of −30 mV. There were no changes in the voltage-dependent inactivation curves of INa among these three groups (Figure 5E). Half-maximal inactivation voltage and K slope factor were −74.66±0.16mV and 7.76±0.15, −76.01±0.22 mV and 6.19±0.20, and −72.57±0.29 mV and 8.08±0.27 in CTNNB1 E3+/+, CTNNB1 E3+/− and CTNNB1 E3−/− VMs, respectively. One-way ANOVA analysis showed that these values were not significantly different among them. Voltage-dependent steady-state activation of the Na+ channel was determined by a series of test potentials ranging from −80 mV to −5 mV, from a holding potential of −100 mV. Recovery of INa from inactivation was recorded by a paired-pulse with a variable inter-pulse duration (from 0 to 230 ms) at a holding potential of −100 mV. The curves of recovery from inactivation were obtained by normalizing the peak current from a second pulse (−30 mV, 80 ms) to a first pulse (−30 mV, 80 ms) (Figure 5F) and then fitting the data with single exponential equation (Figure 5G). Figure 4F and G showed that recovery of INa from inactivation was fast in both CTNNB1 E3−/− and CTNNB1 E3+/− VMs. One-way ANOVA analysis showed that tau and K slope factor were significantly different (p<0.01) among CTNNB1 E3+/+ (tau =20.3±2.9, K=0.06±0.01), CTNNB1 E3+/− (tau =11.0±1.30, K=0.10±0.01) and CTNNB1 E3−/− (tau=9.07±1.18, K=0.11±0.01) VMs; Bonferroni post-hoc test demonstrated that they were significantly different (p<0.01 or p<0.05) between CTNNB1 E3−/− or CTNNB1 E3+/− and CTNNB1 E3+/+ VMs, respectively.
Figure 5. β-catΔE3 shifts steady-state activation of the Na+ channel to the right side and accelerates Na+ channel recovery from inactivation, but does not affect other kinetics.
(A) Traces representative of normalized Na+ currents recorded at voltage of −35 mV from CTNNB1 E3+/+, CTNNB1 E3+/− and CTNNB1 E3−/− VMs. (B, C) Time constants of activation and inactivation obtained from single exponential fit. One-way ANOVA analysis showing that there is no significant difference in tau activation and inactivation of INa among CTNNB1 E3+/+ (n=14), CTNNB1 E3+/− (n=11 from 5 mice) and CTNNB1 E3−/− (n=13 from 6 mice) VMs. (D) Voltage-dependent steady-state activation of Na+ channel shifted to the right side by 8 mV in CTNNB1 E3−/− (n=9 from 3 mice) and CTNNB1E3+/− (n=8 from 4 mice) VMs compared to that in CTNNB1 E3+/+ VMs (n=12 from 8 mice). Statistical analyses using one-way ANOVA with Bonferroni post-hoc test on V1/2 and K slope factor. (E) One-way ANOVA analysis showing that voltage-dependent steady-state inactivation of Na+ channel is not significantly different among CTNNB1 E3+/+ (n=12 from 5 mice), CTNNB1 E3+/− (n=8 from 4 mice) and CTNNB1 E3−/− (n=9 from 4 mice) VMs. (F) INa recovery traces recorded from CTNNB1 E3+/+ (n=13 from 5 mice), CTNNB1E3+/− (n=10 from 4 mice) and CTNNB1 E3−/− (n=9 from 7 mice) VMs, respectively. (G) Mean ± SEM normalized recovery data for peak INa plotted and well described by single exponential. CTNNB1 E3+/− and CTNNB1 E3−/− accelerate the Na+ channel recovery from inactivation compared to CTNNB1 E3+/+ in VMs. Statistical analyses using one-way ANOVA with Bonferroni post-hoc test on Tau and K slope factor.
β-catΔE3 decelerated depolarization of action potential in cardiomyocytes
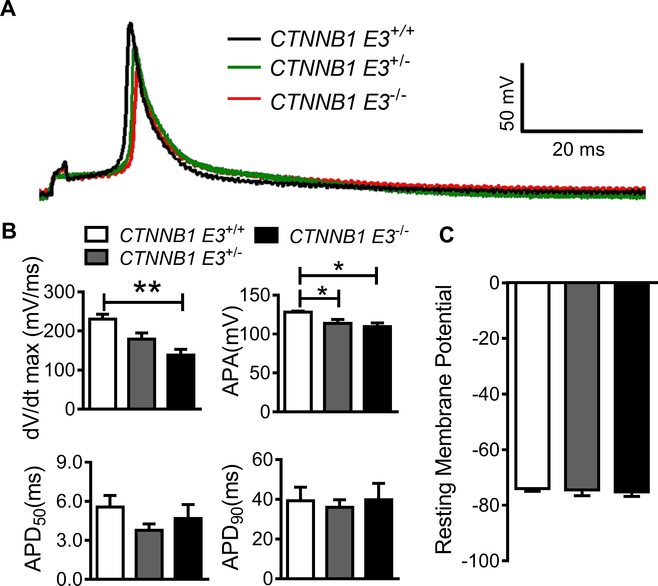
We further investigated whether CTNNB1 E3−/− influenced action potential (AP). APs were recorded at 1 Hz from CTNNB1 E3+/+, CTNNB1 E3+/− and CTNNB1 E3−/− VMs. AP traces, as shown in Figure 6A, depolarization of APs was slow and the amplitude of APs was small in CTNNB1 E3−/−and CTNNB1 E3+/−. One-way ANOVA analysis showed that maximal upstroke velocity (Vmax) and amplitude of AP (APA) were significantly different (p<0.01) among CTNNB1 E3+/+ (Vmax=230.2 ± 31.5 mV/ms and APA=128.1±3.4 mV), CTNNB1 E3+/− (Vmax=179.0±41.8 mV/ms and APA=113.6±13.3 mV) and CTNNB1 E3−/− (Vmax=138.3±38.5 mV/ms and 109.6±12.0 mV) VMs; Bonferroni post-hoc test demonstrated that Vmax and APA were significantly smaller (p<0.01 or p<0.05) in CTNNB1 E3−/− VMs, compared to CTNNB1 E3+/+ VMs (Figure 6B), respectively, and there was a significant difference (p<0.05) in APA between CTNNB1 E3+/− and CTNNB1 E3+/+ VMs. One-way ANOVA analysis showed that resting membrane potential (RMP) and AP duration (APD50 and APD90) were not significantly different among CTNNB1 E3+/+ (RMP =−74.0±2.3 mV, APD50=5.6±2.2 ms and APD90=39.3±16.6 ms), CTNNB1 E3+/− (RMP =−74.5±5.4 mV, APD50=3.8±1.3 ms and APD90=35.9±10.0 ms) and CTNNB1 E3−/− VMs (RMP=−75.2±4.2 mV, APD50=4.7±2.8 ms and APD90 =39.8±21.1 ms) (Figure 6B, C).
Figure 6. β-catΔE3 decelerates depolarization of action potential.
(A) APs recorded from CTNNB1 E3+/+ (n=7 from 3 mice), CTNNB1 E3+/− (n=6 from 3 mice) and CTNNB1 E3−/− (n=6 from 2 mice) VMs. (B) One-way ANOVA analysis showing that Vmax and APA of APs are significantly different (**p<0.01) and APD50 and APD90 are not different among CTNNB1 E3+/+, CTNNB1 E3+/− and CTNNB1 E3−/− VMs; Bonferroni post-hoc test demonstrated that Vmax and APA were significantly smaller (p<0.01 or p<0.05) in CTNNB1 E3−/− VMs compared to CTNNB1 E3+/+ VMs, respectively, and there is a significant difference (p<0.05) in APA between CTNNB1 E3+/− and CTNNB1 E3+/+ VMs. (C) One-way ANOVA analysis showing that RMP is not significantly different among CTNNB1 E3+/+, CTNNB1 E3+/− and CTNNB1 E3−/− VMs.
Prolongation of QRS complex and VT induced by flecainide in mice with cardiac expression of β-catΔE3
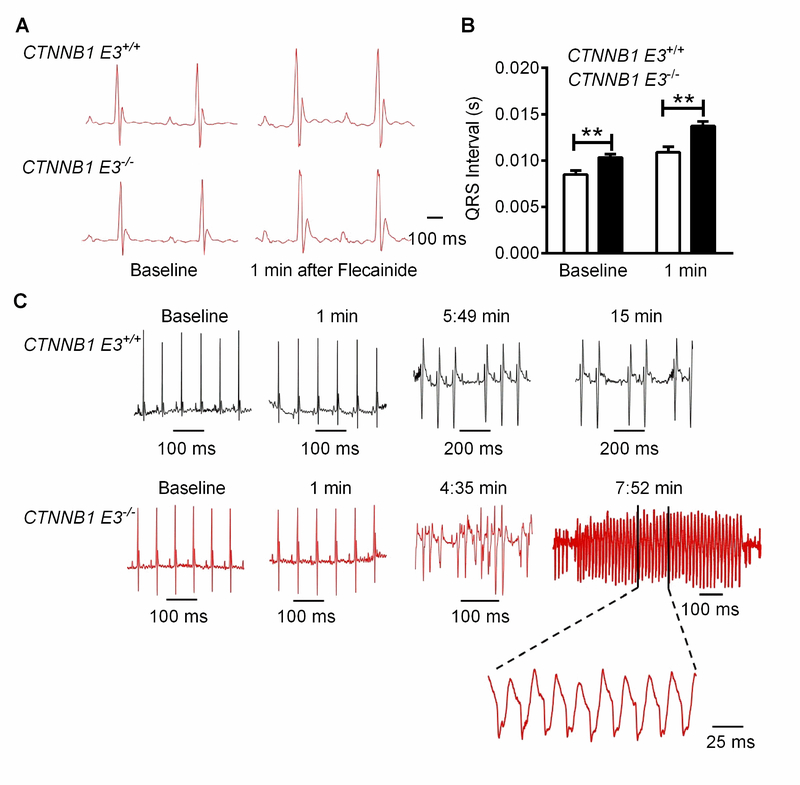
10–11-week-old adult CTNNB1 E3−/− mice and CTNNB1 E3+/+ mice were subjected to ECG recordings for 5 minutes, and cardiac arrhythmia was not detected. Flecainide, a Na+ channel blocker, Ic antiarrhythmic drug (40 mg/Kg, i.p.), was administered intraperitoneally after 5 minutes of recording. Two-way ANOVA test showed that QRS complex at baseline and 1 minute after flecainide administration was significantly prolonged (p<0.01) in CTNNB1 E3−/− mice compared to CTNNB1 E3+/+ mice (Figure 7A and B), and Mann-Whitney test demonstrated that PR-, RR- and QTc-intervals at baseline and 1 minute after flecainide administration were not different between CTNNB1 E3−/− and CTNNB1 E3+/+ mice (Supplemental Figure S5A–C). VT was observed in 7 out 13 (53.8%) CTNNB1 E3−/− mice (Figure 7C) after 4 to 5 minutes of flecainide administration and the duration of VT was up to 200 ms (Figure 7C), but no VT was detected in CTNNB1 E3+/+ mice (Figure 7C).
Figure 7. β-catΔE3 prolongs QRS wave and increases susceptibility to development of VT in mice.
(A) ECGs recorded from CTNNB1 E3+/+ and CTNNB1 E3−/− mice at baseline and one minute after administration of flecainide (40 mg/Kg body weight, i.p.). (B) Mann-Whitney test showing that QRS wave is significantly prolonged (*p< 0.05 or **p<0.01) in CTNNB1 E3−/− (n=13) than CTNNB1 E3+/+ mice (n=6) at the baseline and one minute after flecainide treatment. (C) 7 of 13 CTNNB1 E3−/− mice develop VT, as shown at around 5 minutes and 15 minutes after flecainide treatment, but no VT in CTNNB1 E3+/+ mice (n=6).
Cardiac function was not altered in mice with cardiomyocytes expressing β-catΔE3
To clarify the influence of β-catΔE3 on cardiac function, echocardiography was performed on 10–11-week-old CTNNB1 E3+/+ and CTNNB1 E3−/− mice, and representative M-mode images are shown in Supplemental Figure S6A. A Mann-Whitney test showed that echocardiography parameters, including LVAW;d, LVAW;s, LVID;d, LVID;s, LVPW;d and LVPW;s (Supplemental Figure S6A), ejection fraction (EF) and fraction shortening (FS) (Supplemental Figure S6B and C) were not significantly different and that no changes of heart/body weight ratios were identified between CTNNB1 E3+/+ and CTNNB1 E3−/− mice (Supplemental Figure S6D). One-way ANOVA analysis showed that the cell capacitance was not significantly different among CTNNB1 E3+/+ (119.4±5.6 pF; n=20 from 11 mice), CTNNB1 E3+/− (136.3±7.4 pF; n=22 from 10 mice) and CTNNB1 E3−/− (130.1±8.0 pF; n=19 from 10 mice) VMs.
Discussion
β-catenin is a transcriptional coactivator that regulates the expression of major genes involved in the regulation of cell fate specification, proliferation, and differentiation, as well as cardiac function.10–12 β-catenin normally resides in the cytoplasm and is constitutively targeted by phosphorylation for degradation, thereby preventing β-catenin from translocating to the nucleus.15 In the nucleus, β-catenin associates with coactivators, such as TCF4, to affect target gene transcription.15, 16 β-catΔE3 lacks exon 3-encoded amino acids, including serine and threonine GSK 3β phosphorylation sites, and is resistant to degradation, leading to enhancement of β-catenin signaling,22 which is also supported by our findings. Our results reveal that enhancement of β-catenin signaling by cardiac-specific expression of stabilized β-catΔE3 through CNNTB1 exon 3 deletion led to the formation of β-catΔE3 and TCF4 complex and decrease in Na+ channel activity and NaV1.5 expression, subsequently causing QRS prolongation and increase of susceptibility to VT in mice. In addition, we showed that β-catenin nuclear accumulation in cardiomyocytes correlates with decreased NaV1.5 expression in the ischemic human hearts. These findings strongly support the notion that β-catenin interaction with TCF4 suppresses NaV1.5 expression.17 We also found that enhanced β-catenin signaling significantly changed Na+ channel kinetics. A right shift of steady-state activation of Na+ channels contributed to a decrease in Na+ channel function in β-catΔE3 cardiomyocytes, while fast recovery from inaction improved Na+ channel function in β-catΔE3 cardiomyocytes. These two effects may cancel each other out with no significant impact on Na+ channel activity. The mechanisms whereby β-catenin regulates Na+ channel kinetics are not clear. NaV1.5 is a main a subunit underlying cardiac Na+ channel activity and post-translational modifications of NaV1.5, such as phosphorylation, glycosylation, S-nitrosylation, ubiquitination, and methylation by individual enzymes affect cardiac Na+ channel kinetics.23 Enhancement of β-catenin may affect expression of these enzymes to collectively affect the cardiac Na+ kinetics described above through NaV1.5 modulations.
The mouse model with cardiomyocyte-specific CTNNB1 E3−/−-induced enhancement of β-catenin signaling has been used in studies of cardiac hypertrophy and failure. Recent studies reported that early cardiac knock out of CTNNB1 E3 caused cardiac hypertrophy and failure in adult mice with high mortality.21 Our studies showed no cardiac dysfunction in 10–11-week-old mice with cardiac CTNNB1 E3−/− at 8 weeks, and they had normal survival. These findings are consistent with previous reports from two groups showing no cardiac dysfunction in mice within 4 weeks of cardiac CTNNB1 E3−/−.19, 20 Taken together, our findings indicate that enhancement of β-catenin signaling within a short period of time directly induced cardiac electrical remodeling in adult mice.
Hydrogen peroxide, a reactive oxygen, species is elevated in the IHD.24 We found that ROS inhibited cardiac Na+ channel activity by suppressing NaV1.5 expression24 through enhancing β-catenin/TCF4 signaling,17 and that NaV1.5 expression in peri-infarct zone (PIZ) of mouse hearts with myocardial infarction (MI) was significantly decreased.6 Future studies will be focused on determining if TCF4 is required to for suppression of NaV1.5 by β-catenin and if its deletion is able to prevent the downregulation of NaV1.5 in PIZ of mouse hearts with MI and cardiac electrical remodeling, as well as the decrease in Na+ activity in cardiomyocytes in the PIZ. Inhibitors of β-catenin and TCF4 interaction have been developed, and both in vitro and in vivo studies have shown that they have very promising effects in the treatment of cancer.25, 26 It is very important for us to evaluate the effects of these inhibitors in the regulation of NaV1.5 expression in HL-1 cells, the CTNNB1 E3−/− mouse model, and mouse hearts with MI. We may determine if some of these inhibitors can exert therapeutic effects in ischemia-induced cardiac arrhythmias by enhancement of β-catenin/TCF signaling.
Conclusions
Enhancement of β-catenin/TCF4 signaling suppressed NaV1.5 expression and inhibited Na+ channel activity, leading to prolongation of the QRS complex and increased susceptibility to VT in mice. The β-catenin/TCF4-NaV1.5 signaling pathway could be a therapeutic target for treatment of ischemia-induced cardiac arrhythmias.
Supplementary Material
Acknowledgments
Sources of Funding
This study was supported by NIH Grants R01HL122793 (H. Xu) and R01HL111480 (F. Li) and the Department of Pathology at the University of Washington Medical Center (H. Xu).
Footnotes
Disclosures
None
Publisher's Disclaimer: This is a PDF file of an unedited manuscript that has been accepted for publication. As a service to our customers we are providing this early version of the manuscript. The manuscript will undergo copyediting, typesetting, and review of the resulting proof before it is published in its final citable form. Please note that during the production process errors may be discovered which could affect the content, and all legal disclaimers that apply to the journal pertain.
References
- 1.Wang Q, Shen J, Li Z, Timothy K, et al. Cardiac sodium channel mutations in patients with long QT syndrome, an inherited cardiac arrhythmia. Hum molr genet 1995;4:1603–7. [DOI] [PubMed] [Google Scholar]
- 2.Barajas-Martinez H, Hu D, Antzelevitch C. Genetic and molecular basis for sodium channel-mediated Brugada syndrome. Arch Cardiol Mex 2013;83:295–302. [DOI] [PubMed] [Google Scholar]
- 3.Chen Q, Kirsch GE, Zhang D, et al. Genetic basis and molecular mechanism for idiopathic ventricular fibrillation. Nature 1998;392:293–6. [DOI] [PubMed] [Google Scholar]
- 4.Papadatos GA, Wallerstein PM, Head CE, et al. Slowed conduction and ventricular tachycardia after targeted disruption of the cardiac sodium channel gene Scn5a. Proc Natl Acad Sci U S A 2002;99:6210–5. [DOI] [PMC free article] [PubMed] [Google Scholar]
- 5.Leoni AL, Gavillet B, Rougier JS, et al. Variable Na(v)1.5 protein expression from the wild-type allele correlates with the penetrance of cardiac conduction disease in the Scn5a(+/−) mouse model. PloS One 2010;5:e9298. [DOI] [PMC free article] [PubMed] [Google Scholar]
- 6.Cai B, Wang N, Mao W, et al. Deletion of FoxO1 leads to shortening of QRS by increasing Na(+) channel activity through enhanced expression of both cardiac NaV1.5 and beta3 subunit. J Mol Cell Cardiol 2014;74:297–306. [DOI] [PMC free article] [PubMed] [Google Scholar]
- 7.Dybkova N, Ahmad S, Pabel S, et al. Differential regulation of sodium channels as a novel proarrhythmic mechanism in the human failing heart. Cardiovas Res 2018;114:1728–37. [DOI] [PubMed] [Google Scholar]
- 8.Podrid PJ and Myerburg RJ. Epidemiology and stratification of risk for sudden cardiac death. Clin Cardiol 2005;28:I3–11. [DOI] [PubMed] [Google Scholar]
- 9.Liu M, Yang KC and Dudley SC, Jr. Cardiac Sodium Channel Mutations: Why so Many Phenotypes? Curr Top Membr 2016;78:513–59. [DOI] [PMC free article] [PubMed] [Google Scholar]
- 10.Iyer S, Ambrogini E, Bartell SM, et al. FOXOs attenuate bone formation by suppressing Wnt signaling. J Clin Invest 2013;123:3409–19. [DOI] [PMC free article] [PubMed] [Google Scholar]
- 11.Kato H, Gruenwald A, Suh JH, et al. Wnt/beta-catenin pathway in podocytes integrates cell adhesion, differentiation, and survival. J Bio Chem 2011;286:26003–15. [DOI] [PMC free article] [PubMed] [Google Scholar]
- 12.Hou N, Ye B, Li X, et al. Transcription Factor 7-like 2 Mediates Canonical Wnt/beta-Catenin Signaling and c-Myc Upregulation in Heart Failure. Circ Heart fail 2016;9: e003010. [DOI] [PMC free article] [PubMed] [Google Scholar]
- 13.Orford K, Crockett C, Jensen JP, Weissman AM, Byers SW. Serine phosphorylation-regulated ubiquitination and degradation of beta-catenin. J Bio Chem 1997;272:24735–8. [DOI] [PubMed] [Google Scholar]
- 14.Aberle H, Bauer A, Stappert J, Kispert A, Kemler R. beta-catenin is a target for the ubiquitin-proteasome pathway. EMBO J 1997;16:3797–804. [DOI] [PMC free article] [PubMed] [Google Scholar]
- 15.Rao TP, Kuhl M. An updated overview on Wnt signaling pathways: a prelude for more. Circ Res 2010;106:1798–806. [DOI] [PubMed] [Google Scholar]
- 16.Olson LE, Tollkuhn J, Scafoglio C, et al. Homeodomain-mediated beta-catenin-dependent switching events dictate cell-lineage determination. Cell 2006;125:593–605. [DOI] [PubMed] [Google Scholar]
- 17.Wang N, Huo R, Cai B, et al. Activation of Wnt/beta-catenin signaling by hydrogen peroxide transcriptionally inhibits NaV1.5 expression. Free Radical Bio Med 2016;96:34–44. [DOI] [PMC free article] [PubMed] [Google Scholar]
- 18.Liang W, Cho HC, Marban E. Wnt signalling suppresses voltage-dependent Na(+) channel expression in postnatal rat cardiomyocytes. J Physiol 2015;593:1147–57. [DOI] [PMC free article] [PubMed] [Google Scholar]
- 19.Hirschy A, Croquelois A, Perriard E, et al. Stabilised beta-catenin in postnatal ventricular myocardium leads to dilated cardiomyopathy and premature death. Basic Res Cardiol 2010;105:597–608. [DOI] [PubMed] [Google Scholar]
- 20.Baurand A, Zelarayan L, Betney R, et al. Beta-catenin downregulation is required for adaptive cardiac remodeling. Circ Res 2007;100:1353–62. [DOI] [PubMed] [Google Scholar]
- 21.Iyer LM, Nagarajan S, Woelfer M, et al. A context-specific cardiac beta-catenin and GATA4 interaction influences TCF7L2 occupancy and remodels chromatin driving disease progression in the adult heart. Nucleic Acids Res 2018;46:2850–67. [DOI] [PMC free article] [PubMed] [Google Scholar]
- 22.Harada N, Tamai Y, Ishikawa T, et al. Intestinal polyposis in mice with a dominant stable mutation of the beta-catenin gene. EMBO J 1999;18:5931–42. [DOI] [PMC free article] [PubMed] [Google Scholar]
- 23.Beltran-Alvarez P, Pagans S, Brugada R. The cardiac sodium channel is post-translationally modified by arginine methylation. J Proteome Res. 2011;10:3712–9. [DOI] [PubMed] [Google Scholar]
- 24.Berg K, Jynge P, Bjerve K, Skarra S, Basu S, Wiseth R. Oxidative stress and inflammatory response during and following coronary interventions for acute myocardial infarction. Free Radic Res 2005;39:629–36. [DOI] [PubMed] [Google Scholar]
- 25.Yan M, Li G, An J. Discovery of small molecule inhibitors of the Wnt/beta-catenin signaling pathway by targeting beta-catenin/Tcf4 interactions. Exp Biol Med (Maywood) 2017;242:1185–1197. [DOI] [PMC free article] [PubMed] [Google Scholar]
- 26.Krishnamurthy N, Kurzrock R. Targeting the Wnt/beta-catenin pathway in cancer: Update on effectors and inhibitors. Cancer Treat Rev 2018;62:50–60. [DOI] [PMC free article] [PubMed] [Google Scholar]
Associated Data
This section collects any data citations, data availability statements, or supplementary materials included in this article.


