ABSTRACT
Background: Long non-coding RNAs (lncRNAs) have been reported to participate in many diseases including non-small cell lung cancer (NSCLC), thus our objective was to investigate the impact of lncRNA SBF2-AS1 modulating microRNA-302a (miR-302a) expression on radiosensitivity of NSCLC.
Methods: The expression of SBF2-AS1, miR-302a and muscleblind-like 3 (MBNL3) in NSCLC tissues of the radiotherapy-sensitive and radiotherapy-resistant groups was tested. The radiosensitivity of parent and resistant strains (NCI-H1299 and NCI-H1299R cells) was detected. Further, cells were treated with si-SBF2-AS1 and miR-302a mimics to determine their roles in proliferation and apoptosis of parent strain and resistant strain cells as well as transfected cells. The in-vivo growth capacity of the cells and the effect of radiotherapy on tumor size of NSCLC were detected.
Results: Up-regulated SBF2-AS1 and MBNL3 and down-regulated miR-302a in NSCLC tissues of the radiotherapy resistant group. Overexpression of SBF2-AS1 and MBNL3 and low expression of miR-302a were witnessed in NCI-H1299R cells. Down-regulated SBF2-AS1 or up-regulated miR-302a suppressed the proliferation while boosted the apoptosis of NCI-H1299 cells and decreased the radioresistance of the NCI-H1299R cells. Silencing SBF2-AS1 or up-regulating miR-302a restrained tumor growth in vivo.
Conclusion: Our study presents that high expression of miR-302a or inhibition of SBF2-AS1 can enhance the radiosensitivity and apoptosis of NSCLC cells through downregulation of MBNL3, which is a therapeutic target for NSCLC.
KEYWORDS: Non-small cell lung cancer, LncRNA SBF2-AS1, MicroRNA-302a, Muscleblind-like 3, Proliferation, Apoptosis, Radiosensitivity
Introduction
Lung cancer is a group of heterogeneous tumors, which is composed of more than 50 histomorphological subtypes [1]. Non-small cell lung cancer (NSCLC) accounts for 80% of all lung cancer. The development of chemotherapy and targeted therapy for specific molecular changes requires accurate subclassification of NSCLC, which mainly includes adenocarcinomas and squamous cell carcinomas predominantly [2]. More than 7,333,000 lung cancer patients are diagnosed annually and nearly 6,102,000 people die of lung cancer in China [3]. The pathogenesis of lung cancer is particularly complex, including living environment, genetic factors, smoking and so on, while the occurrence of lung cancer associated with the regulation of a variety of tumor suppressor genes and oncogenes [4]. The most common symptoms of NSCLC are dyspnea, fatigue, pain, inappetence, anxiety, sleep disorders and depression [5]. Radiotherapy is the core part of the treatment of NSCLC, while it is not all of the tumor cells that could be destroyed by radiation [6]. The severe situation of NSCLC treatment makes it necessary to further explore the mechanism of NSCLC and establish a new therapeutic strategy.
Long noncoding RNAs (lncRNAs) are a class of noncoding RNAs, and recently been proved to have rich functions in a variety of biological processes [7]. SBF2 antisense RNA 1 (SBF2‐AS1), located at the 11p15.1 locus, is an antisense RNA to SBF2 with 2708 nt [8]. A study has reported that upregulation of lncRNA SBF2-AS1 is related to the poor prognosis and advanced tumor progress of NSCLC [9]. MicroRNA (miRNAs), as a newly discovered small non-coding RNA family, modulate the target gene at the post-transcriptional level. They typically function within the 3´-untranslated region (3´-UTR) of the target gene, resulting in translation inhibition [10]. MiR-302 is the main miRNA discovered in induced pluripotent stem cells and human embryonic stem cells [11]. It was reported that miR-302/367 guides the development of lung endoderm through coordinating many aspects of progenitor cell behavior, containing apical-basal polarity, differentiation and proliferation [12]. A study has also presented that miR-30-5p modulates muscle differentiation and the selective splicing of muscle-related genes via targeting muscleblind-like 3 (MBNL3) [13]. MBNL protein is a regulator of selective splicing, which contains four CX7CX4-6CX3H zinc finger domains and endows RNA binding activity [14]. It has been demonstrated that some of the CCCH genes like MBNL3 are enriched in macrophages associated organs, such as lung [15]. Therefore, we speculated that the downregulation of SBF2-AS1 or up-regulation of miR-302a can enhance the sensitivity of radiotherapy for NSCLC and promote the apoptosis of NSCLC cells.
Materials and methods
Ethics statement
The study was approved by the Institutional Review Board of Cancer Hospital of China Medical University, Liaoning Cancer Hospital & Institute and followed the tenets of the Declaration of Helsinki. Participants provided written informed consent to participate in this study. All animal experiments were in compliance with the Guide for the Care and Use of Laboratory Animal by International Committees. The protocol was approved by the Institutional Animal Care Use Committee of Cancer Hospital of China Medical University, Liaoning Cancer Hospital & Institute.
Study subjects
From January 1, 2015, to December 31, 2017, a total of 60 NSCLC patients treated with surgical resection and postoperative radiotherapy in Cancer Hospital of China Medical University, Liaoning Cancer Hospital & Institute were selected in our study. All the selected subjects were confirmed by pathological cytology and did not receive any treatment before operation. The study subject was divided into the radiotherapy-sensitive group (30 cases, average age was 65.30 ± 13.89 years) and the radiotherapy-resistant group (30 cases, average age was 65.80 ± 15.66 years) according to the local or distal recurrence. All the patients were examined by clinical physical examination, fiberoptic bronchoscopy, and chest, head, abdominal CT or abdominal B-ultrasound and systemic bone scan, while there were no pregnancy and other complications such as diabetes, hepatorenal insufficiency, congestive heart failure and hypertension. The tissue samples were removed after operation and quickly cryopreserved in liquid nitrogen.
Cell culture
NCI-H1299 cell line, purchased from Procell Life Science & Technology Co., Ltd (Wuhan, Hubei, China), was fostered in RPMI-1640 medium containing 10% fetal bovine serum (FBS), 100 U/mL penicillin and 100 U/mL streptomycin. The culture bottle was cleaned by phosphate buffer saline (PBS) and the fresh medium was replaced for 2–3 times every week. The cells were subcultured under the condition of 37°C and 5% CO2 saturated humidity environment.
Establishment of cellular radiotherapy resistance model
NCI-H1299 cells were selected to construct radiotherapy resistance model. When the confluence of NCI-H1299 cells in the logarithmic phase reached 80–90%, 6 MV X-ray was used to induce irradiation. The induction conditions were as follows: The 6 MV X-ray produced by linear accelerator (Elekta AB, Stockholm, Sweden) was irradiated with a radiation field of 10 × 10 cm, at a dose rate of 200 cGy/min, a source-skin distance of 100 cm, and an absorbed dose rate of 200 cGy/min. The model was established by sublethal dose method. NCI-H1299 cells in the logarithmic phase were irradiated with 0, 2, 4, 6, 8, 10 Gy X-rays at room temperature. After irradiation, the culture medium was renewed, and the cells growth in each irradiation dose was observed after 5–7 days of conventional culture and passage. Cells number was counted and the sublethal dose was determined. After that, H1299 cells were irradiated with a sublethal dose, and the survival cells continued to be cultured into the first passage subline cells. The subline cells received another sublethal dose irradiation, and the surviving cells continued to be fostered into the next passage subline cells and continued to receive sublethal dose irradiation after the cell state was stable. After receiving five or more sublethal doses of irradiation, the radiation-resistant cell line of NCI-H1299 cells was obtained.
Grouping of the parent strain and the resistant strain cells
The parent and resistant NCI-H1299 cells in the logarithmic phase were selected and detached by trypsin to make cell suspension. The cell number was reckoned. And then cells were inoculated in a 25 cm2 culture flask after adjusting the cell density, and cultured in an incubator (37°C, 5% CO2). Cells were transfected when the cell confluence reached 30–40%. To test the effect of lncRNA SBF2-AS1 and miR-302a on the parent strain and resistant strain cells, they were each divided into si-negative control (NC) group (transfected with low expression SBF2-AS1 NC), si-SBF2-AS1 group (transfected with low expression SBF2-AS1 vector), mimics NC group (transfected with miR-302a mimics NC) and miR-302a mimics group (transfected with miR-302a mimics). si-SBF2-AS1 NC, si-SBF2-AS1, miR-302a mimics NC and miR-302a mimics were devised by GenePharma Ltd. (Shanghai, China).
Colony formation assay
The radioresistance of parent strain and resistant strain NCI-H1299 cells was analyzed by colony formation assay. The cells of parent strain and resistant strain in the logarithmic phase were detached with trypsin and counted. The different numbers of parent strain and resistant strain cells were inoculated into 100 mm petri dish in accordance with different irradiation doses. After the cells adhered to the wall, they were irradiated with X-rays of 0, 2, 4, 6, 8 and 10 Gy, respectively. After irradiation, the cells were fostered for 12 d, the culture medium was discarded and the cells were washed twice by PBS and fixed with methanol for 15 min and dyed with Giemsa for 15 min. The residual dye solution was washed with double distilled water and then the cells were dried by airing. The colonies with cell count ≥50 cells were effective cell colonies, and the cell survival fraction under different doses of irradiation was computed. The formula was as follows: plating efficacy (PE) = colony formation number of unirradiated cells/number of inoculated cells × 100%. Cell survival fraction (SF) = colony formation rate in a certain dose of irradiation group/colony formation rate of unirradiated group × 100%.
Cell counting kit (CCK)-8 assay
The parent strain and the resistant strain cells in the logarithmic phase and the cells after transfection were taken and detached with trypsin to made cell suspension and counted. The cells were diluted to 2000 cells/100 μL and inoculated into a 96-well plate, respectively, and each well was added with 100 μL serum-containing culture medium. Each cell were set up with five duplicated wells, and a group appended with culture medium was set as a blank group and cultured routinely. After the cells were cultured for 12 h and adhered to the wall, the 96-well plate of the inoculated parent strain and resistant strain cells and the transfected parent strain and resistant strain cells were irradiated with the sublethal dose. After the irradiation, the culture medium was replaced fresh and the cells were cultured routinely. After irradiation 1 d, 2 d, 3 d, 4 d, 5 d, 6 d, 7 d and 8 d, 10 μL CCK-8 solution was added and acted 0.5 h. The optical density (OD) values of each well were measured at 450 nm using a microplate reader. OD value represented the cell number, and the survival curve of the parent strain and the resistant strain of NCI-H1299 cells was drawn.
Flow cytometry
The cells were irradiated with 6 Gy dose by 6MV X-ray produced by linear accelerator (Elekta AB, Stockholm, Sweden). After irradiation, the culture medium was renewed and the cells were fostered routinely. After 24 h, the cell culture fluid was transferred into 15 mL centrifugal tube, the cells were rinsed with PBS once, and detached with proper amount of trypsin. The trypsin reaction was terminated with serum-containing medium, the gathered cell culture medium was added and transferred into the centrifuge tube, and centrifuged for 5 min at 1000 r/min. The cells were cleaned with 1 mL PBS and counted (the number of cells was not less than 1 × 10⁵). The cells were amassed by centrifugation for 5 min at 1000 r/min. The cells were suspended with 400 μL 1 × Binding Buffer and mixed with 5 μL Annexin V-FITC. Cells were hatched avoiding light for 15 min. Cells were mixed with 10 μL PI staining solution, placed avoiding light after ice bath for 5 min, and tested by flow cytometry within 30 min.
5-ethynyl-2´-deoxyuridine (EdU) assay
The cells of parent strain and the resistant strain in logarithmic phase were detached with trypsin to make suspension and counted. Then cells were inoculated in 96-well plate (5000 cells/well) and fostered overnight. After the cells adhered to the wall, they were irradiated with sublethal dose and cultured for 1 h. In the light of the detailed experimental steps of Cell-LightTM EdU Apollo488 Imaging Kit (Guangzhou RiboBio Co., Ltd., Guangdong, China), the cells were fixed, stained by Apollo dye, and finally placed in the multifunctional microporous cell imaging system for photo analysis.
Tumor xenograft in nude mice
Twenty-four BALB/cA-nu mice aging between 4 to 5 w were housed in specific pathogen-free (SPF) environment, with normal circadian rhythm of water and food intake. Twelve mice were divided into four groups with three mice in each group in NCI-H1299 cells: si-NC group (injected with low expression SBF2-AS1 NC), si-SBF2-AS1 group (injected with siRNA against SBF2-AS1 vector), mimics NC group (injected with miR-302a mimics NC) and miR-302a mimics group (injected with miR-302a mimics); another twelve mice were grouped in the same way in NCI-H299R cells. Subsequently, the transfected NCI-H1299 or NCI-H299R cell suspension was injected subcutaneously into the right limb root of nude mice, each mouse was injected with 100 μL containing about 1 × 10⁷ cells. Then, the nude mice were continuously fed in SPF environment. Their spirit, diet, defecation, activity and weight changes were observed and recorded. The approximate volume of the tumor in nude mice was computed and gauged every 5 d for 20 d, and the growth curve of the new tumor was drawn. Three days after tumor formation, two nude mice in each group were randomly selected for radiotherapy. Mice were irradiated vertically by 6 MV X-ray produced by linear accelerator (Elekta AB, Stockholm, Sweden). Each nude mouse was irradiated with 6 Gy X-ray every 3 days for a total of 18 Gy X-ray. The tumor volume was metered before each radiotherapy, the changes of tumor volume and living conditions of nude mice in each group after radiotherapy were observed, and the mice were euthanized 3 days after radiotherapy. The volume and weight of the tumor were gauged after rapid stripping, and the inhibitory effect of radiotherapy on the tumor was surveyed.
Fluorescence in situ hybridization (FISH) assay
FISH assay was utilized to identify the subcellular localization of SBF2-AS1 in cells. On the basis of RiboTM lncRNA FISH Probe Mix (Red) (Guangzhou RiboBio Co., Ltd. Guangdong, China) instructions, the specific methods were as follows: the coverslip was put in the 24-well culture plate, and the cells were inoculated according to 6 × 10⁴ cells/well so that the cell confluence was about 80%. Then the coverslip was taken out and fixed with 1 mL 4% paraformaldehyde after cleaning with PBS. The cells were mixed with 250 μL pre-hybrid solution and hatched 1 h at 42°C after treated with protease K, glycine and phthalylation reagent. And then the pre-hybrid solution was absorbed, the cells were hybridized overnight with 250 μL hybrid solution of lncRNA SBF2-AS1 (300 ng/mL) containing probe at 42°C. After cleaned with phosphate-buffered saline with Tween (PBST) three times, the nucleus was dyed with PBST diluted 4´-6-diamidino-2-phenylindole (DAPI) (ab104139,1:100, Abcam Inc., Shanghai, China). Cells were added to the 24-well culture plate, stained for 5 min, observed and pictured under a fluorescence microscope (Olympus, Tokyo, Japan) after sealed with anti-fluorescence quenching agent.
Dual luciferase reporter gene assay
The binding sites of SBF2-AS1 and miR-302a were divined and interpreted using the website https://cm.jefferson.edu/rna22/Precomputed/. The binding relationship between SBF2-AS1 and miR-302a was identified by dual luciferase reporter gene assay, and the SBF2-AS1 3´ untranslated region (UTR) gene fragment was inserted into pMIR-Reporter (Huayueyang Biotechnology Co., Ltd., Beijing, China) by utilizing endoenzyme sites Bamh1 and Ecor1, and the complementary sequence mutation site of seed sequence was devised on SBF2-AS1 wild type (WT), and digestion with restriction endoenzyme prior to the target fragment was inserted into the pMIR-Reporter reporter plasmid by T4 DNA ligase. The correctly sequenced luciferase reporter plasmids WT and mutant type (MUT) were co-transfected with mimics NC and miR-302a mimics into NCI-H1299 cells, respectively. The cells were amassed and lysed after transfected 48 h, and luciferase activity was verified by luciferase detection kit (BioVision, San Francisco, CA, USA) and Glomax20/20 luminometer (Promega, Madison, Wisconsin, USA).
The targeting gene of miR-302a was predicted by bioinformatics software http://starbase.sysu.edu.cn/, the results demonstrated that MBNL3 3´UTR could bind to miR-302a, indicating that MBNL3 was target gene of miR-302a. The MBNL3 3´UTR sequence and the mutant sequence combined with the miR-302a were amplified, respectively, as well as MBNL3 3´-UTR-Wt and MBNL3 3´-UTR-Mut were constructed, respectively. The constructed vector was co-transfected with miR-302a mimic and its NC to into NCI-H1299 cells, respectively. The dual luciferase reporter gene detection kit was used to determine the luciferase activity of firefly and renilla. The luciferase activity was reckoned. The experiment was repeated three times, and the data were averaged.
RNA pull down assay
The cells were transfected with 50 nM biotin-labeled WT-bio-miR-302a and MUT-bio-miR-302a. After 48 h, the cells were gathered and rinsed with PBS. The cells were hatched in specific lysis buffer (Ambion, Austin, Texas, USA) for 10 min. Then 50 mL sample lysis was spaced out. The lysate was hatched 3 h with M-280 streptavidin magnetic beads (Sigma-Aldrich, St. Louis, MO, USA) precoated with RNase-free BSA and yeast tRNA (Sigma-Aldrich, St. Louis, MO, USA) overnight at 4°C. The cell lysate was cleaned with precooled pyrolysis buffer twice, with low salt buffer three times, and with high salt buffer once. An antagonistic miR-302a probe was established as an NC. The bound RNA was purified by Trizol and then SBF2-AS1 expression was verified by reverse transcription quantitative polymerase chain reaction (RT-qPCR).
Rt-qPCR
Total RNA from cancer tissue and NCI-H1299/NCI-H1299R cells was extracted by Trizol method (Invitrogen Inc., Carlsbad, CA, USA). The synthesis of cDNA was performed using GoldScript one-step RT-qPCR Kit (Applied Biosystems, Carlsbad, CA, USA) for lncRNA and mRNA and Hairpin-itTM miRNA quantitative detection Kit (Shanghai GenePharma Co. Ltd., Shanghai, China) for miRNA. Real-time fluorescence quantitative PCR reaction was carried out on ABI7500 fluorescence quantitative PCR with SYBR premix Ex TaqTM II PCR Kit (Takara Biotechnology Ltd., Dalian, China). PCR primers were devised and composed by Invitrogen (Carlsbad, California, USA) (Table 1), miR-302a used U6 as an internal parameter while SBF2-AS1 and MBNL3 with glyceraldehyde phosphate dehydrogenase (GAPDH) as an internal reference. The data were explicated by 2−ΔΔCt method.
Table 1.
Primer sequence.
| Gene | Sequence (5´→3´) |
|---|---|
| miR-302a | F: GGGGTAAGTGCTTCCATGTT |
| R: CAGTGCGTGTCGTGGAGT | |
| U6 | F: TTATGGGTCCTAGCCTGAC |
| R: CACTATTGCGGGCTGC | |
| SBF2-AS1 | F: AGACCATGTGGACCTGTCACTG |
| R: GTTTGGAGTGGTAGAAATCTGTC | |
| MBNL3 | F: TCCTGGAAACCCACCTCTT |
| R: CATCAGTAGGGTGAGCATAG | |
| GAPDH | F: CCACATCGCTCAGACACCAT |
| R: ACCAGGCGCCCAATACG |
Note: F, forward; R, reverse; miR-302a, microRNA-302a; SBF2-AS1, long non-coding RNA SBF2-AS1; MBNL3, muscleblind-like 3; GAPDH, glyceraldehyde phosphate dehydrogenase.
Western blot analysis
The total protein in human cancer tissues of the radiotherapy-sensitive group and the radiotherapy-resistant group and in the NCI-H1299/NCI-H1299R cells was amassed. Subsequently, a proper amount of concentrated 5 × sodium dodecyl sulfate polyacrylamide gel electrophoresis was utilized for protein separation, and then the proteins were electroblotted onto polyvinylidene difluoride (PVDF) membrane. Subsequently, PVDF membranes were flushed three times with Tris-buffered saline with Tween 20 (TBST), and blocked for 2 h with 5% skim milk powder. The primary antibody against MBNL3 (ab197590, 1:1000, Abcam, Cambridge, MA, USA) and GAPDH (ab181602, 1:10000, Abcam, Cambridge, MA, USA) were appended and hatched at 4°C for the night. The secondary antibody was diluted 3000 times with TBST. The gray value of the target band was explicated by Image J software with the addition of chemiluminescence liquid development.
Statistical analysis
All data were explicated by SPSS 21.0 software (IBM Corp. Armonk, NY, USA). The measurement data were expressed as mean ± standard deviation. Comparisons between two groups were conducted by independent sample t-test, while comparisons among multiple groups were assessed by one-way analysis of variance (ANOVA) and Fisher’s least significant difference t test (LSD-t) was carried out. P value < 0.05 was indicative of a statistically significant difference.
Results
General data of patients with NSCLC
As shown in Table 2, the general data of patients with NSCLC were analyzed, it demonstrated that the mean age of the radiotherapy-sensitive group and the radiotherapy-resistant group in NSCLC patients was (65.30 ± 13.89) years and (65.80 ± 15.66) years, respectively. It also revealed that there was no statistical significance between the two groups in terms of gender, age, surgical treatment, pathological stage and tumor type (all P> 0.05), while there existed difference in tumor-node-metastasis (TNM) stage and N stage (both P < 0.05).
Table 2.
Comparison of general characteristics of NSCLC patients in the radiotherapy-sensitive group and the radiotherapy-resistant group.
| Radiotherapy-sensitive group |
Radiotherapy-resistant group |
||
|---|---|---|---|
| Variable | n = 30 | n = 30 | P |
| Gender | |||
| Male | 20 | 18 | 0.789 |
| Female | 10 | 12 | |
| Age (year) | |||
| ≤ 60 | 12 | 16 | 0.437 |
| > 60 | 18 | 14 | |
| Surgical treatment | |||
| Single lung lobectomy | 12 | 15 | 0.732 |
| Bilobectomy | 10 | 8 | |
| Total pneumonectomy | 8 | 7 | |
| TNM stage | |||
| Ⅰ | – | – | 0.038 |
| II | 18 | 10 | |
| III | 12 | 20 | |
| N stage | |||
| N0 | – | – | 0.028 |
| N1 | 14 | 6 | |
| N2 | 16 | 24 | |
| Pathological types | |||
| I | – | – | 0.793 |
| II | 12 | 13 | |
| III | 18 | 17 | |
| Tumor type | |||
| Squamous cell carcinoma | 26 | 20 | 0.067 |
| Adenocarcinoma | 4 | 10 | |
Note: TNM stage, tumor-node-metastasis stage.
Up-regulation of SBF2-AS1 and MBNL3 and down-regulation of miR-302a in NSCLC tissues in the radiotherapy-resistant group
RT-qPCR was adopted to detect the expression of SBF2-AS1, miR-302a and MBNL3 in NSCLC tissues, the results of which presented that compared to the radiotherapy-sensitive group, the expression of SBF2-AS1 and MBNL3 mRNA raised, and the expression of miR-302a degraded in the radiotherapy-resistant group (all P < 0.05) (Figure 1(a)). Western blot assay revealed that in relation to the radiotherapy-sensitive group, MBNL3 protein expression was enhanced in the radiotherapy-resistant group (P < 0.05) (Figure 1(b, c)).
Figure 1.
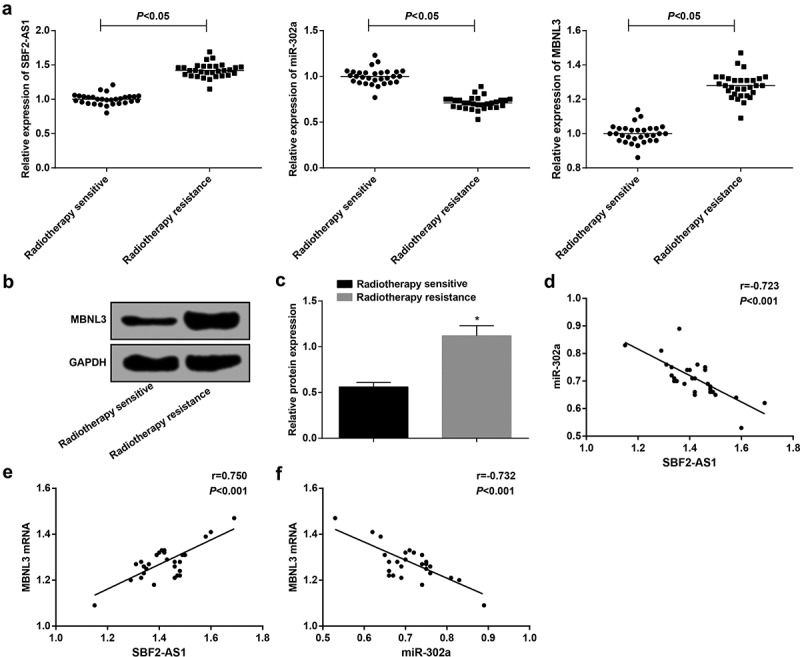
Overexpression of SBF2-AS1 and MBNL3 and low expression of miR-302a in NSCLC tissues. (a) Expression of SBF2-AS1, miR-302a and MBNL3 mRNA in the radiotherapy-sensitive group and the radiotherapy-resistant group. (b): Protein expression of MBNL3 in the radiotherapy-sensitive group and the radiotherapy-resistant group by western blot assay. (c) Quantification results of MBNL3 protein expression in Figure B. (d) Correlation between SBF2-AS1 and miR-302a expression analyzed by Pearson correlation analysis. (e) Correlation between SBF2-AS1 and MBNL3 mRNA expression analyzed by Pearson correlation analysis. (f) Correlation between MBNL3 mRNA and miR-302a expression by Pearson correlation analysis. * P < 0.05 vs. the radiotherapy sensitive group. Measurement data were expressed as mean ± standard deviation. Comparisons between two groups were conducted by independent sample t-test. N = 30.
It was suggested by Pearson correlation analysis that there was a negative correlation between SBF2-AS1 expression and miR-302a expression (r = −0.723, P < 0.05), a positive correlation between SBF2-AS1 expression and MBNL3 mRNA expression (r = 0.750, P < 0.05), and a negative correlation between miR-302a expression and MBNL3 mRNA expression (r = −0.732, P < 0.05) (Figure 1(d–f)).
Morphology of NCI-H1299 cells changed obviously after induced irradiation
By inducing irradiation on NCI-H1299 cells, it presented that the sublethal dose was determined to be 6 Gy after the NCI-H1299 cells were irradiated with an X-ray gradient dose induction by sublethal dose method. The obtained resistance strain was named H1299R, and the total irradiation was eight times for final success. After the NCI-H1299 induced irradiation was completed, the difference of the morphology of the parent strain NCI-H1299 cells and the radiation-resistant cells NCI-H1299R was observed under an inverted microscope, it was reported that NCI-H1299 parent strain cells were polygonal and had clear cell boundary, uniform density, moderate size, and regular morphology. After the irradiation, the cell morphology of the resistant strain NCI-H1299R was changed obviously and approached the fusiform, with decreased individual, unclear periphery, irregular shape, uneven density distribution and poor adherence to the wall, and some of the cells were necrosis and apoptosis (Figure 2).
Figure 2.
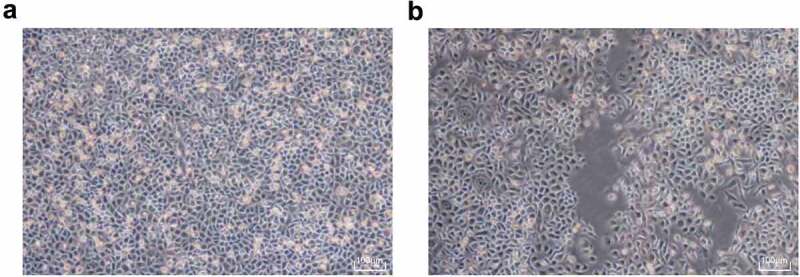
The morphology of NCI-H1299 and NCIH1299 R cells changed obviously after irradiation. (a) Morphological structure of NCIH1299 cells. (b) Morphological structure of NCIH1299 R cells.
Resistant cells are more radioresistant than parent cells
The radioresistance of parent and resistant cells was tested by colony formation assay (Figure 3(a)). The results displayed that after receiving 0, 2, 4, 6, 8 and 10 Gy dose X-ray irradiation for 12 d, the cell colony formed by parent and resistant strains reduced with the dose gradient of irradiation. At the same time, it was found that when the parent and the resistant strain cells were irradiated at the same dose, the colony number of the resistant strain was higher than that of the parent strain. The results indicated that the resistant strain was more resistant to radiation and showed strong colony formation ability.
Figure 3.
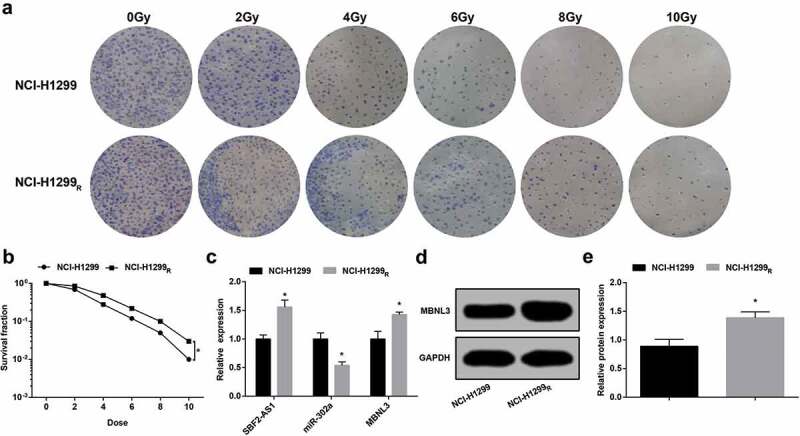
The resistant cells are more resistant to radiation than the parent cells. (a) Colony formation ability of NCI-H1299 and NCI-H299R cells irradiated with different doses. (b) Survival curve of NCI-H1299 and NCI-H299R cells irradiated with different doses. (c) Expression of SBF2-AS1, miR-302a and MBNL3 mRNA in NCI-H1299 and NCI-H299R cells. (d&e) Protein expression of MBNL3 in NCI-H1299 and NCI-H299R cells verified by western blot assay. N = 3, * P < 0.05 vs. NCI-H1299 cells. Measurement data were depicted as mean ± standard deviation, comparisons between two groups were conducted by independent sample t test.
By calculating the cell survival fraction of parent strain and resistant strain after different doses of irradiation, the cell survival curve was fitted. The cell survival curve revealed that the cell survival fraction of parent strain and resistant strain abated with the ascended of irradiation dose, but the reduce of parent strain was more obvious. Compared to the parent strain, the survival curve of the resistant strain shifted to the right. The survival fraction of the parent strain and the resistant strain under 6 Gy irradiation demonstrated that the survival fraction at 6 Gy of NCI-H1299R cells was 1.83 times higher than that of NCI-H1299 cells (P < 0.05) (Figure 3(b)).
These results suggested that the survival of NCI-H1299R cells was raised after irradiation, indicating that the resistant cells were more resistant to radiation than the parent cells.
SBF2-AS1 and MBNL3 expression raised and miR-302a expression degraded in NCI-H1299R cells
It was demonstrated by RT-qPCR that the expression of SBF2-AS1 in NCI-H1299R cells was higher while the expression of miR-302a was lower than NCI-H1299 cells (both P < 0.05) (Figure 3(c)).
RT-qPCR and western blot analysis displayed that in contrast with the NCI-H1299 cells, MBNL3 mRNA and protein expression in NCI-H1299R cells was elevated (both P < 0.05) (Figure 3(d,e)).
SBF2-AS1 and MBNL3 expression reduced while miR-302a expression enhanced in NCI-H1299 parental strain and resistant strain after transfection
RT-qPCR revealed that in the parent strain and the resistant strain, the expression of the SBF2-AS1 in the si-SBF2-AS1 group was reduced compared to the si-NC group, and miR-302a expression was elevated (P < 0.05) (Figure 4(a)). In relation to the mimics NC group, there was no distinct difference of SBF2-AS1 expression in the miR-302a mimics group (P > 0.05), but the expression of miR-302a raised (P < 0.05) (Figure 4(b)).
Figure 4.
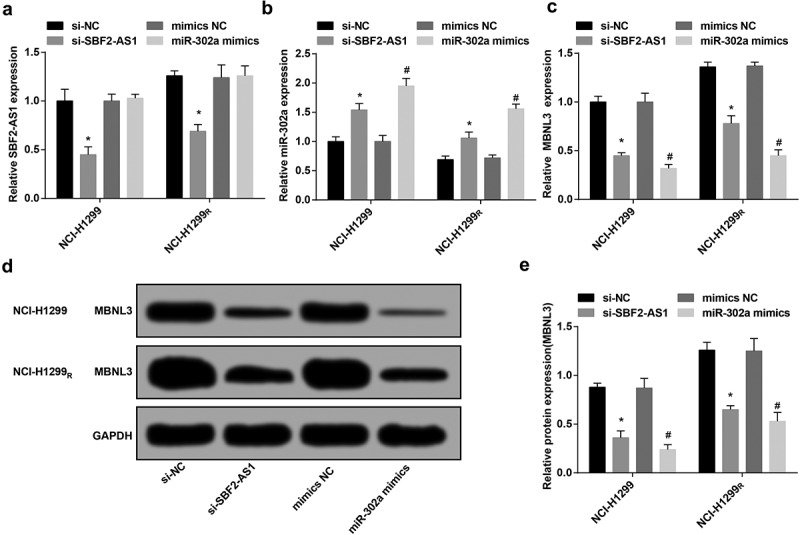
Down-regulated SBF2-AS1 and MBNL3 expression while up-regulated miR-302a expression in NCI-H1299 parental strain and resistant strain after transfection. (a) Expression of SBF2-AS1 in NCI-H1299 and NCI-H299R cells after transfection. (b) Expression of miR-302a in NCI-H1299 and NCI-H299R cells after transfection. (c) Expression of MBNL3 mRNA in NCI-H1299 and NCI-H299R cells after transfection. (d&e) Protein expression of MBNL3 in NCI-H1299 and NCI-H299R cells after transfected with si-SBF2-AS1 and miR-302a mimics verified by western blot assay. N = 3, * P < 0.05 vs. the si-NC group, # P < 0.05 vs. the mimics NC group. Measurement data were depicted as mean ± standard deviation, and comparisons between two groups were conducted by independent sample t-test, comparisons among multiple groups were assessed by one-way analysis of variance followed by LSD-t test.
The results of RT-qPCR and western blot analysis displayed that in the parent strain and the resistant strain, by comparison with the si-NC group, MBNL3 expression was degraded in the si-SBF2-AS1 group (P < 0.05). In contrast with the mimics NC group, MBNL3 expression was depressed in the miR-302a mimics group (P < 0.05) (Figure 4(c–e)).
Down-regulated SBF2-AS1 or up-regulated miR-302a restrains the proliferation of NCI-H1299 cells and reduces the radioresistance of NCI-H1299R cells
CCK-8 assay verified the cell viability of the parent strain and the resistant strain, the results presented that after irradiated with 6 Gy sublethal dose X-ray, the viability of NCI-H1299R cells was higher than that of NCI-H1299 cells, and the survival rate was higher than that of parent strain (P < 0.05). The results showed that the resistant strain had certain radioresistance to X-ray compared to the parent strain (Figure 5(a)). After irradiated with 6 Gy sublethal dose X-ray, compared to the si-NC group and the mimics NC group, the cell viability in the si-SBF2-AS1 group and the miR-302a mimics group was degraded in parent strain and resistant strain (all P < 0.05). The results demonstrated that the down-regulation of SB2-AS1 or up-regulation of miR-302a can suppress the proliferation of NCI-H1299 cells and decrease the radioresistance of NCI-H1299R cells (Figure 5(b–e)).
Figure 5.
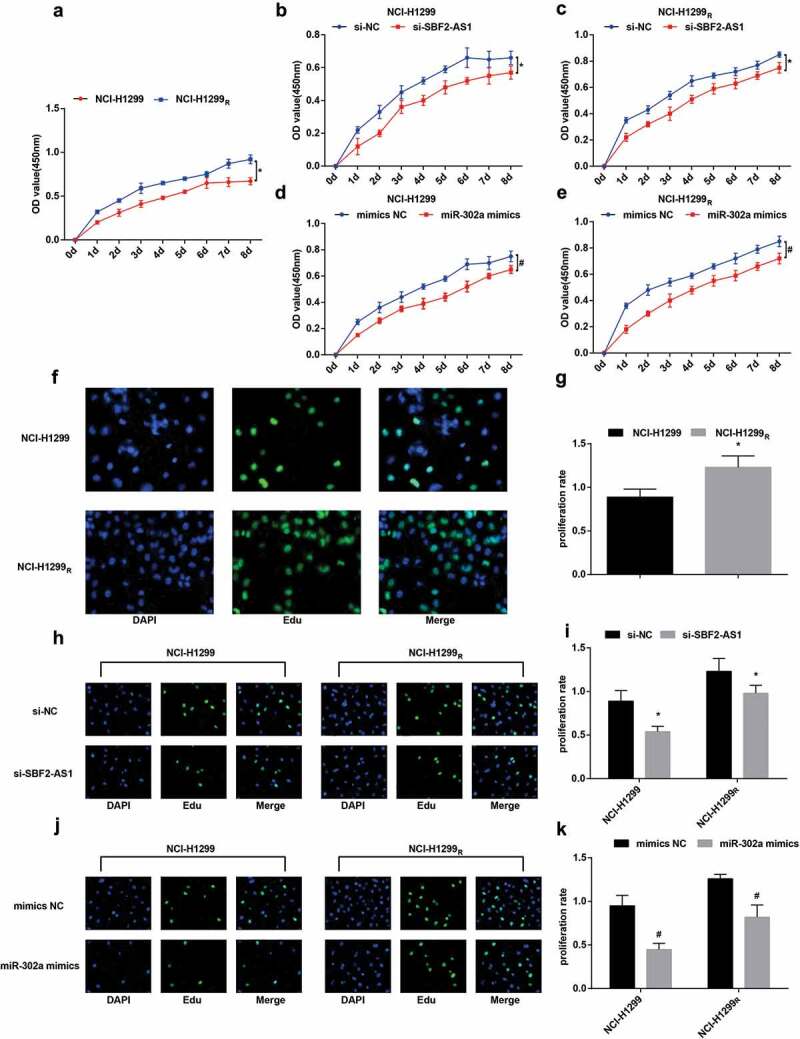
Down-regulation of SBF2-AS1 or up-regulation of miR-302a inhibits the proliferation of NCI-H1299 cells and decreases the radioresistance of the NCI-H1299R cells. (a) Proliferation curve of parent and resistant strains in NCIH1299 cells. (b) Proliferation curve of the parent strain in the NCI-H1299 cell transfected with si-SBF2-AS1. (c) Proliferation curve of resistant strain in NCI-H1299 cells transfected with si-SBF2-AS1. (d) Proliferation curve of the parent strain in the NCI-H1299 cells transfected with miR-302a mimics. (e) Proliferation curve of resistant strain in NCI-H1299 cells transfected with miR-302a mimics. (f): Detection of DNA replication activity of the parent strain and the resistant strain in the NCI-H1299 cells by EdU assay. (g) Quantification results of DNA replication activity in Figure f. (h) Detection of DNA replication activity of the parent and resistant strains in NCI-H1299 cells by EdU assay after transfected with si-SBF2-AS1. (i) Quantification results of DNA replication activity in Figure h. (j) Detection of DNA replication activity of the parent and resistant strains in NCI-H1299 cells by EdU assay after transfected with miR-302a mimics. (k) Quantification results of DNA replication activity in Figure j. N = 3, * P < 0.05 vs. NCI-H1299 cells in Figure a and g. * P < 0.05 vs. the si-NC group in Figure b, c and i. # P < 0.05 vs. the mimics NC group in Figures d, e and k. Measurement data were depicted as mean ± standard deviation, and data were assessed by independent sample t test.
EdU assay suggested that in relation to the parent strain of NCI-H1299 cells, the proliferation ability of NCI-H1299R cells was elevated and the replication rate of DNA was raised after the parent strain and the resistant strain were irradiated with 6 Gy sublethal dose X-ray (P < 0.05) (figure 5(f,g)). After the transfected parent strain and resistant strain were irradiated with 6 Gy sublethal dose X-ray, by comparison with the si-NC group and the mimics NC group, the proliferation ability of cells in the si-SBF2-AS1 group and the miR-302a mimics group was degraded in parent strain and resistant strain (all P< 0.05). The results indicated that down-regulating SBF2-AS1 or up-regulating miR-302a could suppress the proliferation of NCI-H1299 cells (Figure 5(h–k)).
Overexpression of miR-302a or low expression of SBF2-AS1 advances the apoptosis of NCI-H1299 cells and depress the radioresistance of NCI-H1299R cells
It was reported by flow cytometry that the apoptosis rate of NCI-H1299 cells was (7.43 ± 0.68)% after irradiated by 6 Gy sublethal dose X-ray. By comparison with NCI-H1299 cells, the apoptosis rate of NCI-H1299R cells was dropped to (4.13 ± 0.15)% (P < 0.05). The results demonstrated that the induced resistant strain had certain radioresistance to X-ray relative to the parent strain, and apoptosis was related to radiosensitivity (Figure 6(a,b)).
Figure 6.
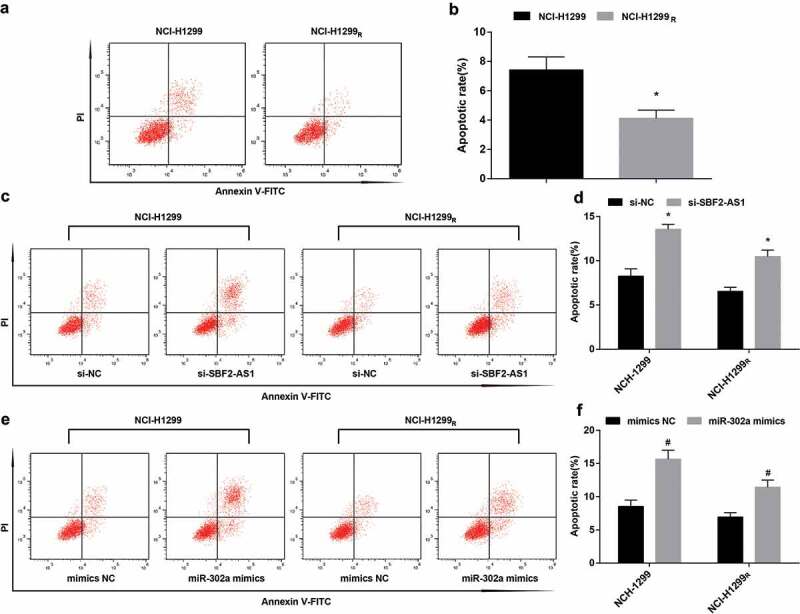
Up-regulation of miR-302a or down-regulation of SBF2-AS1 promotes the apoptosis of NCI-H1299 cells and decreases the radioresistance of NCI-H1299R cells. (a) Apoptosis of NCI-H1299 cells parent strain and resistant strain detected by flow cytometry. (b) Apoptosis rate of NCI-H1299 cells parent strain and resistant strain. (c) Apoptosis of NCI-H1299 cells and NCI-H1299R cells after transfected with si-SBF2-AS1 detected by flow cytometry. (d) Apoptosis rate of NCI-H1299 cells and NCI-H1299R cells after transfected with si-SBF2-AS1. (e): Apoptosis of NCI-H1299 cells and NCI-H1299R cells after transfected with miR-302a mimics detected by flow cytometry. (f) Apoptosis rate of NCI-H1299 cells and NCI-H1299R cells after transfected with miR-302a mimics. N = 3, * P < 0.05 vs. NCI-H1299 cells in Figure b, * P < 0.05 vs. the si-NC group in Figures d and f. # P < 0.05 vs. the mimics-NC group. Measurement data were depicted as mean ± standard deviation, and data were assessed by independent sample t test.
Flow cytometry demonstrated that after the transfected parent strain and resistant strain were irradiated with 6 Gy sublethal dose X-ray, by comparison with the si-NC group and the mimics NC group, the apoptosis of cells in the si-SBF2-AS1 group and the miR-302a mimics group was enhanced in parent strain and resistant strain (both P< 0.05). The results indicated that down-regulating SBF2-AS1 or up-regulating miR-302a could advance the apoptosis of NCI-H1299 cells and degrade the radioresistance of NCI-H1299R cells (Figure 6(c–f)).
Tumor growth of nude mice is slowed down after silencing SBF2-AS1 or up-regulating miR-302a
Tumor xenograft in nude mice revealed that the tumor formation rate of 24 nude mice was 100%, and there was no natural death during the experiment. In NCI-H1299 cells and NCI-H1299R cells, compared to the si-NC group and the mimic-NC group, the tumor growth and tumor volume in the si-SBF2-AS1 group and the miR-302a mimics group were reduced (all P < 0.05) (Figure 7(a,b), E-F).
Figure 7.
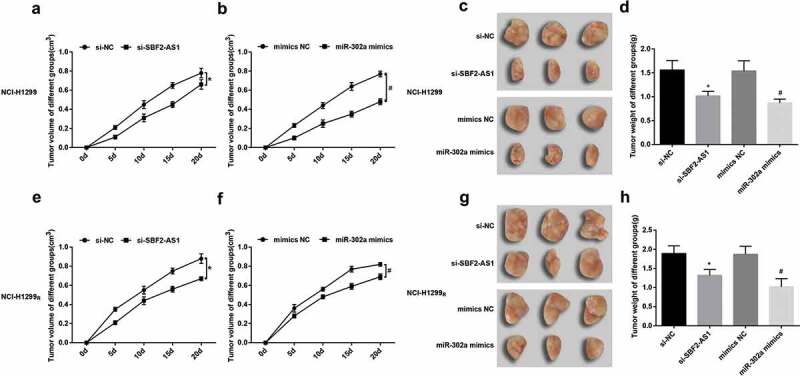
After silencing SBF2-AS1 or up-regulating miR-302a, tumor growth of nude mice was reduced. (a) Real-time monitoring of the transplanted tumor growth of NCI-H1299 cells after injected with si-SBF2-AS1. (b) Real-time monitoring of the transplanted tumor growth of NCI-H1299 cells after injected with miR-302a mimics. (c) Representative figure of the transplanted tumor in NCI-H1299 cells in nude mice treated with radiotherapy after injected with si-SBF2-AS1 and miR-302a mimics. (d) Statistics results of tumor weight in NCI-H1299 cells in nude mice treated with radiotherapy after injected with si-SBF2-AS1 and miR-302a mimics. (e) Real-time monitoring of the transplanted tumor growth of NCI-H1299R cells after injected with si-SBF2-AS1. (f) Real-time monitoring of the transplanted tumor growth of NCI-H1299 R cells after injected with miR-302a mimics. (g) Representative figure of the transplanted tumor of NCI-H1299R cells in nude mice treated with radiotherapy after injected with si-SBF2-AS1 and miR-302a mimics. (h) Statistics results of tumor weight in NCI-H1299R cells in nude mice treated with radiotherapy after injected with si-SBF2-AS1 and miR-302a mimics. * P < 0.05 vs. the si-NC group. # P < 0.05 vs. the mimics NC group. Measurement data were depicted as mean ± standard deviation, and comparisons between two groups were conducted by independent sample t-test, comparisons among multiple groups were assessed by one-way analysis of variance followed by LSD-t test.
After three times of 6 Gy X-ray treatment of nude mice in each group, it demonstrated that in NCI-H1299 cells and NCI-H1299R cells, in contrast with the si-NC group and the mimics-NC group, the tumor weight of the si-SBF2-AS1 group and the miR-302a mimics group was depressed. After irradiation, some tumor was fused and adsorbed (all P < 0.05) (Figure 7(c,d, g–h)).
SBF2-AS1 competitively binds with miR-302a
For the purpose of inquiring the mechanism of SBF2-AS1, the website (http://lncatlas.crg.eu/) predicted that SBF2-AS1 was mainly distributed in cytoplasm (Figure 8(a)). RNA-FISH proved that SBF2-AS1 was indeed concentrated in the cytoplasm, suggesting that SBF2-AS1 may function in the cytoplasm (Figure 8(b)). RNA22 website (https://cm.jefferson.edu/rna22/Precomputed/) revealed that SBF2-AS1 could combine with miR-302a (Figure 8(c)). Dual luciferase reporter gene assay presented that by comparison with the mimics NC group, luciferase activity reduced in the wt-SBF2-AS1 + miR-302a mimics group (P < 0.05), while there was no distinct change in the mut-SBF2-AS1 + miR-302a mimics group (P > 0.05), indicating that miR-302a may specifically bind to SBF2-AS1 (Figure 8(d)). RNA pull-down assay verified that SBF2-AS1 could be used as a ceRNA to adsorb miR-302a. The results reported that the enrichment level of SBF2-AS1 in the Bio-miR-302a-WT group was higher than that in the Bio-probe NC group (P < 0.05), while there was no distinct difference in the Bio-miR-302a-MUT group (P> 0.05) (Figure 8(e)). It was indicated that the SBF2-AS1 could be used as ceRNA to adsorb miR-302a, thereby affecting the expression of miR-302a.
Figure 8.
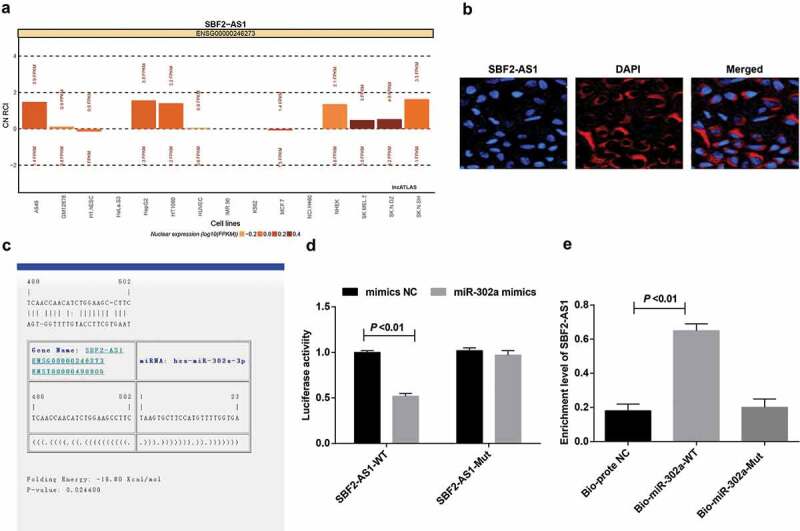
SBF2-AS1 acts as ceRNA to adsorb miR-302a. (a) Prediction of subcellular localization of SBF2-AS1 by online analysis website. (b) FISH assay verified the subcellular localization of SBF2-AS1. (c) Prediction of binding sites between SBF2-AS1 and miR-302a in RNA22 website. (d) Dual luciferase reporter gene assay detected the binding of SBF2-AS1 to miR-302a. (e) RNA pull-down assay verified the enrichment of SBF2-AS1 to miR-302a. Measurement data were depicted as mean ± standard deviation, comparisons between two groups were conducted by independent sample t test and comparisons among multiple groups were assessed by one-way analysis of variance followed by LSD-t test. The experiment was repeated three times.
MBNL3 is the target gene of miR-302a
The target sites of MBNL3 binding to corresponding miR-302a were determined by online prediction software http://starbase.sysu.edu.cn/, and there showed a binding site between MBNL3 and miR-302a (Figure 9(a)). On the basis of the results of luciferase activity assay, we found that miR-302a mimics had no distinct effect on luciferase activity in the mut-miR-302a/MBNL3 plasmid (P > 0.05), but luciferase activity depressed in the wt-miR-302a/MBNL3 plasmid (P < 0.05) (Figure 9(b)).
Figure 9.
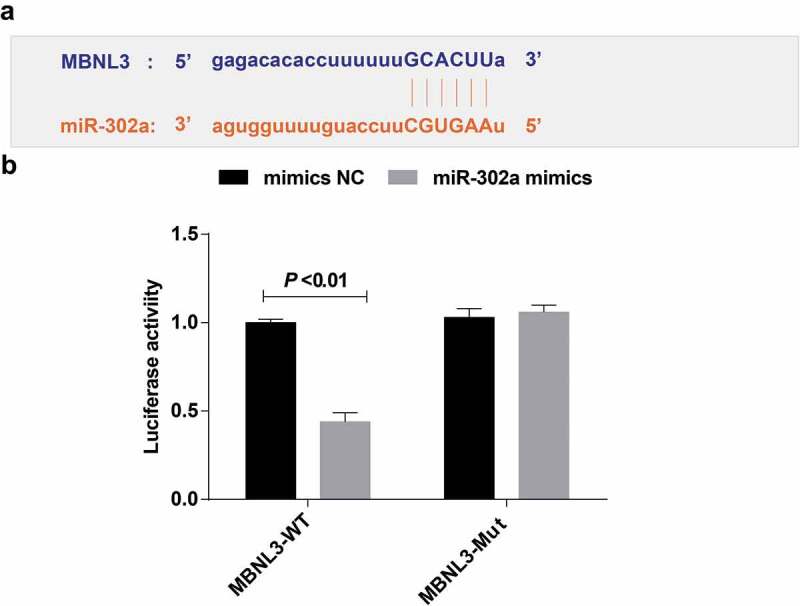
The target relationship among MBNL3 and miR-302a. (a) http://starbase.sysu.edu.cn/predicted the target site of MBNL3 binding to the corresponding miR-302a. (b) Detection results of luciferase activity by dual luciferase reporter gene assay. Measurement data were depicted as mean ± standard deviation. The experiment was repeated three times. Comparisons between two groups were conducted by independent sample t-test.
Discussion
Lung cancer remains the leading cause of cancer-related deaths around the world [16]. It is customarily considered that the overexpression of SBF2-AS1 in NSCLC tissues and cells is related to the clinical progress and poor prognosis of NSCLC patients [17]. A previous study has proved the tumor suppressor capability of several miRNAs such as miR-331-3p, miR-142-3p and miR-193a-3p in NSCLC [18–20]. Also, it has been revealed that some of the CCCH genes like MBNL3 are enriched in macrophages associated organs, such as lung [15]. It had also been verified that the existence of radioresistant cancer cells may be related to the recurrence or adverse outcome of disease after radiotherapy [21]. The major cause of the current treatment failure is the chemotherapeutic drugs resistant, radiation resistant and metastatic propensity [22], while the resistance of radiotherapy is the main bottleneck during the treatment of NSCLC [23]. As the related mechanisms of SBF2-AS1 in NSCLC remain to be excavated, our study was to inquire the impact of lncRNA SBF2-AS1 on radiosensitivity of NSCLC through modulating miR-302a and MBNL3 expression.
In this study, there presented overexpression of SBF2-AS1 and low expression of miR-302a in NCI-H1299 cells and NSCLC tissues. Consistent with our study, a study reported that the expression of SBF2-AS1 in NSCLC tissue samples was distinctly higher than that of the corresponding noncancerous tissue sample [17]. Another study has presented that SBF2‑AS1 has been confirmed to be up-regulated in NSCLC and can advance the proliferation of NSCLC cells [24]. A previous study has proved that miR-302a-5p were obviously down-regulated in endometrial cancer tissues, which were negatively correlated with HMGA2 [25]. It has been suggested that the expression of miR-302a, miR-302b and miR-302c in gastric cancer was obviously degraded by comparison with those in matched normal mucosa [26]. Moreover, it was demonstrated in our study that SBF2-AS1 adsorbed miR-302a as a ceRNA while MBNL3 was the target gene of miR-302a. It has been reported that SNHG16 interacts with miR-302a-3p and suppresses its expression [27]. Furthermore, miR-30-5p modulates muscle differentiation and the selective splicing of and muscle-related genes via targeting MBNL [13].
In addition, it was revealed that down-regulated SBF2-AS1 and up-regulated miR-302a increased the radiosensitivity of NSCLC cells, advanced the apoptosis and inhibited the proliferation of NSCLC cells. It has been suggested previously that the upregulation of SBF2-AS1 boosts the proliferation of NSCLC [24]. It is reported that miR-302a was declined in endometrial cancer cells and it has an inhibitory effect on cell proliferation and migration [28]. Another study has verified that the up-regulation of SBF2-AS1 in NSCLC can boosts the proliferation of NSCLC cells both in vitro and in vivo, implying that SBF2-AS1 can play a role as a tumor promoter [9]. It is displayed that the upregulation of miR-302a can obviously repress the proliferation of ovarian cancer cells and advance cell apoptosis [29]. Another study also proved that the decrease of miR-302 expression will lead to the radiation resistance and recovery of miR-302 baseline expression makes breast cancer cells sensitive to radiotherapy, suggesting that miR-302 is a potential radiotherapy sensitizer [30]. MBNL3 advances tumorigenesis, suggesting that the prognosis of hepatocellular carcinoma (HCC) patients is poor, and downregulation of MBNL3 almost completely cancels HCC tumorigenesis [7].
In conclusion, our study provides evidence that inhibition of SBF2-AS1 or high expression of miR-302a enhances the sensitivity of radiotherapy for NSCLC and promotes the apoptosis of NSCLC cells via down-regulation of MBNL3. This paper suggests that this regulatory axis may be a potential therapeutic target to improve the sensitivity response of NSCLC to radiotherapy.
Funding Statement
This study was supported by General Program of Natural Science Foundation of Liaoning Province(2015020464), Major Science and Technology Platform of Liaoning Higher Institution (No.2916009), Science Research Foundation for Absorbed Talents Program of Liaoning Cancer Hospital and Special Project of Applied Technology of Population and Health by Shenyang Science and Technology Plan (No.18-014-4-04); General Program of Natural Science Foundation of Liaoning Province [2015020464];Science Research Foundation for Absorbed Talents Program of Liaoning Cancer Hospital and Special Project of Applied Technology of Population and Health by Shenyang Science and Technology Plan [18-014-4-04]; Major Science and Technology Platform of Liaoning Higher Institution [2916009].
Acknowledgments
We would like to acknowledge the reviewers for their helpful comments on this pap.
Authors’ contributions
Guarantor of integrity of the entire study: Zhanwu Yu
Study design: Hongxu Liu, Gebang Wang
Experimental studies: Chenlei Zhang, Yu Liu
Manuscript editing: Wei Chen, Haoyou Wang
Disclosure statement
No potential conflict of interest was reported by the authors.
References
- [1].Osmani L, Askin F, Gabrielson E, et al. Current WHO guidelines and the critical role of immunohistochemical markers in the subclassification of non-small cell lung carcinoma (NSCLC): moving from targeted therapy to immunotherapy. Semin Cancer Biol. 2018;52(Pt 1):103–109. [DOI] [PMC free article] [PubMed] [Google Scholar]
- [2].Walia R, Jain D, Madan K, et al. p40 & thyroid transcription factor-1 immunohistochemistry: A useful panel to characterize non-small cell lung carcinoma-not otherwise specified (NSCLC-NOS) category. Indian J Med Res. 2017;146(1):42–48. [DOI] [PMC free article] [PubMed] [Google Scholar]
- [3].Chen W, Zheng R, Baade PD, et al. Cancer statistics in China, 2015. CA Cancer J Clin. 2016;66(2):115–132. [DOI] [PubMed] [Google Scholar]
- [4].Qiu M, Chen Y-B, Jin S, et al. Research on circadian clock genes in non-small-cell lung carcinoma. Chronobiol Int. 2019;36(6):739–750. [DOI] [PubMed] [Google Scholar]
- [5].Lee K, Oh EG, Kim S, et al. Symptom experiences and health-related quality of life among non-small cell lung cancer patients participating in clinical trials. J Clin Nurs. 2019;28(11–12):2111–2123. [DOI] [PubMed] [Google Scholar]
- [6].Park G, Son B, Kang J, et al. LDR-induced miR-30a and miR-30b target the PAI-1 pathway to control adverse effects of NSCLC radiotherapy. Mol Ther. 2019;27(2):342–354. [DOI] [PMC free article] [PubMed] [Google Scholar]
- [7].Yuan J-H, Liu X-N, Wang -T-T, et al. The MBNL3 splicing factor promotes hepatocellular carcinoma by increasing PXN expression through the alternative splicing of lncRNA-PXN-AS1. Nat Cell Biol. 2017;19(7):820–832. [DOI] [PubMed] [Google Scholar]
- [8].Tian YJ, Wang Y-H, Xiao A-J, et al. Long noncoding RNA SBF2-AS1 act as a ceRNA to modulate cell proliferation via binding with miR-188-5p in acute myeloid leukemia. Artif Cells Nanomed Biotechnol. 2019;47(1):1730–1737. [DOI] [PubMed] [Google Scholar]
- [9].Zhao QS, Li L, Zhang L, et al. Over-expression of lncRNA SBF2-AS1 is associated with advanced tumor progression and poor prognosis in patients with non-small cell lung cancer. Eur Rev Med Pharmacol Sci. 2016;20(14):3031–3034. [PubMed] [Google Scholar]
- [10].Wang Y, Zhao L, Xiao Q, et al. miR-302a/b/c/d cooperatively inhibit BCRP expression to increase drug sensitivity in breast cancer cells. Gynecol Oncol. 2016;141(3):592–601. [DOI] [PubMed] [Google Scholar]
- [11].Lin S-L, Chang DC, Ying S-Y, et al. MicroRNA miR-302 inhibits the tumorigenecity of human pluripotent stem cells by coordinate suppression of the CDK2 and CDK4/6 cell cycle pathways. Cancer Res. 2010;70(22):9473–9482. [DOI] [PubMed] [Google Scholar]
- [12].Tian Y, Zhang Y, Hurd L, et al. Regulation of lung endoderm progenitor cell behavior by miR302/367. Development. 2011;138(7):1235–1245. [DOI] [PMC free article] [PubMed] [Google Scholar]
- [13].Zhang BW, Cai HF, Wei XF, et al. miR-30-5p regulates muscle differentiation and alternative splicing of muscle-related genes by targeting MBNL. Int J Mol Sci. 2016;17(2):182. [DOI] [PMC free article] [PubMed] [Google Scholar]
- [14].Lee KS, Cao Y, Witwicka HE, et al. RNA-binding protein muscleblind-like 3 (MBNL3) disrupts myocyte enhancer factor 2 (Mef2) {beta}-exon splicing. J Biol Chem. 2010;285(44):33779–33787. [DOI] [PMC free article] [PubMed] [Google Scholar]
- [15].Liang J, Song W, Tromp G, et al. Genome-wide survey and expression profiling of CCCH-zinc finger family reveals a functional module in macrophage activation. PLoS One. 2008;3(8):e2880. [DOI] [PMC free article] [PubMed] [Google Scholar]
- [16].Sun C.C, Li S-J, Yuan Z-P, et al. MicroRNA-346 facilitates cell growth and metastasis, and suppresses cell apoptosis in human non-small cell lung cancer by regulation of XPC/ERK/Snail/E-cadherin pathway. Aging (Albany NY). 2016;8(10):2509–2524. [DOI] [PMC free article] [PubMed] [Google Scholar] [Retracted]
- [17].Zhang Y, Li Y, Han L, et al. SBF2-AS1: an oncogenic lncRNA in small-cell lung cancer. J Cell Biochem. 2019;120:15422-15428. [DOI] [PubMed] [Google Scholar]
- [18].Li X, Zhu J, Liu Y, et al. MicroRNA-331-3p inhibits epithelial-mesenchymal transition by targeting ErbB2 and VAV2 through the Rac1/PAK1/beta-catenin axis in non-small-cell lung cancer. Cancer Sci. 2019;110(6):1883–1896. [DOI] [PMC free article] [PubMed] [Google Scholar]
- [19].Xiao P, Liu WL.. MiR-142-3p functions as a potential tumor suppressor directly targeting HMGB1 in non-small-cell lung carcinoma. Int J Clin Exp Pathol. 2015;8(9):10800–10807. [PMC free article] [PubMed] [Google Scholar]
- [20].Fan Q, Hu X, Zhang H, et al. MiR-193a-3p is an important tumour suppressor in lung cancer and directly targets KRAS. Cell Physiol Biochem. 2017;44(4):1311–1324. [DOI] [PubMed] [Google Scholar]
- [21].Sui X, Geng J, Li Y-H, et al. Calcium channel α2δ1 subunit (CACNA2D1) enhances radioresistance in cancer stem-like cells in non-small cell lung cancer cell lines. Cancer Manag Res. 2018;10:5009–5018. [DOI] [PMC free article] [PubMed] [Google Scholar]
- [22].Ling C, Xie Y, Zhao D, et al. Enhanced radiosensitivity of non-small-cell lung cancer (NSCLC) by adenovirus-mediated ING4 gene therapy. Cancer Gene Ther. 2012;19(10):697–706. [DOI] [PubMed] [Google Scholar]
- [23].Chen X, Xu Y, Liao X, et al. Plasma miRNAs in predicting radiosensitivity in non-small cell lung cancer. Tumour Biol. 2016;37(9):11927–11936. [DOI] [PMC free article] [PubMed] [Google Scholar]
- [24].Lv J, Qiu M, Xia W, et al. High expression of long non-coding RNA SBF2-AS1 promotes proliferation in non-small cell lung cancer. J Exp Clin Cancer Res. 2016;35:75. [DOI] [PMC free article] [PubMed] [Google Scholar]
- [25].Ma J, Li D, Kong -F-F, et al. miR-302a-5p/367-3p-HMGA2 axis regulates malignant processes during endometrial cancer development. J Exp Clin Cancer Res. 2018;37(1):19. [DOI] [PMC free article] [PubMed] [Google Scholar]
- [26].Ma G, Li Q, Dai W, et al. Prognostic implications of miR-302a/b/c/d in human gastric cancer. Pathol Oncol Res. 2017;23(4):899–905. [DOI] [PubMed] [Google Scholar]
- [27].Li W, Xu W, Song JS, et al. LncRNA SNHG16 promotes cell proliferation through miR-302a-3p/FGF19 axis in hepatocellular carcinoma. Neoplasma. 2019;66(3):397–404. [DOI] [PubMed] [Google Scholar]
- [28].Li X, Liu LL, Yao JL, et al. Human umbilical cord mesenchymal stem cell-derived extracellular vesicles inhibit endometrial cancer cell proliferation and migration through delivery of exogenous miR-302a. Stem Cells Int. 2019;2019:8108576. [DOI] [PMC free article] [PubMed] [Google Scholar]
- [29].Guo T, Yu W, Lv S, et al. MiR-302a inhibits the tumorigenicity of ovarian cancer cells by suppression of SDC1. Int J Clin Exp Pathol. 2015;8(5):4869–4880. [PMC free article] [PubMed] [Google Scholar]
- [30].Liang Z, Ahn J, Guo D, et al. MicroRNA-302 replacement therapy sensitizes breast cancer cells to ionizing radiation. Pharm Res. 2013;30(4):1008–1016. [DOI] [PMC free article] [PubMed] [Google Scholar]


