

Abstract
Background
Angiogenesis and hypoxia-inducible factor 1α (HIF-1α) play major roles in solid tumors. This study aimed to establish a longitudinal and multimodal imaging model for in vivo evaluation of HIF1α and angiogenesis in breast cancer.
Methods
By transfection of a 5 hypoxia-responsive element (HRE)/green fluorescent protein (GFP) plasmid, the cell line Ca761-hre-gfp was established, which emitted green fluorescence triggered by HIF-1α under hypoxia. The cells were subjected to CoCl2-simulated hypoxia to confirm the imaging strategy. We grew Ca761-hre-gfp cells in the left rear flanks of twelve 615 mice. Experiments were conducted on days 4, 9, 15, and 19. For in vivo analysis, Ca761-hre-gfp subcutaneous allografted tumors were imaged in vivo using contrast-enhanced ultrasound (CEUS) and fluorescence imaging (FLI) during tumor development. The tumor size, CEUS peak intensity, and FLI photons were measured to evaluate tumor growth, angiogenesis, and HIF-1α activity, respectively. After each experiment, three mice were randomly sacrificed and tumor specimens were collected to examine HIF-1α activity and the microvessel density (MVD).
Results
In vitro, both green fluorescence and HIF-1α expression were detected in Ca761-hre-gfp cells treated with CoCl2, indicating the suitability of the cells to detect HIF-1α activity. In vivo, HIF-1α activity first increased and then decreased, which was significantly correlated with angiogenic changes (r = 0.803, P = 0.005). These changes were confirmed by immunohistochemical staining of HIF-1α and MVD.
Conclusions
The findings validated the Ca761-hre-gfp murine allograft model for reliable evaluation of HIF-1α activity and angiogenesis longitudinally using both molecular and pre-clinical non-invasive imaging modalities. The cell line may be useful for studies of anti-HIF pathway therapies.
Keywords: Breast cancer, Hypoxia-inducible factor 1, Pathological neovascularization, Ultrasonography, Fluorescence imaging
Introduction
Neovascularization fulfilling the metabolic demands of a solid tumor from the dormant phase to advanced phase plays a significant role in tumor development, invasion, and metastasis.[1–3] Assessment of neovascularization to analyze tumor differentiation should be conducted throughout the whole process of cancer diagnosis, curative effect evaluation, and prognosis estimation. Hypoxia-inducible factor 1 (HIF-1) is a key transcription factor in malignant tumor angiogenesis.[4] It is a dimer transcription factor consisting of α and β sub-units. HIF-1α is the functional sub-unit that is degraded by proteasomes under normoxia, which stabilizes and accumulates under hypoxia. HIF-1β is the structural sub-unit that is expressed stably and constitutively.[4,5] By binding to a hypoxia-responsive element (HRE), HIF-1 triggers the transcription of many genes including those associated with angiogenesis.[4,6,7] Anti-angiogenesis therapies, such as targeting the HIF-1 pathway, have been shown to be promising for solid tumor treatment.[4,6] Thus, a flexible and convenient imaging method to monitor angiogenesis is of great use for both pre-clinical studies and clinical practice.
Our study investigated the feasibility of dynamic visualization and quantification of angiogenesis and HIF-1α activity, and explored changes in HIF-1α and angiogenesis during breast cancer growth in vivo. To assess angiogenesis and HIF-1, contrast-enhanced ultrasound (CEUS) and fluorescence imaging (FLI) were employed, respectively. CEUS not only shows the tumor blood vessel morphology, but is also used to analyze tumor perfusion quantitatively, rendering it as one of the best tools for tumor diagnosis and repeated angiogenesis assessment in vivo.[8] FLI, which is based on detection of light emitted by living cells with a cooled charged-coupled device (CCD) digital camera, has become increasingly adopted for cancer studies.[9–11]
In detail, we used a HIF-1α reporter gene, 5HRE/GFP, stably transfected into murine breast cancer cell line Ca761 (Ca761-hif-gfp). We performed both in vitro and in vivo analyses to demonstrate that this cell line was useful to evaluate angiogenesis and HIF-1α activity during breast cancer growth. This pre-clinical allografted model can provide useful information regarding tumor angiogenesis and may facilitate not only studying the tumor microenvironment, but also evaluating the effects of anti-angiogenesis therapies.
Methods
Ethics approval
This study was approved by the Ethics Committee of Peking Union Medical College Hospital. All animals used in this study were handled according to the National Institutes of Health guide for the care and use of laboratory animals (NIH Publication No. 8023, revised 1978).
Cell line and culture
Ca761 murine breast cancer cells were obtained from the Cell Resource Centre of Peking Union Medical College. The cells were cultured in Dulbecco modified Eagle medium (Hyclone, Logan, UT, USA) supplemented with 5% fetal bovine serum (Hyclone) at 37°C with 5% CO2.
Cell transfection and establishment of Ca761-hre-gfp cells
Ca761-hre-gfp cells were established using a method that we have reported previously.[12] The 5HRE/GFP plasmid[13] (kindly provided by Martin Brown and Thomas Foster, Addgene plasmid #46926; http://n2t.net/addgene: 46926; RRID: Addgene_46926) contains five copies of a 35-bp fragment from the HRE of the human vascular endothelial growth factor gene, a human cytomegalovirus minimal promoter, and destabilized enhanced green fluorescent protein gene. The 5HRE/GFP transfection method was carried out according to the Lipofectamine 2000 (Invitrogen, Carlsbad, CA, USA) protocol. After transfection, monoclonal cells were selected and incubated with 200 μmol/L CoCl2 for 16 h. CoCl2 as an inhibitor of the critical enzyme prolyl hydroxylase in HIF-1α degradation was used to stimulate hypoxia. The cell line with the best inducibility under fluorescence microscopy was selected and named Ca761-hre-gfp.
Western blotting
Ca761-hif-gfp cells were treated with 100 and 200 μmol/L CoCl2 for 16 h. Cells without CoCl2 treatment were used as the negative control. The following primary antibodies were used: anti-HIF-1α (1:1000, Novus Biologicals, Littleton, CO, USA) and anti-glyceraldehyde-3-phosphate dehydrogenase (1:1000, Santa Cruz Biotechnology, Santa Cruz, CA, USA). Enhanced chemiluminescent Super Signal West Pico Chemiluminescent Substrate (Pierce, Rockford, IL, USA) was applied to visualize the bands. Immunoreactive protein bands were detected by an LAS-4000 fluorescence/chemiluminescence imager (GE Healthcare, Milwaukee, WI, USA).
Tumor implantation
Twelve female 615 mice (6 weeks old, weighing 16–18 g) were purchased from the Institute of Haematology and Blood Disease Hospital, Chinese Academy of Medical Sciences & Peking Union Medical College. A total of 2 × 10⁷ Ca761-hre-gfp cells (0.1 mL of cell suspension) was subcutaneously injected into the left rear flank of the mice. Experiments were conducted on days 4, 9, 15, and 19 based on the tumor size and condition of tumor-bearing mice after inoculation. After each experiment, three mice were randomly sacrificed to collect tumor tissues.
Conventional ultrasound and CEUS
Conventional ultrasound and CEUS were performed using an iU22 ultrasound scanner (Philips Healthcare, Best, the Netherlands) with a linear array transducer (L12-5). The largest tumor section was clearly displayed by grey-scale ultrasound. The longitudinal axis A and anteroposterior axis B of the tumor were measured, and the probe was rotated 90° to measure the transverse axis C. The tumor volume was calculated using the following formula: volume = π/6 × A × B × C. The CEUS mode was used along with a mechanical index of 0.07, total gain of 80%, single-point focusing of the deepest area of the image, and imaging depth of 2.5 cm. These scanner settings were used for all mice. The contrast agent SonoVue (Bracco, Milan, Italy) dissolved in physiological saline was used. For all CEUS analyses, a 0.1 mL/20 g bolus of the suspension was injected into the retro-orbital vein using a 25 G needle. The bolus injection was performed within 1 s to minimize variations in the injection technique.
Off-line evaluation was performed using QontraXt V3.06 software (AMID-Qx3, Bracco, Milan, Italy) and a bolus kinetic model. Initially, a region of interest (ROI) drawn along the margin of the tumor was selected. The peak intensity was defined as the maximum increase in signal intensity produced by the bolus contrast agent injection.
FLI
Animals were imaged using a NightOWL II LB 983 system (Berthold Technologies, Bad Wildbad, Germany) equipped with a highly sensitive Peltier-cooled backlit CCD camera. Mice were placed in the NightOWL light-tight chamber for imaging with an exposure time of 5 s and 470-nm excitation and 500-nm emission filters. All measurements were performed under the same conditions including camera settings, exposure time, and distances between the lenses and animals. Data were analyzed using WinLight32 software supplied by the manufacturer. Initially, an ROI drawn along the margin of the tumor was selected, and intensity was represented by a color scale with blue as the lowest and red as the highest. Photons were calculated for each mouse using the optical instrumentation software.
Microvessel density (MVD) and HIF-1α
Three mice were randomly sacrificed immediately after CEUS and FLI experiments each time. Their tumors were collected, fixed in 4% polyoxymethylene, and embedded in paraffin. Tumors were sectioned (4 μm) along the direction of the CEUS scan to obtain corresponding pathological sections that were then stained with hematoxylin and eosin for morphological evaluation.
The following primary antibodies were used for immunohistochemistry (IHC): anti-HIF-1α (28b, 1:200, Santa Cruz Biotechnology, Santa Cruz, CA, USA) and anti-CD34 (BI-3C5, 1:200, Santa Cruz Biotechnology, Santa Cruz, CA, USA).
Immunoreactivity was evaluated and scored for cytoplasmic or nuclear localization in terms of the percentage of positive cells. A staining index (values 0–10) was determined by multiplying the staining intensity score (none = 0, weak = 1, and strong = 2) with the score for the proportion of positively stained tumor cells (0%–10% = 1, 11%–30% = 2, 31%–50% = 3, 51%–75% = 4, and 76%–100% = 5). A staining grade was determined by the staining index, namely grade 0 = 0, grade 1 = 1–3, grade 2 = 4–6, and grade 3 = 7–10.
The MVD was quantified by the Weidner method.[14] Tumor sections subjected to IHC were scanned under low magnification (×40) to identify areas with a high vascular density. The MVD was measured in five fields by counting the number of CD34-stained vessels at ×200 magnification. The mean value per section was considered as the MVD of the sample.
Statistical analysis
All data are presented as the mean ± standard deviation (SD). Statistical analysis was performed by one-way analysis of variance to detect significant differences (P < 0.05) using SPSS 20.0 software (SPSS, Inc., IBM, Armonk, NY, USA). P values were derived from two-tailed tests. The Pearson and Spearman correlation coefficient r was determined to assess the degree of correlation.
Results
Establishment of the Ca761-hre-gfp cell line
To establish a reporter system of HIF-1α activity, Ca761 cells were transfected with the 5HRE/GFP plasmid. Because transcription of gfp was triggered by HIF-1α, the green fluorescence reflected HIF-1α transcriptional activity [Figure 1]. No green fluorescence was detected in Ca761-hre-gfp cells under normoxia, whereas green fluorescence was observed by fluorescence microscopy in Ca761-hre-gfp cells treated with 200 μmol/L CoCl2 for 16 h, indicating expression of GFP [Figure 2A–D]. Cells with the highest fluorescence intensity under fluorescence microscopy were selected as the Ca761-hre-gfp cell line. Compared with cells under normoxia, elevated HIF-1α expression in Ca761-hre-gfp cells treated with CoCl2 for 16 h was detected by Western blotting, and the expression level was elevated further with increasing CoCl2 concentrations [Figure 3].
Figure 1.
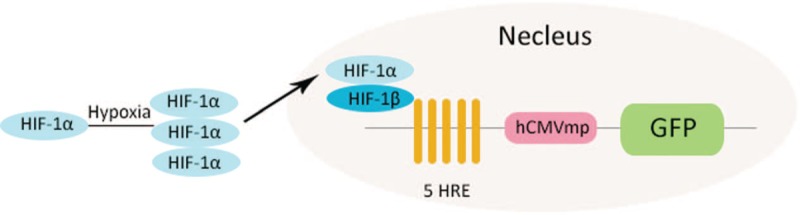
Mechanism of the 5HRE/GFP plasmid in Ca761-hre-gfp cells. Under hypoxia, HIF-1α becomes stabilized. The accumulated HIF-1α transfers into the nucleus and combines with HIF-1β to form a heterodimer. The heterodimers binds to HREs and initiates gfp transcription and translation. GFP: Green fluorescent protein; HIF-1: Hypoxia-inducible factor 1; HRE: Hypoxia-responsive element.
Figure 2.

GFP expression in Ca761-hre-gfp cells. The same field of view of Ca761-hre-gfp cells under normoxia in white light microscopy (A) and blue light excitation fluorescence microscopy (B). The same field of view of Ca761-hif-gfp cells treated with 200 μmol/L CoCl2 for 16 h shown by white light microscopy (C) and blue light excitation fluorescence microscopy (D). GFP: Green fluorescent protein.
Figure 3.

Protein expression of HIF-1α in Ca761-hre-gfp cells. The protein expression of HIF-1α in Ca761-hre-gfp cells with different treatments is shown. HIF-1α: Hypoxia-inducible factor 1α, GAPDH: Glyceraldehyde-3-phosphate dehydrogenase.
Murine breast allografted tumors
To non-invasively monitor angiogenesis and HIF-1α activity in vivo, 12 Ca761-hre-gfp allografted tumors were established. Tumors grew slowly before day 9, but their growth accelerated thereafter. Necrotic tissues first emerged on day 4 and enlarged along with tumor growth [Figure 4A].
Figure 4.

H&E staining, FLI, CEUS, HIF-1α expression, and MVD on days 4, 9, 15, and 19. (A) H&E staining of allografted tumors (original magnification ×0.35). (B) Typical fluorescence imaging of an allografted tumor. (C) Typical CEUS imaging of an allografted tumor. Red line indicates the tumor border. (D) MVD of a day 4 allografted tumor (immunohistochemistry staining for anti-CD34, original magnification ×200). (E) HIF-1α expression in a day 4 allografted tumor (IHC staining for HIF-1α, original magnification ×200). The staining grade is grade 1. FLI: Fluorescence imaging; GFP: Green fluorescent protein; H&E: Hematoxylin and eosin; HIF-1α: Hypoxia-inducible factor 1α; HRE: Hypoxia-responsive element.
FLI and CEUS of breast allografted tumors
FLI was used to assess HIF-1α activity. On day 4, a clear fluorescent signal began to emerge, increasing up to day 15 and decreasing thereafter [Figure 4B]. In detail, the average numbers of photons were 1.02 ± 0.82, 2.13 ± 1.09, 4.01 ± 0.57, and 2.11 ± 1.09 ph/s on days 4, 9, 15, and 19 [Figure 5A], respectively (P = 0.024).
Figure 5.

Results of photons, peak intensity, and MVD. (A) FLI photons. (B) CEUS peak intensity. (C) CEUS peak intensity and FLI photons showed a good correlation (r = 0.803, P = 0.005). (D) MVD. (E) IHC results of the MVD changes did not correlate with the results of the CEUS peak intensity analysis (r = −0.430, P = 0.215). (F) The IHC results of HIF-1α and FLI photons showed a good correlation (r = 0.769, P = 0.003). CEUS: Contrast-enhanced ultrasound; FLI: Fluorescence imaging; MVD: Microvessel density.
CEUS was used to assess angiogenesis. Based on the perfusion characteristics and references to previous studies,[15,16] three enhancement patterns were defined as follows. Type I refers to homogeneous concentric enhancement. Type II refers to heterogeneous enhancement where hypoechoic enhancement areas are scattered in hyperechoic enhancement areas. Type III refers to rim-like enhancement where hypoechoic enhancement areas are in the center of the tumor surrounded by hyperechoic enhancement. On days 4 and 9, all tumor enhancement patterns manifested as type I. On day 15, type II was the main enhancement pattern, and on day 19, all tumor enhancement patterns manifested as type III [Figure 4C]. Peak intensity increased up to day 15 and then decreased over time. The average CEUS peak intensities were 55.60 ± 2.43, 68.80 ± 7.20, 70.57 ± 5.51, and 55.7 ± 6.81 on days 4, 9, 15 and 19, respectively (P = 0.020) [Figure 5B]. Non-enhanced areas contained not only necrotic tissues, but also morphologically normal tissue on the histological sections [Figure 4A]. However, CD34-positive microvessels were hardly seen in the morphologically normal tissues, indicating vascular dysfunction in these areas. Pearson correlation analysis showed a positive correlation between FLI photons and the CEUS peak intensity (r = 0.803, P = 0.005) [Figure 5C].
HIF-1α expression level and MVD
The IHC staining grade of HIF-1α first increased and then decreased along with the tumor growth (P = 0.001) [Figure 4E]. On day 15, tumors presented the highest staining grade, indicating the highest level of HIF-1α expression. The IHC results for HIF-1α supported the results of the in vivo FLI analysis (r = 0.769, P = 0.003) [Figure 5F].
Under a microscope, dense microvessels were located in the tumor margin with relatively sparse tumor cells, while in the tumor center with dense tumor cells, few microvessels were observed [Figure 4D]. The average MVD was 49.7 ± 7.5/200, 37.1 ± 2.9/200, 36.6 ± 1.7/200, and 44.1 ± 5.5/200 HPF (P = 0.040) on days 4, 9, 15, and 19, respectively [Figure 5D]. The IHC results of MVD changes did not correlate with the results of the CEUS peak intensity analysis (r = −0.430, P = 0.215) [Figure 5E].
Discussion
In this study, we experimentally verified that a murine breast allografted tumor model was reliable for dynamic imaging and quantifying both angiogenesis and HIF-1α activity by contrast enhanced ultrasound and FLI.
Our CEUS results revealed changes in tumor angiogenesis during tumor growth. CEUS has unique advantages to evaluate angiogenesis, because it provides real-time imaging with a high resolution and no ionizing radiation. The contrast agents used in CEUS are gas-filled bubbles with a diameter of about 1 to 4 μm and are retained in blood vessels.[3] With tumor growth, the CEUS peak intensity first increased and then decreased. In terms of the enhancement patterns, a transformation from homogeneous concentric enhancement to heterogeneous concentric enhancement, and then to rim-like enhancement was outlined. The changes in peak intensity and enhancement pattern indicated blood flow redistribution with tumor growth. In the early stage of tumor growth, angiogenesis occurs in the whole tumor tissue. When the tumor volume increases, angiogenesis emerges more in the periphery of the tumor than in the center with a decrease in blood perfusion. It has been reported that a rim-like enhancement pattern is suggestive of malignancy in human breast lesions, whereas the other patterns, such as homogeneous, regional, and heterogeneous enhancements, have not shown diagnostic significance.[17] These findings were corroborated by IHC of MVD, in which the non-angiogenic area and necrotic area were observed in the tumor center. The distribution of microvessels was dense in the margin and sparse in the center according to CD34 IHC, which have been confirmed in previous studies.[18,19] These findings imply that the high angiogenesis and perfusion appearing in the tumor margin are distinct characteristics that differentiate tumors from benign lesions.
However, the MVD was not in accordance with the CEUS peak intensity. The results in many other animal studies also have the same inconsistency.[15,20–22] MVD assessment is a morphological method to evaluate angiogenesis, whereas CEUS is more of a functional evaluation method. There are several MVD markers such as CD31, CD34, CD105, and von Willebrand factor. Different markers may lead to different results. The Weidner method is known as a “hot spot” method to determine MVD. The distribution of MVD in a tumor is highly heterogeneous. In addition, the heterogeneity is more severe in animal experiments, because the tumor cells are mostly highly malignant and the tumor grows far more faster than in humans.[22–24] All of the above reasons may have led to the inconsistency.
Changes in HIF-1α activity were revealed by the FLI analyses with photons increasing first and then decreasing during tumor growth, which were correlated with angiogenic changes. These changes indicate that HIF-1α activity increases in an early phase of tumor formation and decreases in the late phase of tumor development. Our results are consistent with the findings of Lehmann et al, in which a colon cancer model transfected with a fluorescence reporter gene exhibited the same trend of changing HIF-1α activity.[9] Under chronically hypoxic conditions in vitro, there is a feedback mechanism of HIF-1α down-regulation,[25] which may explain these changes. The finding was corroborated by IHC of HIF-1α, verifying that FLI is a suitable method to monitor HIF-1α transcriptional activity.
There are some similar breast cancer models in previous studies. For example, the human MDA-MB231 cell line transfected with luciferase or GFP genes has been used for bioluminescence imaging or FLI.[26,27] Compared with these xenografted models, the advantages our model are as follows. Ca761 is a highly malignant tumor with negative estrogen and progesterone receptor expression. The cell doubling time is 25.98 h. It is easy to obtain a large number of cells for experiments. When injected into 615 mice, Ca761 cells spontaneously produce highly metastatic tumors that can metastasize to the lung, while the primary tumor grows in situ. Ca761 cells are a murine breast cancer cell line. The model established in this study is a murine allografted tumor. The 615 mouse has a normal immune system. Therefore, the tumor growth and angiogenesis are more consistent with in vivo conditions. A disadvantage of our model is that the mouse tissue autofluorescence is mostly located in the green spectrum of light and partly overlaps with the tumor fluorescence. The background fluorescence can be reduced through software in the imaging system, but cannot be eliminated completely.
This study has several limitations as follows. First, the model is used for optical imaging. Detecting depth of FLI is limited because of the light penetration. Therefore, the imaging system can only be used in small animal experiments and pre-clinical trials. Second, because of the limited conditions, only four-time points were adopted for the experiments. In future experiments, additional time points may provide more detailed information during breast cancer growth.
In conclusion, this study presents a real-time longitudinal imaging model for in vivo evaluation of breast cancer using both molecular and pre-clinical non-invasive imaging modalities, which can dynamically assess the activity of HIF-1α and angiogenesis. The results show that angiogenesis in breast cancer varies with HIF-1α activity. This Ca761-hre-gfp murine allografted model may be useful to study angiogenesis in breast cancer and screen for anti-HIF pathway drugs.
Acknowledgement
The authors are grateful to Prof. Martin Brown & Thomas Foster for kindly providing the 5HRE/GFP plasmid (Addgene # 46926).
Funding
This work was supported by a grant from the Doctoral Program of Higher Education of China (No. 20121106130002).
Conflicts of interest
None.
Footnotes
How to cite this article: Tang HW, Feng HL, Wang M, Zhu QL, Liu YQ, Jiang YX. In vivo longitudinal and multimodal imaging of hypoxia-inducible factor 1α and angiogenesis in breast cancer. Chin Med J 2020;133:205–211. doi: 10.1097/CM9.0000000000000616
References
- 1.Schneider BP, Miller KD. Angiogenesis of breast cancer. J Clin Oncol 2005; 23:1782–1790. doi: 10.1200/JCO.2005.12.017. [DOI] [PubMed] [Google Scholar]
- 2.Folkman J. Angiogenesis. Annu Rev Med 2006; 57:1–18. doi: 10.1146/annurev.med.57.121304.131306. [DOI] [PubMed] [Google Scholar]
- 3.Deshpande N, Pysz MA, Willmann JK. Molecular ultrasound assessment of tumor angiogenesis. Angiogenesis 2010; 13:175–188. doi: 10.1007/s10456-010-9175-z. [DOI] [PMC free article] [PubMed] [Google Scholar]
- 4.Soni S, Padwad YS. HIF-1 in cancer therapy: two decade long story of a transcription factor. Acta Oncol 2017; 56:503–515. doi: 10.1080/0284186X.2017.1301680. [DOI] [PubMed] [Google Scholar]
- 5.Wang GL, Jiang BH, Rue EA, Semenza GL. Hypoxia-inducible factor-1 is a basic-helix-loop-helix-pas heterodimer regulated by cellular O-2 tension. Proc Natl Acad Sci U S A 1995; 92:5510–5514. doi: 10.1073/pnas.92.12.5510. [DOI] [PMC free article] [PubMed] [Google Scholar]
- 6.Gilkes DM, Semenza GL. Role of hypoxia-inducible factors in breast cancer metastasis. Future Oncol 2013; 9:1623–1636. doi: 10.2217/fon.13.92. [DOI] [PMC free article] [PubMed] [Google Scholar]
- 7.Balamurugan K. HIF-1 at the crossroads of hypoxia, inflammation, and cancer. Int J Cancer 2016; 138:1058–1066. doi: 10.1002/ijc.29519. [DOI] [PMC free article] [PubMed] [Google Scholar]
- 8.Hoyt K, Umphrey H, Lockhart M, Robbin M, Forero-Torres A. Ultrasound imaging of breast tumor perfusion and neovascular morphology. Ultrasound Med Biol 2015; 41:2292–2302. doi: 10.1016/j.ultrasmedbio.2015.04.016. [DOI] [PMC free article] [PubMed] [Google Scholar]
- 9.Lehmann S, Stiehl DP, Honer M, Dominietto M, Keist R, Kotevic I, et al. Longitudinal and multimodal in vivo imaging of tumor hypoxia and its downstream molecular events. Proc Natl Acad Sci U S A 2009; 106:14004–14009. doi: 10.1073/pnas.0901194106. [DOI] [PMC free article] [PubMed] [Google Scholar]
- 10.Kagadis GC, Loudos G, Katsanos K, Langer SG, Nikiforidis GC. In vivo small animal imaging: current status and future prospects. Med Phys 2010; 37:6421–6442. doi: 10.1118/1.3515456. [DOI] [PubMed] [Google Scholar]
- 11.Caysa H, Hoffmann S, Luetzkendorf J, Mueller LP, Unverzagt S, Mader K, et al. Monitoring of xenograft tumor growth and response to chemotherapy by non-invasive in vivo multispectral fluorescence imaging. PloS One 2012; 7:e47927.doi: 10.1371/journal.pone.0047927. [DOI] [PMC free article] [PubMed] [Google Scholar]
- 12.Feng HL, Liu YQ, Gu B, Bian XC, Yang ZL, Yang LJ. Establishment of green-fluorescent protein expressing tumor metastasis models (in Chinese). Chin J Pathol 2009; 38:110–116. doi: 10.3760/cma.j.issn.0529-5807.2009.02.010. [PubMed] [Google Scholar]
- 13.Vordermark D, Shibata T, Brown JM. Green fluorescent protein is a suitable reporter of tumor hypoxia despite an oxygen requirement for chromophore formation. Neoplasia (New York, NY) 2001; 3:527–534. doi: 10.1038/sj/neo/7900192. [DOI] [PMC free article] [PubMed] [Google Scholar]
- 14.Weidner N, Carroll PR, Flax J, Blumenfeld W, Folkman J. Tumor angiogenesis correlates with metastasis in invasive prostate carcinoma. Am J Pathol 1993; 143:401–409. doi: 10.1007/BF02915112. [PMC free article] [PubMed] [Google Scholar]
- 15.Ming W, Hailiang F, He L, Yuxin J, Yuqin L, Qingli Z, et al. Correlation of contrast-enhanced ultrasound with expression of hypoxia inducible factor-1α in transplanted mice mammary cancer (in Chinese). Acta Acad Med Sin 2015; 37:6.doi: 10.3881/j.issn.1000-503X.2015.06.005. [DOI] [PubMed] [Google Scholar]
- 16.Wang ZG, Li XS, Li XL, Yuan QY, Ren JL, Ran HT, et al. Therapeutic angiogenesis induced by hepatocyte growth factor directed by ultrasound-targeted microbubble destruction (in Chinese). Acta Acad Med Sin 2008; 30:5–9. doi: 10.3901/JME.2008.11.283. [PubMed] [Google Scholar]
- 17.Liu H, Jiang YX, Liu JB, Zhu QL, Sun Q. Evaluation of breast lesions with contrast-enhanced ultrasound using the microvascular imaging technique: initial observations. Breast 2008; 17:532–539. doi: 10.1016/j.breast.2008.04.004. [DOI] [PubMed] [Google Scholar]
- 18.Sharma S, Sharma MC, Sarkar C. Morphology of angiogenesis in human cancer: a conceptual overview, histoprognostic perspective and significance of neoangiogenesis. Histopathology 2005; 46:481–489. doi: 10.1111/j.1365-2559.2005.02142.x. [DOI] [PubMed] [Google Scholar]
- 19.Miller JC, Pien HH, Sahani D, Sorensen AG, Thrall JH. Imaging angiogenesis: applications and potential for drug development. J Natl Cancer Inst 2005; 97:172–187. doi: 10.1093/jnci/dji023. [DOI] [PubMed] [Google Scholar]
- 20.Eisenbrey JR, Merton DA, Marshall A, Liu JB, Fox TB, Sridharan A, et al. Comparison of photoacoustically derived hemoglobin and oxygenation measurements with contrast-enhanced ultrasound estimated vascularity and immunohistochemical staining in a breast cancer model. Ultrason Imaging 2015; 37:42–52. doi: 10.1177/0161734614527435. [DOI] [PubMed] [Google Scholar]
- 21.Eisenbrey JR, Wilson CC, Ro RJ, Fox TB, Liu JB, Chiou SY, et al. Correlation of ultrasound contrast agent derived blood flow parameters with immunohistochemical angiogenesis markers in murine xenograft tumor models. Ultrasonics 2013; 53:1384–1391. doi: 10.1016/j.ultras.2013.04.007. [DOI] [PMC free article] [PubMed] [Google Scholar]
- 22.Zhuo J, Fu W, Liu S. Correlation of contrast-enhanced ultrasound with two distinct types of blood vessels for the assessment of angiogenesis in lewis lung carcinoma. Ultraschall Med 2014; 35:468–472. doi: 10.1055/s-0033-1356194. [DOI] [PubMed] [Google Scholar]
- 23.Wang L, Lv K, Chang XY, Xia Y, Yang ZY, Jiang YX, et al. Contrast-enhanced ultrasound study of primary hepatic angiosarcoma: a pitfall of non-enhancement. Eur J Radiol 2012; 81:2054–2059. doi: 10.1016/j.ejrad.2011.06.026. [DOI] [PubMed] [Google Scholar]
- 24.Miyata Y, Sakai H. Reconsideration of the clinical and histopathological significance of angiogenesis in prostate cancer: usefulness and limitations of microvessel density measurement. Int J Urol 2015; 22:806–815. doi: 10.1111/iju.12840. [DOI] [PubMed] [Google Scholar]
- 25.Stiehl DP, Wirthner R, Koditz J, Spielmann P, Camenisch G, Wenger RH. Increased prolyl 4-hydroxylase domain proteins compensate for decreased oxygen levels. Evidence for an autoregulatory oxygen-sensing system. J Biol Chem 2006; 281:23482–23491. doi: 10.1074/jbc.M601719200. [DOI] [PubMed] [Google Scholar]
- 26.Saha D, Dunn H, Zhou H, Harada H, Hiraoka M, Mason RP, et al. In vivo bioluminescence imaging of tumor hypoxia dynamics of breast cancer brain metastasis in a mouse model. J Vis Exp 2011; 56:e3175–e13175. doi: 10.3791/3175. [DOI] [PMC free article] [PubMed] [Google Scholar]
- 27.Wang K, Xie S, Ren Y, Xia H, Zhang X, He J. Establishment of a bioluminescent MDA-MB-231 cell line for human triple-negative breast cancer research. Oncol Rep 2012; 27:1981–1989. doi: 10.3892/or.2012.1742. [DOI] [PubMed] [Google Scholar]