Abstract
Non-coding genetic variation is a major driver of phenotypic diversity, but functional interpretation is challenging. To better understand common genetic variation associated with brain diseases, we defined non-coding regulatory regions for major cell types of the human brain. Whereas psychiatric disorders were primarily associated with variants in transcriptional enhancers and promoters in neurons, sporadic Alzheimer’s disease (AD) variants were largely confined to microglia enhancers. Interactome maps connecting disease-risk variants in cell type-specific enhancers to promoters revealed an extended microglia gene network in AD. Deletion of a microglia-specific enhancer harboring AD-risk variants ablated BIN1 expression in microglia but not in neurons or astrocytes. These findings revise and expand the genes likely to be influenced by non-coding variants in AD and suggest the probable cell types in which they function.
One Sentence Summary:
Identification of cell type-specific regulatory elements in the human brain enables interpretation of non-coding GWAS risk variants.
The central nervous system is a complex organ consisting of diverse and highly interconnected cells. Single cell sequencing technologies have advanced our understanding of the molecular phenotypes of human neurons, microglia, astrocytes, oligodendrocytes and other cell types that reside within the brain (1-3), but the transcriptional mechanisms that control their developmental and functional properties in health and disease remain less well understood. Genome-wide association studies (GWASs) provide a genetic approach to identify molecular pathways involved in complex traits and diseases by defining associations between genetic variants and phenotypes of interest (4, 5). Large-scale GWASs have discovered hundreds of single nucleotide polymorphisms (SNPs) associated with the risk of neurological and psychiatric disorders. The vast majority of these disease-risk genetic variants are located in non-coding regions of the genome (5). The causal variants and the specific cell type(s) in which the disease-risk variants may be active is often unclear. GWAS-identified risk variants in non-coding regions of the genome can exert phenotypic effects through perturbation of transcriptional gene promoters and enhancers (4). Enhancers are short regions of DNA that bind transcription factors to enhance mRNA expression from target promoters. Clusters of multiple enhancers, referred to as super enhancers, are particularly important in driving the expression of cell identity genes (6). Unique enhancer repertoires underly particular patterns of gene expression and enable cell type-specific responses (7). The activity of enhancers depends on three-dimensional enhancer-promoter interactions (8), however, the enhancer-promoter interactome of different brain cell types in vivo remain largely unknown.
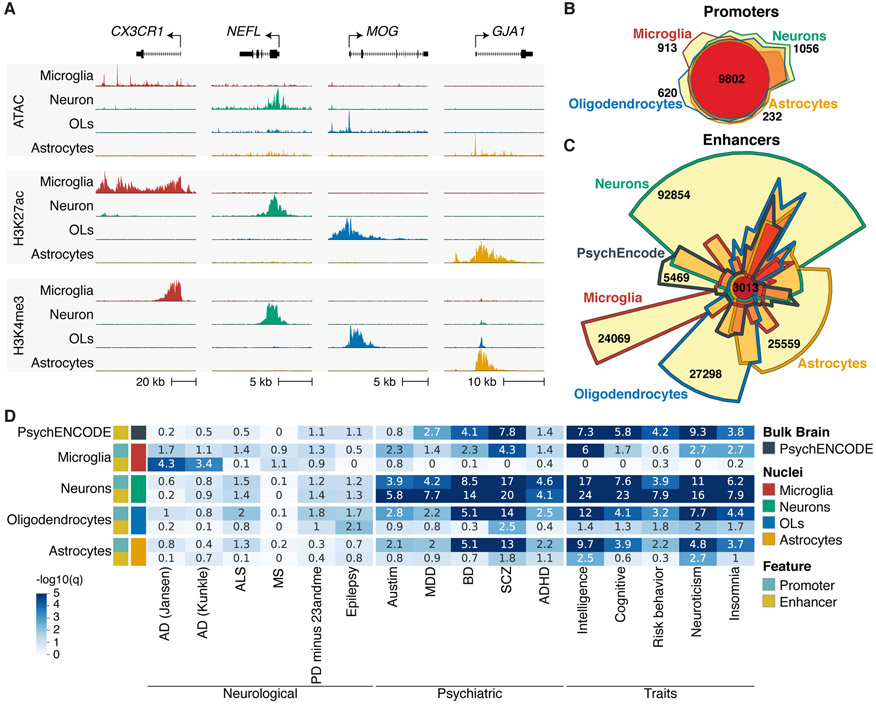
To characterize transcriptional regulatory elements within different cell types of the human brain, PU.1+ microglia, NEUN+ neuronal, OLIG2+ oligodendrocyte and NEUNneg LHX2+ nuclei were isolated from resected cortical brain tissue from 6 individuals by fluorescent activated nuclei sorting (fig. S1A-B; Table S1). Cell type-specific populations of 200k nuclei were subjected to ATAC-seq, which identifies open regions of chromatin (9); and cell type-specific populations of 500k nuclei were subjected to H3K27ac and H3K4me3 ChIP-seq, which predominantly identify active chromatin regions and promoters, respectively (10, 11). These datasets clustered according to cell type of origin and exhibited cell type-specific patterns (Figs. 1A; S1C-E). Promoter H3K27ac signal correlated with gene expression of the corresponding cell type more closely than ATAC-seq and H3K4me3 ChIP-seq (fig. S1F) (12). Promoters associated with cell type signature genes preferentially exhibited corresponding H3K27ac profiles (fig. S1G) (13). Oligodendrocyte nuclei contain a low number of oligodendrocyte precursor cells, while neuronal nuclei represent a mixture of excitatory and inhibitory subtypes (fig. S1G). ATAC-seq and H3K27ac ChIP-seq profiles generated from PU.1 nuclei were highly correlated with those previously defined in ex vivo microglia (fig. S1C, D) (14). Promoter H3K27ac signal was increased at microglia signature genes compared to genes associated with other myeloid populations (fig. S1H) (15). Cell type-specific promoter activity defined by differential H3K27ac mirrored cell type patterns of gene expression (12), as well as ATAC-seq and H3K4me3 enrichment, and were associated with gene ontologies representative of each cell type (fig. S2A-D; Table S2).
Fig. 1.
Cell type-specific genomic regulatory region enrichments for GWAS-risk variants for brain disorders and behavioral traits. (A) UCSC browser of ATAC-seq (top panel), H3K4me3 (middle panel) and H3K27ac ChIP-seq (bottom panel) for brain nuclei populations. Shown is a representative gene for microglia (CX3CR1), neurons (NEFL), oligodendrocytes (MOG) and astrocytes (GJA1). (B) Chow-Ruskey plot of promoter regions defined for cell populations. (C) Chow-Ruskey plot of enhancer regions defined for cell populations and PsychENCODE enhancers defined using bulk brain. (D) Heatmap of LDSC analysis for genetic variants associated with brain disorders and behavior traits displayed as −log10(q) value for significance of enrichment for promoter and enhancer regions of cell populations and PsychENCODE bulk brain enhancers. OL, oligodendrocytes.
We identified putative active promoters and enhancers in each cell type and found a one-to many relationship between promoters and enhancers (8). Whereas active promoters are largely shared between cell types (Fig. 1B), a relatively small fraction of active enhancers overlap between cell types (Fig. 1C), indicating that cell type specificity is mainly captured within the enhancer repertoire. Most bulk brain enhancer regions identified by PsychENCODE overlapped with the nuclei cell type enhancers (94%) (13). However, analysis of cell-specific nuclei expanded the total number of putative brain enhancers by 87%.
To determine the enrichment of genetic variants associated with complex traits and diseases in cell type-specific regulatory regions, we performed linkage disequilibrium score (LDSC) regression analysis of heritability (16). LDSC utilizes GWAS summary statistics to determine whether genetic heritability for a trait or disease is enriched for SNPs within genome annotations while accounting for linkage disequilibrium. We obtained GWAS summary statistics for neurological and psychiatric disorders and neurobehavior traits (17) (Table S3). We found a strong enrichment of heritability for variants within neuronal enhancers and promoters for all psychiatric disorders and behavioral traits (Fig. 1D), which was substantially lower in PsychENCODE bulk brain enhancers (Fig. 1D) (13). In contrast, AD SNP heritability was most highly enriched in microglia regulatory elements (Fig. 1D), specifically microglia enhancers (18-23).
De novo motif analyses at open chromatin within enhancers identified transcription factor binding motifs associated with each cell type (fig. S3). In addition, H3K27ac-defined active promoters identified 288 human transcription factors that were active in a cell type-specific manner (fig. S4, Table S2) (24), several of which have been associated with disease (fig. S5; Table S4). Integrating cell type-specific transcription factors with enhancer motifs of the corresponding cell type identifies major drivers of cell ontogeny.
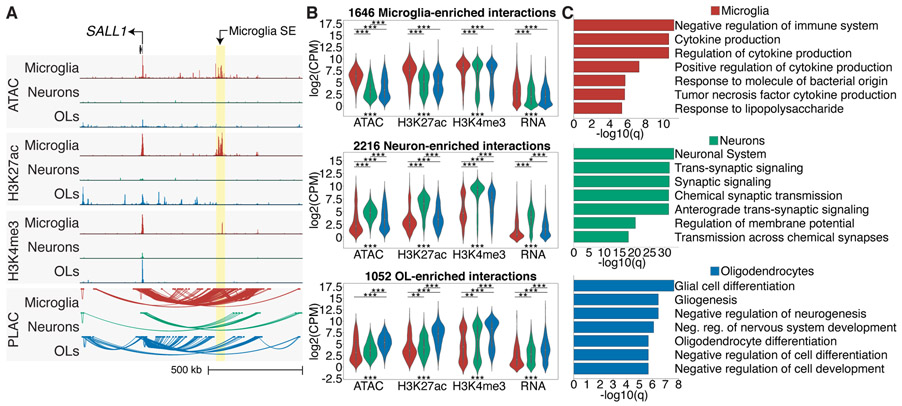
The relationship between promoters and distal regulatory regions for different cell types in the brain is largely unknown. We utilized proximity ligation-assisted ChIP-seq (PLAC-seq) in which proximity ligation preceded an enrichment for active promoters by H3K4me3 ChIP-seq (25). Chromatin loops were identified between active promoters and distal regulatory regions in microglia, neurons and oligodendrocytes (26). An example is the SALL1 locus, which has interactions to cell type-specific enhancers, including chromatin loops to a microglia-specific super-enhancer (Fig. 2A). There were 219,509 significant unique interactions across cell types, and replicates clustered according to origin (fig. S6A, B; Table S5). A strong H3K4me3 signal did not dictate that an interaction will occur (fig. S6C), suggesting that PLAC-seq captures a unique dimension of the chromatin conformation.
Fig. 2.
Chromatin loops link promoters to active gene regulatory regions. (A) UCSC browser of ATAC-seq, and H3K27ac and H3K4me3 ChIP-seq, and PLAC-seq loops at the SALL1 locus. The microglia-specific super-enhancer is associated with microglia interactions (highlighted yellow). (B) Violin plots of ATAC-seq, H3K27ac, H3K4me3 ChIP-seq and RNA-seq log2(CPM) values at PLAC-seq upregulated interactions shown in fig. S7B for microglia, neurons and oligodendrocytes; *** = P < 1e-12; ** = P < 1e-5; * = P < 1e-3. Kruskal-Wallis-between group test. (C) Metascape enrichment analyses of active genes identified at PLAC-seq upregulated interactions shown in fig. S6D for microglia, neurons and oligodendrocytes shown as −log10(q) values.
A subset of chromatin interactions was significantly more active in each cell type and colocalized with increased ATAC-seq, H3K27ac and H3K4me3 ChIP-seq signal in a cell type-specific manner (Figs. 2B; S6D). Active promoters linked to microglia, neuronal and oligodendrocyte enriched interactions were associated with gene ontology terms representative of each cell type, supporting the ability of the PLAC interactome to annotate cell type-specific promoter-enhancer interactions (Fig. 2C).
We identified 2,954 super-enhancers in microglia, neurons and oligodendrocytes, of which 83% had PLAC-interactions and were linked to promoters with elevated H3K27ac levels compared to promoters linked to regular enhancers (fig. S7A, B). Many super-enhancers harbored GWAS disease-risk variants and were connected to cell type-specific genes, suggesting that a subset of GWAS variants act on super-enhancers to affect gene expression (fig. S7A, Table S6).
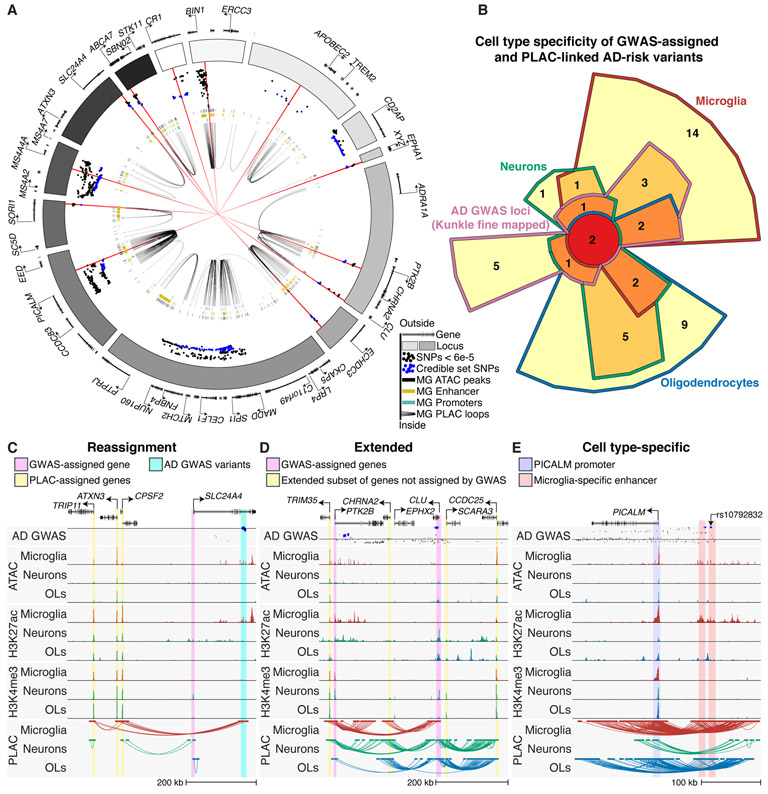
To better understand AD genetics and the microglia interactome, we distinguished likely causal variants from those in linkage disequilibrium by applying fine mapping and identified 261 credible set variants (18). In many instances, such as the BIN1, PICALM, and SORL1 loci, the fine mapped variants overlapped with microglia-specific enhancers that were PLAC-linked to corresponding gene promoters (Fig. 3A). Next, we determined PLAC-interactions between active promoters and AD-risk credible set variants (19) and identified forty-one genes that were linked to these variants across cell types (fig. S8). Twenty-five of the PLAC-linked AD-risk genes were identified in microglia, of which 14 were not detected in the other cell types (Figs. 3B; S8). A broader set of 134 putative risk genes were identified by applying the same analysis to all genome-wide significant variants found in two AD GWASs (fig. S8, S9A, B and Table S7) (18, 19).
Fig. 3.
Expanded gene network of AD-risk loci. (A) Circos plot of AD GWAS loci, showing microglia enhancers (gold bars), promoters (turquoise), open chromatin regions (black bars) and PLAC-seq interactions (black loops). Dots show z-score values of high-confidence AD variants identified by fine mapping (Kunkle, stage 1) with log10 p-value < 6e-5 (18). Blue dots represent z-score values of the credible set of AD SNPs (95% confidence); red lines show 15 high-confidence AD SNPs with a posterior probability > 0.2. (B) Chow-Ruskey plot of genes that are GWAS-assigned and PLAC-seq linked to AD-risk credible set variants in microglia, neurons and oligodendrocytes. (C)-(E) UCSC browser of interactions at AD-risk loci demonstrating (C) reassignment of GWAS-assigned genes, (D) extension of GWAS-assigned genes and (E) cell type-specific gene regulatory regions. The AD GWAS track shows meta-analysis p-values of stage 2 variants (18); line indicates p-value = 5e-8; blue dots are fine mapped 95% credible set variants.
Protein-protein interaction (PPI) network analysis showed that microglia AD-risk genes identified by PLAC-seq were highly connected with GWAS-assigned genes and centered around APOE, whereas PPI networks for neurons and oligodendrocytes were smaller in scope (fig. S9C-E). Microglia AD-assigned genes were associated with gene ontology terms for immune function, whereas gene ontology terms for amyloid-beta processing were associated with neurons, microglia and oligodendrocytes (fig. S9F).
PLAC-interactions altered interpretation of AD-risk variants according to three features. First, we found AD-risk variants that were linked to more distal active promoters and not the closest gene promoter. An example is the SLC24A4 locus, which has AD-risk variants that were connected to the proximal active promoters of ATXN3, TRIP11 and CPSF2, but not to SLC24A4 (Fig. 3C). Second, we observed enhancers harboring AD-risk variants that were PLAC-linked to active promoters of both GWAS-assigned genes and an extended subset of genes not assigned to GWAS loci. An example is the CLU locus, which has PLAC-linked AD-risk variants to the GWAS-assigned genes CLU and PTK2B, and an extended set of genes TRIM35, CHRNA2, SCARA3 and CCDC25 (Fig. 3D). Last, we identified cell type-specific enhancers harboring AD-risk variants that were linked to genes expressed in multiple cell types, implicating cell type-specific disease susceptibility. Examples are the PICALM and BIN1 loci, which, despite being expressed in multiple cell types (12), have microglia-specific enhancers harboring AD-risk variants (Fig. 3E, 4A).
Fig. 4.
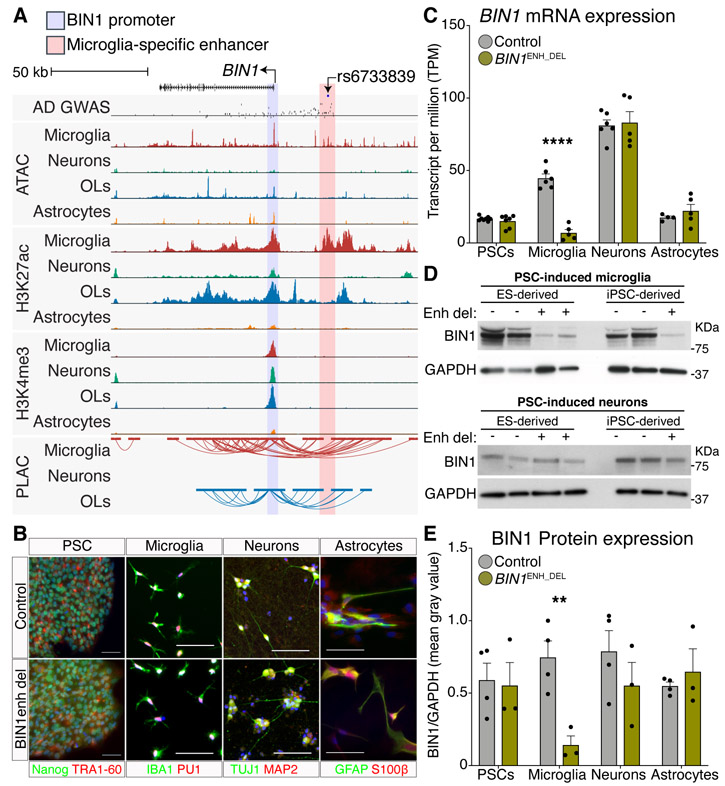
Deletion of a microglia-specific enhancer harboring a lead AD-risk variant affects microglia BIN1 expression. (A) UCSC browser of the BIN1 locus showing AD-risk variants, ATAC-seq, H3K27ac, H3K4me3 ChIP-seq and PLAC-seq in brain cell types. Shared active promoter region, highlighted pink; microglia-specific enhancer region, highlighted in yellow. The AD GWAS track shows meta-analysis p-values of stage 2 variants (18); line indicates p-value = 5e-8; blue dots are fine mapped 95% credible set variants. (B) Immunohistochemistry of PSCs, microglia, neurons and astrocytes in control and BIN1enh_del lines stained for the indicated cell lineage markers. (C) BIN1 gene expression in control and BIN1enh_del PSCs (N = 8,7), microglia (N = 6,5), neurons (N = 6,5) and astrocytes (N = 4,5) as RNA-seq TPM. **** Benjamini and Hochberg adjusted p-value < 0.0001. (D) Western blot of BIN1 and GAPDH in control and BIN1enh_del PSC-derived microglia (top) and neurons (bottom). (E) Protein expression of BIN1 in control and BIN1enh_del PSCs, microglia, neurons and astrocytes determined as Western blot BIN1/GAPDH mean gray intensity. N = 4 controls, 3 BIN1enh_del per cell type. ** unpaired two-tailed t-test p-value < 0.01.
The BIN1 microglia-specific enhancer is PLAC-linked to the BIN1 promoter (Fig. 4A), binds to PU.1 (14) and contains the AD-risk variant rs6733839, which has the second highest AD-risk score after APOE and was fine-mapped as a casual variant (Fig. 3A). Functionality of this microglia-specific enhancer was validated by CRISPR/Cas9-mediated deletion of a 363 bp region in two human pluripotent stem cell (PSC) lines (fig. S10A-C). PSC control (BIN1control) and BIN1 enhancer deletion (BIN1enh_del) lines had normal karyotypes (fig. S10D) and were differentiated into microglia, neurons and astrocytes (Figs. 4B, S11A-D, S12A, B). Gene expression analysis of BIN1control and BIN1enh_del lines in PSC and PSC-derived microglia, neurons and astrocytes showed high correlation between samples, with clustering according to cell type (fig. S12C, D). However, gene expression of BIN1 was nearly absent in the BIN1enh_del PSC-derived microglia, whereas BIN1 expression in BIN1enh_del PSCs and PSC-derived neurons and astrocytes were equivalent to BIN1control cells (Figs. 4C; S12E; Table S8). Western blot confirmed BIN1 protein in BIN1control PSCs and PSC-derived microglia, neurons and astrocytes (Figs. 4D, E; S12F). BIN1 expression was unchanged in BIN1enh_del PSC-derived microglia precursor hematopoietic stem cells, indicating that microglia derivation was unaffected (fig S12F). However, BIN1 was dramatically reduced in BIN1enh_del microglia and not neurons and astrocytes (Fig. 4D, E). This finding that the most significant GWAS risk allele associated with BIN1 resides in a microglia-specific enhancer provides a rational for further investigation of its function in these cells (27).
The present studies provide evidence that identification of cell type-specific promoter-enhancer interactomes enables substantial advances in interpretation of GWAS risk alleles associated with neurological and psychiatric diseases and establish a new resource for this purpose. Major goals will be to extend these approaches to diseased tissues and refine nuclear sorting protocols to interrogate enhancer landscapes of informative cell subsets, such as amyloid plaque-associated microglia (28). Disease-specific regulatory elements are likely to be influenced by genetic variation, which due to our limited sample size may partly explain the lack of overlap of a subset of risk alleles with the current regulatory atlases. The acquisition of more samples will provide further opportunity to evaluate inter-individual variation on enhancer selection and function. We expect that these approaches will provide qualitatively new insights into disease mechanisms that may be of value in developing new approaches for prevention and treatment.
Supplementary Material
Acknowledgments
We thank J. Collier, L. Van Ael, D. Skola and M. L. Gage and M. Gymrek.
Funding: Support was provided by NIH grants R01 NS096170, RF1 AG061060-01, R01 AG056511-01A1, R01 AG057706-01, a Cure Alzheimer’s Fund Gifford Neuroinflammation Consortium, and UCSD Shiley-Marcos ADRC 1P30AG062429. A.N. was supported by the Alzheimer’s Association (AARF-18-531498) and the Altman Clinical & Translational Research Institute at UCSD (National Center for Advancing Translational Sciences, NIH KL2TR001444). I.R.H. was supported by the VENI research program, which is financed by the Netherlands Organization for Scientific Research. N.G.C. was funded by NIH K08 NS109200-01 and The Hartwell Foundation. C.Z.H. is supported by the Cancer Research Institute Irvington Postdoctoral Fellowship Program. C.O. was funded by NIHNCI CCSG: P30 014195 and S10-OD023689. Salk facilities are supported by the Salk Cancer Center (NCI grant: P30-CA014195). F.H.G. was supported by the JPB Foundation, The Engman Foundation, The AHA/ Allen Award, and the Dolby Foundation. J.B.B. and R.A.S. were supported by AG062429-01.
Footnotes
Competing interests: B.R. is co-founder of Arima Genomics, Inc, which sells Hi-C and PLAC-seq kits.
Data and materials availability: Data available on dbGap (accession number: phs001373.v2.p1). UCSC browser session: https://genome.ucsc.edu/s/nottalexi/glassLab_BrainCellTypes_hg19.
References
- 1.Lake BB et al. , Neuronal subtypes and diversity revealed by single-nucleus RNA sequencing of the human brain. Science (New York, NY) 352, 1586–1590 (2016). [DOI] [PMC free article] [PubMed] [Google Scholar]
- 2.Lake BB et al. , Integrative single-cell analysis of transcriptional and epigenetic states in the human adult brain. Nature Biotechnology 36, 70–80 (2018). [DOI] [PMC free article] [PubMed] [Google Scholar]
- 3.Mathys H et al. , Single-cell transcriptomic analysis of Alzheimer's disease. Nature 570, 332–337 (2019). [DOI] [PMC free article] [PubMed] [Google Scholar]
- 4.Gallagher MD, Chen-Plotkin AS, The Post-GWAS Era: From Association to Function. Am J Hum Genet 102, 717–730 (2018). [DOI] [PMC free article] [PubMed] [Google Scholar]
- 5.Maurano MT et al. , Systematic localization of common disease-associated variation in regulatory DNA. Science 337, 1190–1195 (2012). [DOI] [PMC free article] [PubMed] [Google Scholar]
- 6.Hnisz D et al. , Super-enhancers in the control of cell identity and disease. Cell 155, 934–947 (2013). [DOI] [PMC free article] [PubMed] [Google Scholar]
- 7.Heinz S, Romanoski CE, Benner C, Glass CK, The selection and function of cell type-specific enhancers. Nature reviews Molecular cell biology 16, 144 (2015). [DOI] [PMC free article] [PubMed] [Google Scholar]
- 8.Mumbach MR et al. , HiChIP: efficient and sensitive analysis of protein-directed genome architecture. Nature methods 13, 919 (2016). [DOI] [PMC free article] [PubMed] [Google Scholar]
- 9.Chen X et al. , ATAC-see reveals the accessible genome by transposase-mediated imaging and sequencing. Nat Methods 13, 1013–1020 (2016). [DOI] [PMC free article] [PubMed] [Google Scholar]
- 10.Creyghton MP et al. , Histone H3K27ac separates active from poised enhancers and predicts developmental state. Proceedings of the National Academy of Sciences of the United States of America 107, 21931–21936 (2010). [DOI] [PMC free article] [PubMed] [Google Scholar]
- 11.Heintzman ND et al. , Distinct and predictive chromatin signatures of transcriptional promoters and enhancers in the human genome. Nat Genet 39, 311–318 (2007). [DOI] [PubMed] [Google Scholar]
- 12.Zhang Y et al. , Purification and Characterization of Progenitor and Mature Human Astrocytes Reveals Transcriptional and Functional Differences with Mouse. Neuron 89, 37–53 (2016). [DOI] [PMC free article] [PubMed] [Google Scholar]
- 13.Wang D et al. , Comprehensive functional genomic resource and integrative model for the human brain. Science (New York, NY) 362, eaat8464 (2018). [DOI] [PMC free article] [PubMed] [Google Scholar]
- 14.Gosselin D et al. , An environment-dependent transcriptional network specifies human microglia identity. Science (New York, NY) 356, eaal3222 (2017). [DOI] [PMC free article] [PubMed] [Google Scholar]
- 15.Jordao MJC et al. , Single-cell profiling identifies myeloid cell subsets with distinct fates during neuroinflammation. Science 363, (2019). [DOI] [PubMed] [Google Scholar]
- 16.Bulik-Sullivan B et al. , An atlas of genetic correlations across human diseases and traits. Nature Genetics 47, 1236–1241 (2015). [DOI] [PMC free article] [PubMed] [Google Scholar]
- 17.S. m. a. methods.
- 18.Kunkle BW et al. , Genetic meta-analysis of diagnosed Alzheimer's disease identifies new risk loci and implicates Aβ, tau, immunity and lipid processing. Nature Genetics 51, 414–430 (2019). [DOI] [PMC free article] [PubMed] [Google Scholar]
- 19.Jansen IE et al. , Genome-wide meta-analysis identifies new loci and functional pathways influencing Alzheimer’s disease risk. Nature Genetics 51, 404–413 (2019). [DOI] [PMC free article] [PubMed] [Google Scholar]
- 20.Huang KL et al. , A common haplotype lowers PU.1 expression in myeloid cells and delays onset of Alzheimer's disease. Nat Neurosci 20, 1052–1061 (2017). [DOI] [PMC free article] [PubMed] [Google Scholar]
- 21.Novikova G et al. , Integration of Alzheimer’s disease genetics and myeloid cell genomics identifies novel causal variants, regulatory elements, genes and pathways. bioRxiv, 694281 (2019). [Google Scholar]
- 22.Tansey KE, Hill MJ, Enrichment of schizophrenia heritability in both neuronal and glia cell regulatory elements. Transl Psychiatry 8, 7 (2018). [DOI] [PMC free article] [PubMed] [Google Scholar]
- 23.Tansey KE, Cameron D, Hill MJ, Genetic risk for Alzheimer's disease is concentrated in specific macrophage and microglial transcriptional networks. Genome Med 10, 14 (2018). [DOI] [PMC free article] [PubMed] [Google Scholar]
- 24.Lambert SA et al. , The Human Transcription Factors. Cell 175, 598–599 (2018). [DOI] [PubMed] [Google Scholar]
- 25.Fang R et al. , Mapping of long-range chromatin interactions by proximity ligation-assisted ChIP-seq. Cell research 26, 1345–1348 (2016). [DOI] [PMC free article] [PubMed] [Google Scholar]
- 26.Juric I et al. , MAPS: Model-based analysis of long-range chromatin interactions from PLAC-seq and HiChIP experiments. PLoS Comput Biol 15, e1006982 (2019). [DOI] [PMC free article] [PubMed] [Google Scholar]
- 27.Crotti A et al. , BIN1 favors the spreading of Tau via extracellular vesicles. Sci Rep 9, 9477 (2019). [DOI] [PMC free article] [PubMed] [Google Scholar]
- 28.Keren-Shaul H et al. , A Unique Microglia Type Associated with Restricting Development of Alzheimer's Disease. Cell 169, 1276–1290 e1217 (2017). [DOI] [PubMed] [Google Scholar]
Associated Data
This section collects any data citations, data availability statements, or supplementary materials included in this article.


