

Abstract
Manganese hexacyanoferrate (MnHCF) is made of earth‐abundant elements by a safe and easy synthesis. The material features a higher specific capacity at a higher potential than other Prussian blue analogs. However, the effect of hydration is critical to determine the electrochemical performance as both the electrochemical behavior and the reaction dynamics are affected by interstitial/structural water and adsorbed water. In this study, the electrochemical activity of MnHCF is investigated by varying the interstitial ion content through a joint operando X‐ray absorption spectroscopy and chemometric approach, with the intent to assess the structural and electronic modifications that occur during Na release and Li insertion, as well as the overall dynamic evolution of the system. In MnHCF, both the Fe and Mn centers are electrochemically active and undergo reversible oxidation during the interstitial ion extraction (Fe2+/Fe3+ and Mn2+/Mn3+). The adsorption of water results in irreversible capacity during charge but only on the Fe site, which is suggested by our chemometric analysis. The local environment of Mn experiences a substantial yet reversible Jahn–Teller effect upon interstitial ion removal because of the formation of trivalent Mn, which is associated with a decrease of the equatorial Mn−N bond lengths by 10 %.
Keywords: electrochemistry, iron, Jahn–Teller distortion, manganese, X-ray absorption spectroscopy
Wetter not better: The effect of hydration is critical to determining the electrochemical performance of manganese hexacyanoferrate (MnHCF) as both the electrochemical behavior and the reaction dynamics are affected by interstitial/structural water and adsorbed water. The electrochemical activity of MnHCF is investigated by varying the interstitial ion content through a joint operando X‐ray absorption spectroscopy and chemometric approach.

Introduction
Affordable energy is a key factor for sustainable economic growth.1 Li‐ion batteries store electrochemical energy reversibly2, 3, 4 and are thought of as the leading chemistry for electromobility in the next decade.5 Therefore, the employment of abundant, safe, and environmentally friendly electrode materials and the avoidance of critical raw materials are of primary importance. Prussian blue analogues (PBAs) belong to the class of insertion‐type materials6, 7, 8, 9, 10, 11 characterized by a porous open‐framework of bimetallic cyanides (−Fe−CN−M−NC−, in which M denotes a transition metal, commonly, Fe, Mn, Co, Ni, Cu, Zn)12 with available insertion sites, channels, and vacancies. The cyanides within the structure bridge Fe and M ions, which in turn constitute the electroactive centers of the framework. PBAs have found employment in several applications because of their structure/activity properties.13, 14, 15 Among PBAs, manganese hexacyanoferrate is constituted only by earth‐abundant elements and displays high operational voltages and relatively high specific capacities in aprotic electrolytes.16, 17, 18 Previously,19 in‐depth analysis of ex situ X‐ray absorption spectroscopy (XAS) spectra showed that both the Fe2+/Fe3+ and Mn2+/Mn3+ redox processes were active, accompanied by strong structural modifications at the Mn site. The material showed a full electrochemical, electronic, and structural reversibility, although the large Jahn–Teller effect affects the trivalent Mn site.
In this study, we adopt manganese hexacyanoferrate (MnHCF) as the positive electrode, however, without extensive dehydration. Indeed, as a result of the porous nature of PBAs, these materials act as sponge‐like materials towards water molecules. However, the hydration degree affects the electrochemical performance sharply as substantial differences are seen in the electrochemical signature of fully8, 19 or partially (presence of interstitial water) dehydrated materials.17, 20, 21, 22 However, the effect of adsorbed water is not known.
To provide insight into the redox reaction mechanism of hydrated manganese hexacyanoferrate with the electrochemical variation of the interstitial ion content, that is, the extraction of Na ions and insertion of Li ions, and assess the hydration effect, operando XAS experiments were performed to obtain structural and electronic information, and the dynamic evolution of the system was analyzed by using the multivariate curve resolution alternating least squares (MCR‐ALS) chemometric technique. The adsorbed water contributes to an additional (and irreversible) charge capacity but does not cause appreciable differences at the Mn and Fe local environments during further cycling.
Results and Discussion
We performed thermogravimetric analysis (Figure S1) to evidence a double‐step loss of water molecules that occurs at approximately 100 °C, ascribable to adsorbed water, and 171.2 °C, associated with interstitial and structural water.8, 19, 23, 24 The quantitative analysis indicates that adsorbed and interstitial/structural water in the hydrated compound contribute to, respectively, 3.7 and 8.6 % of the total weight. We used inductively coupled plasma optical emission spectroscopy (ICP‐OES) to obtain a Na/Mn/Fe ratio of 1.9:1.1:1.0, which leads to the Na1.9Mn1.1[Fe(CN)6]⋅2.1 H2O formula unit.
The XRD pattern of MnHCF (powder) is shown in Figure 1 a. Rietveld refinement was performed by fixing the Na/Mn/Fe ratios to the values obtained by using ICP‐OES. The overall quality of the fit is good (Rwp=14.2, χ 2=9.49), and the lattice parameters and atomic positions agree well with those of the adopted structural model.8 MnHCF features a monoclinic lattice (space group P21/n, unique b axis) unlike most PBAs with a=10.562(5) Å, b=7.534(4) Å, c=7.356(4) Å, and β=92.01(4)°. Fe and Mn are located in octahedral environments. The Fe sites (2d Wyckoff site) are surrounded by six C atoms, and the Mn sites (2a) are coordinated to six N atoms, and the C and N atoms are the ends of the cyanide bridges (Figure S2). Interstitial water molecules and Na ions are located in the 4e sites.
Figure 1.
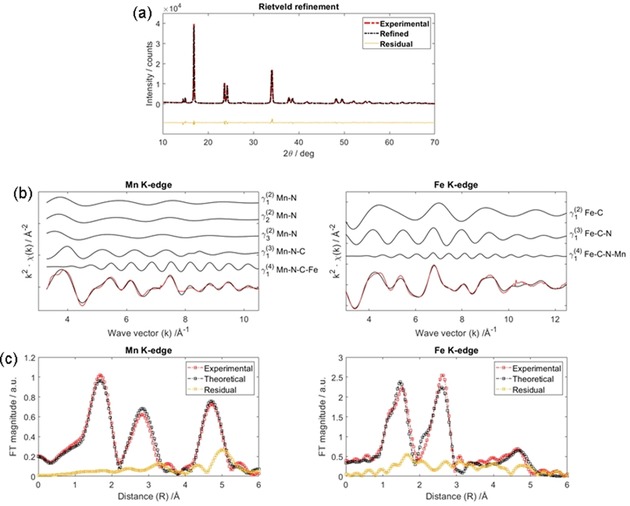
Structural characterization of the powder. a) Rietveld refinement on MnHCF powder. Best EXAFS fit results for MnHCF powder: b) MS terms and c) FTs at both Mn and Fe K‐edges. Experimental signals (red) are compared to calculated ones (black).
Extended X‐ray absorption fine structure (EXAFS) analysis of the powder allows us to set the relevant parameters for the subsequent operando EXAFS fitting analysis. All the data were analyzed by using a multiple edge approach,25 that is, a simultaneous procedure taken at both Mn and Fe metal edges. The reliability of the outcomes is good as the same structural parameters are constrained and probed by using two independent data sets. Details of the EXAFS analysis for the powder, in terms of single multiple scattering (MS) contributions (Panel b) and Fourier transforms (FTs; Panel c) of the corresponding EXAFS signals, are presented in Figure 1. The theoretical curves match well with the experimental ones, which confirms the reliability of the present approach and data analysis. As a result of the large asymmetry of the Mn site (as suggested by the XRD refinement) three different Mn−N bond lengths were included in the best fit, hence three two‐body Mn−N terms are illustrated in Figure 1 b. However, the subsequent data analysis on the operando data set was performed by using one Mn−N mean bond length only. This produces a small mismatch between the theoretical and experimental signals yet allows the substantial reduction of floating variables during the minimization. Moreover, not only the two‐body γ(2) signals, but also the three‐body γ(3) and four‐body γ(4) MS terms are relevant, which shows intensities comparable to the first‐shell contribution. The Mn−N mean bond length is 2.19(2) Å, which corresponds to a MnIIN6 octahedron.
To evaluate the evolution of electronic and structural features with the variation of the interstitial ion content, electrochemical cells were mounted and tested in operando mode. The electrochemical charge/discharge curve (Panel a) and the X‐ray absorption near edge structure (XANES) traces recorded at both the Mn and Fe K‐edges during the operando scan are presented in Figure 2. Modifications at both thresholds are appreciated, especially at the Mn edge, which suggests structural and electronic modifications upon the electrochemical reaction. Both Fe and Mn display electroactivity, that is, they are oxidized to compensate the release of Na+ ions during charge, as the thresholds shift toward higher energies, and their reduction occurs upon the uptake of Li+ ions during discharge, in concomitance of an edge shift to lower energies. This confirms the mechanism already proposed from ex situ measurements, in particular the FeIII/FeII and MnIII/MnII redox activity,16, 19, 21, 26 which is valid not only for Li+ but also for Na+ exchange. However, it adds further information on the effect of structural/interstitial/adsorbed water in the material. The full reversibility of the XANES features at the Mn K‐edge are shown in Figure 2 Panels b and d. However, the Fe K‐edge shows an irreversible modification in the first 10 spectra that correspond with the first plateau (Panel a). This observation is confirmed by a close inspection of the pre‐edge data (Figure S4). After this irreversible adjustment, however, the XANES features observed during cycling are mostly reversible but with a slight evolution. If we look at the voltage profile upon charge, three plateaus are seen instead of the two observed typically for dehydrated materials. The substantial stability of the Mn and Fe XANES features along the first plateau supports the removal of adsorbed water, which contributes to an additional, but irreversible, capacity only upon charge.
Figure 2.
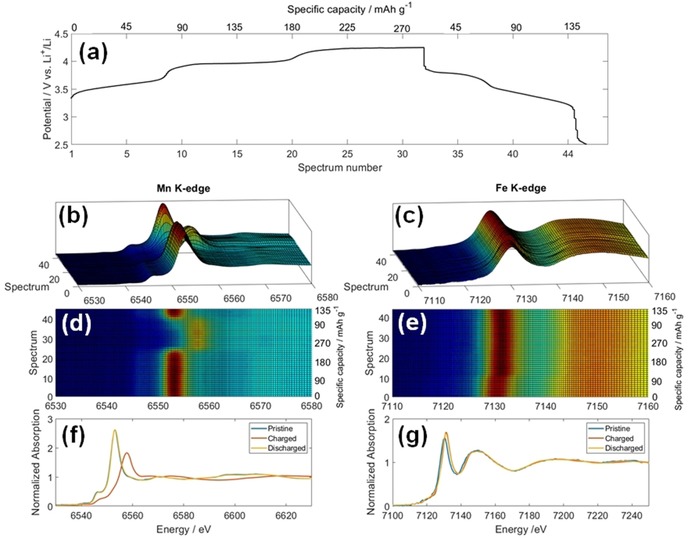
Operando XAS. a) Electrochemical curve that shows the potential profile as a function of the recorded spectra. b, c) XANES traces at the Mn and Fe K‐edges recorded during the operando scan. d, e) Top view of the (xy) plane of the XANES traces. f, g) Spectra of pristine, fully charged, and fully discharged materials at both metallic sites.
To provide insight into the reaction dynamics, a chemometric approach was used to analyze the operando XAS dataset.27 The MCR‐ALS algorithm (Experimental Section) was applied to the whole series of operando Mn and Fe K‐edge XANES spectra, and the results are reported in Figure 3. The transformation of the pristine (blue curve) into the charged species (orange curve) quantitatively occurs along the third plateau upon charge (intersection point in correspondence of spectrum 23 and peak at 4.2 V in the differential capacity plot; Figure S5). However, the transformation of the charged into the discharged species, that is, the reduction, occurs reversibly during the second plateau of the discharge (intersection point that corresponds with spectrum 39, i.e., at 3.4 V, in agreement with the differential capacity plot; Supporting Information). The reversibility of the process is evidenced by the match between the pristine and discharged species. The two pure spectral components needed to describe the Mn operando dataset differ significantly between each other, in accordance with a deep structural modification at the Mn site, as seen from the XANES traces (Figure 2). Based on the XANES behavior, the species mentioned above correspond to MnII (blue curve) and MnIII (orange curve). Unlike Mn, the number of spectral components observed for Fe is three during charge and two during the subsequent discharge. However, if we exclude the first 10 spectra, that is, we do not consider the electrochemical process that arises at 3.6 V as shown in Figure S5, Mn and Fe give similar results with regard to the crossing (isosbestic) points in the concentration profiles. This suggests strongly that the removal/degradation of adsorbed water affects the dynamic evolution of the Fe site only.
Figure 3.
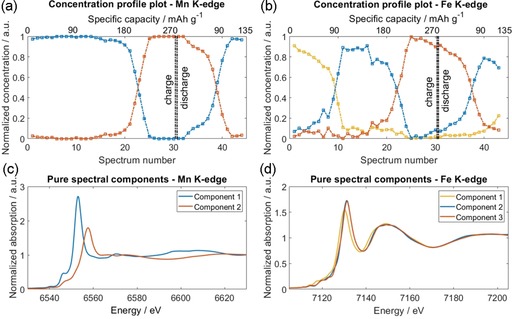
MCR‐ALS analysis of XANES spectra at both metal centers. a, b) Concentration profile plots and c, d) pure spectral components needed to describe the operando dataset are shown for both metallic sites. The double dash‐dotted line shows the charge/discharge separation.
EXAFS analysis of the operando experiment allows us to monitor the local coordination environment of Mn and Fe upon ion release (Na+) and uptake (Li+). The EXAFS experimental data were fitted initially with the structural model reported in the Experimental Section. However, this model did not hold true around the fully charged state, that is, for spectra 20–40. Preliminary tests were made by considering an asymmetric MnN6 octahedron with the four equatorial Mn−Neq bonds shorter than the axial Mn−Nax bonds to take into consideration the Jahn–Teller effect that affects MnIII.19 This new model was adopted successfully in this range to give the best fit results. Details of the EXAFS fitting analysis, conducted only on a few relevant states of charge at both Mn (upper panels) and Fe (lower panels) K‐edges, are summarized in Figure 4. Each panel contains the two‐ γ(2), three‐ γ(3), and four‐body γ(4) contributions to the total theoretical signal (black line) and a comparison to the experimental one (red line), which offers a good match in all cases. The fully oxidized sample (spectrum 30), however, presents a higher number of MS terms because of the adopted asymmetric model, which requires two sets for each γ(2), γ(3), and γ(4) term at the Mn site and two γ(4) signals at the Fe site. Notably, the four‐body contribution modulates the entire spectrum and is the most representative term for the oscillating fine structure, as expected for this class of materials.25
Figure 4.
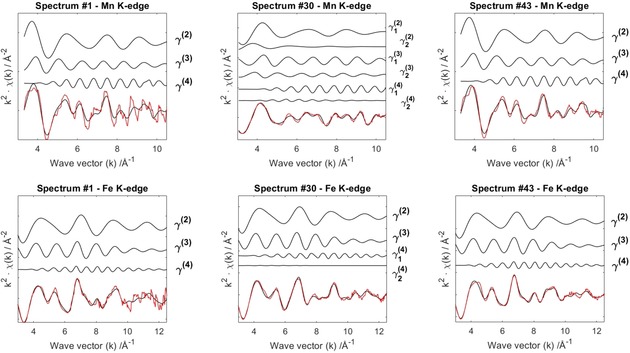
Details of the EXAFS fitting analysis. MS terms for some relevant states of charge at both Mn (upper panels) and Fe (lower panels) K‐edges. Pristine (spectrum 1), fully oxidized (spectrum 30), and fully discharged (spectrum 43). The total theoretical signals (black) are compared to the experimental ones (red).
Relevant results of the fitting procedure for a selected number of samples are presented in Table 1 shows, and the trend of the bond lengths in the different spectra (i.e., states of charge) are shown in Figure 5. The C≡N bond lengths do not vary significantly during the electrochemical process, apart from a slight decrease in the first 10 spectra. In the same time scale, the Fe−C bond length increases slightly and oscillates smoothly during ion release/uptake (see magnified area in Figure 5), which follows the trend of the second component in the MCR‐ALS analysis of Fe (Figure 3). The variation of the Fe−C≡N fragment (Fe−C+C≡N) is in line with the structural modification experienced by the Fe site upon the removal/degradation of the adsorbed water, which takes place during the first charge plateau and primarily involves the Fe site, as supported by XANES traces and MCR‐ALS analysis.
Table 1.
Relevant results of the operando EXAFS data analysis. Bond lengths and Debye–Waller factors are reported with respective errors (in brackets). Errors were determined from correlation maps (contour plots) for a pair of parameters, selected among the parameters as they have a strong correlation.
|
|
|
|
Spectrum number (Specific capacity) |
||||||||
|---|---|---|---|---|---|---|---|---|---|---|---|
|
|
|
|
Charge |
|
Discharge |
||||||
|
|
Powder |
|
02 (9 mAh g−1) |
09 (79 mAh g−1) |
12 (108 mAh g−1) |
17 (157 mAh g−1) |
25 JT distorted (236 mAh g−1) |
30 JT distorted (285 mAh g−1) |
|
35 JT distorted (46 mAh g−1) |
43 (127 mAh g−1) |
|
Fe−C(N) [Å] σ2(Fe−C) [Å2] |
1.876(2) 0.0025(6) |
|
1.865(8) 0.002(1) |
1.88(1) 0.0024(10) |
1.90(1) 0.0025(15) |
1.908(9) 0.003(1) |
1.887(3) 0.0028(4) |
1.883(3) 0.0025(6) |
|
1.890(3) 0.0026(5) |
1.892(8) 0.0036(10) |
|
C≡N [Å] σ2 (C≡N) [Å2] |
1.183(4) 0.010(2) |
|
1.184(7) 0.009(2) |
1.17(1) 0.0016(2) |
1.17(1) 0.008(4) |
1.17(1) 0.011(4) |
1.170(3) 0.003(2) |
1.173(6) 0.008(2) |
|
1.17(1) 0.009(2) |
1.171(7) 0.010(15) |
|
Mn−Neq [Å] σ2(Mn−Neq) [Å2] |
2.17(2) 0.009(2) |
|
2.19(2) 0.006(2) |
2.19(2) 0.007(3) |
2.19(1) 0.006(3) |
2.186(10) 0.007(2) |
1.970(5) 0.0074(15) |
1.978(8) 0.008(2) |
|
1.958(7) 0.010(12) |
2.18(1) 0.006(2) |
|
Mn−Nax [Å] σ2(Mn−Nax) [Å2] |
|
|
|
|
|
|
2.16(2) 0.017(3) |
2.20(3) 0.018(5) |
|
2.17(2) 0.014(4) |
|
Figure 5.
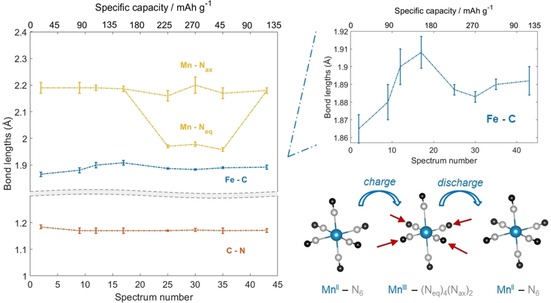
EXAFS bond lengths obtained during the operando acquisition as a function of collected spectra. The top right panel zooms in on the Fe−C distances, and the bottom right panel illustrates the Mn−Neq bond length decrease upon MnII/MnIII oxidation.
As a result of the strong Jahn–Teller (JT) effect with regard to Mn in its trivalent state, the symmetry of the MnN6 cluster, and thus the Mn−N bond length, varies to a great extent in the operando spectra taken along the last charge plateau and the second discharge plateau (i.e., spectra 20–40). As a consequence of the oxidation of MnII to MnIII, the equatorial Mn−Neq bond lengths decrease by up to 10 % (Figure 5). In fact, the equatorial Mn−Neq bonds are estimated to be roughly 1.970 Å around the fully oxidized state (spectrum 25), whereas the axial Mn−Nax distances are not affected significantly by the oxidation process and assume larger values (2.16 Å). A reversible trend is appreciated during discharge, which confirms the reduction of trivalent Mn to its divalent state. A comparison between the reported Mn−N bond lengths and those obtained through ex situ measurements19 leads us to conclude that the two data sets are equivalent within the relative error bars. This also indicates that the adsorbed water does not cause appreciable differences at the Mn and Fe sites after the very first part (first 10 spectra) of the charge process, which suggests similar overall behavior between the water‐containing and water‐free materials during the remaining cycling.
Conclusions
The degree of hydration of manganese hexacyanoferrate plays a critical role to determine its electrochemical performance. Not only the presence of interstitial/structural water but also adsorbed water affects the electrochemistry and reaction dynamics, as highlighted by using the multivariate curve resolution alternating least squares technique. The contribution of adsorbed water is identified as the additional and irreversible capacity during the charge process, which indicates that these electrode materials can only be processed under very dry conditions, which would increase the production cost substantially. Moreover, the effect of water appears to concern the Fe environment only, as suggested by using the multivariate curve resolution alternating least squares technique and further corroborated by using extended X‐ray absorption fine structure analysis. After the removal/degradation of adsorbed water, FeII and MnII are oxidized to their trivalent states during ion release, and reduction occurs during ion uptake. The formation of Jahn–Teller‐active MnIII species toward the end of the charge, that is, near full oxidation, influences the Mn site environment, which leads to a pronounced asymmetry of the MnN6 cluster and translates into a decrease of the equatorial Mn−Neq bond lengths by approximately 10 %. A reversible structural and electronic behavior is appreciated during the following discharge.
Experimental Section
Synthesis
Na‐rich manganese hexacyanoferrate (MnHCF) was synthesized through a simple and scalable coprecipitation method that involves the reaction of manganese sulfate monohydrate (MnSO4⋅H2O) and sodium ferrocyanide decahydrate (Na4[Fe(CN)6]⋅10 H2O). The reagents (from Sigma–Aldrich) were used as received without further purification. Solutions of the two reagents (0.1 L, 0.1000 m each) were added dropwise simultaneously into an aqueous solution (0.1 m, 0.1000 m) of sodium sulfate (Na2SO4; Sigma–Aldrich) by using a peristaltic pump at a rate of 3.8 mL min−1. Both the reagents and the reaction vessel were kept at a constant temperature (40±2 °C) by using a thermostatted bath. Magnetic stirring was adopted throughout the process and was stopped 2 min after the complete addition of the reagents. The obtained suspension, which contained manganese hexacyanoferrate, had a pale brown color. The solution was aged for five days to ensure complete decantation. The precipitate was collected by centrifugation at 3500 rpm for 30 min using test tubes that each contained approximately 5 mL of suspension. After the supernatant was removed, the precipitate was rinsed three times with ∼2 mL of distilled water per test tube, then ground in an agate mortar, and dried at 60 °C for 48 h.
Characterization
Thermogravimetric analysis was performed (TA Discovery TGA instrument) from 40 °C after an equilibration time of 30 min to 500 °C with a ramp of 5 °C min−1 in a N2 atmosphere. ICP‐OES was performed by using a Spectro Arcos FHS12 instrument. Samples of approximately 10 mg were dissolved in HNO3/HCl solution (3:1 volumetric ratio) by heating to 200 °C in a MARS 6 iWave microwave oven. Afterwards, the dissolved samples were diluted with water to achieve clear solutions that were thermally equilibrated at 20 °C. At least two individual solutions were prepared to check the reproducibility of the results. The XRD pattern of the pristine Na‐rich MnHCF was recorded by using a Bruker D8 Advance diffractometer equipped with a CuKα source (λ=0.15406 nm) in the 10<2 θ<70° range with a step size of 0.029745° and an acquisition time of 2 s point−1. Rietveld refinement was performed by using FullProf Suite software28 and by assuming as a structural model that reported by Song et al.8 A Thompson–Cox–Hastings pseudo‐Voigt peak shape was used. Factor scale, peak shape parameters, cell parameters, background, and atomic parameters were refined in this order. Graphical representation of structures was achieved by using VESTA software.29
Electrode preparation and electrochemical characterization
The electrode slurry was prepared by mixing 85 wt % of active material (MnHCF), 10 wt % conductive agent (Super C65, IMERYS), and 5 wt % binder (polyvinylidene difluoride, PVDF; Solef 6020, Solvay Polymerspecialties). Th binder was dissolved (10 wt % solution) in dry N‐methyl‐2‐pyrrolidone (NMP). Additional NMP was added to adjust the viscosity of the slurry. The final solid content (given by [m(solid)]/[m(solid+solvent)]) was 0.20. The slurry was homogenized by using a ball‐milling procedure that consisted of two repetitions of 1 h each with a 10 min break between stages. Then it was cast onto Al foil (thickness 20 μm, cleaned with ethanol and dried at 80 °C overnight) by using a blade coater (blade height of 200 μm) and dried at 60 °C overnight. Disk electrodes with a diameter of 12 mm were cut by using a puncher (Hohsen), weighed, and pressed at 10 tons for 10 s. The areal loading of the electrodes has a Student's t‐distribution of (2.47±0.04) mgMnHCF cm−2 by considering a population of 24 electrodes and a confidence interval of 0.95. Finally, the electrodes were not dried extensively to avoid the phase transition from the monoclinic to the rhombohedral structure.8
Cell assembly was performed in an Ar‐filled glovebox (MBRAUN MB 200B ECO) with O2 and H2O contents lower than 0.1 ppm. The MnHCF disk electrodes were used as positive electrodes in modified CR2032 coin cells, and Li metal was used as the negative electrode. GF/A Whatman paper was used as separator to avoid direct electrical contact between the electrodes. LP30, i.e., 1.0 m LiPF6 dissolved in a 1:1 volumetric mixture of ethylene carbonate and dimethyl carbonate (EC/DMC=50:50 v/v), was employed as the electrolyte for the cells. Galvanostatic cycling with potential limitation (GCPL) in constant current mode was performed by using a battery cycler (MTI 8‐channels Battery Analyzer). A nominal capacity of 152 mAh g−1 (1 C=152 mAh g−1) was assumed for the MnHCF electrodes as weighed (i.e., they contain adsorbed/interstitial water). Cycling was performed within the 2.3–4.3 V range starting from open circuit with a positive initial polarization.
In situ coin cell
Stainless‐steel CR2032 coin cell cases available commercially were drilled by using a drill bit of diameter ϕ=4 mm, and adequately polished by using an abrasive drill tip. As a consequence of the abrasion, the hole was typically widened to ≈5 mm. Subsequently, a 0.25 μm Mylar film was placed on both sides of each case with a polydimethylsiloxane (PDMS) polymer. A 10:1 mixture of PDMS and curing agent was prepared and mixed thoroughly for 10 min immediately before employment. Curing at 60 °C overnight took place to let the polymer harden.
Operando XAS data collection and analysis
XAS experiments were performed at the Elettra Sincrotrone Trieste (Italy) at the XAFS beamline.30 The storage ring operated at 2.0 GeV in top‐up mode with a typical current of 310 mA. XAS data were recorded at Mn and Fe K‐edges in transmission mode using ionization chambers filled with a mixture of Ar, N2, and He to achieve 10, 70, and 95 % of absorption in the I0, I1, and I2 chambers. Internal references for Mn and Fe (metal foils) were used for energy calibration during each scan. No energy drifts of the monochromator were observed during the experiments. Spectra at the Mn and Fe K‐edges were collected with a constant k‐step of 0.03 Å−1 with 2 s point−1 acquisition time. Data were collected alternately from 6339 to 7110 eV and from 6912 to 8346 eV around the Mn and Fe K‐edges, respectively. The energies were calibrated by assigning the first inflection point of the metallic Mn and Fe spectra to 6539 and 7112 eV, respectively. XAS data pretreatment was performed by using ATHENA graphical utility.31 EXAFS analysis was performed by using the GNXAS package,32, 33 which is based on MS theory. The method uses the decomposition of the EXAFS signals into the sum of several contributions, namely, the n‐body terms. The theoretical signal is calculated ab initio and contains the relevant two‐body γ(2), three‐body γ(3), and four‐body γ(4) MS terms.34 The two‐body terms are associated with pairs of atoms and probe their distances and variances. The three‐body terms are associated with triplets of atoms and probe angles, bond–bond, and bond–angle correlations. The four‐body terms are associated with chains of four atoms to probe distances and angles in between as well as bond–bond and bond–angle correlations. However, as Fe−C≡N−Mn chains feature angles close to 180°, the actual number of parameters used to define the γ(3) or the γ(4) peaks was reduced by symmetry. Details on the use of parameter correlation in the four‐body term is out of the scope of this work and can be found elsewhere.35 Data analysis was performed by minimizing a χ2‐like residual function that compares the theoretical (model) signal, μ mod(E), to the experimental one, μ exp(E). The phase shifts of the photoabsorber and backscatterer atoms were calculated from the structure reported by Song et al.8 according to the muffin‐tin approximation and allowing 10 % overlap between the muffin‐tin spheres. The Hedin–Lundqvist complex potential36 was used for the exchange‐correlation potential of the excited state. The core–hole lifetime, Γ c, was fixed to the tabulated value37 and was included in the phase shift calculation.
MCR‐ALS
MCR‐ALS provides an additive bilinear model of pure contributions without any a priori information on the system by decomposing the experimental matrix (XS,W) in a product of two matrices [Eq. (1)]:38
| (1) |
in which CS,F is the column matrix of the concentration profile, AF,W is the row matrix of the XANES spectra of pure species, and ES,W is the matrix of the residue. The decomposition of the experimental matrix was achieved by using evolving factor analysis (EFA),38 which was used to retrieve the number of pure species and to give a first estimate of their concentration profiles, required to initialize the ALS refinement. To obtain a unique and meaningful solution, the closure condition and the non‐negativity of both the concentration and the pure spectral components were used as constraints.
Conflict of interest
The authors declare no conflict of interest.
Supporting information
As a service to our authors and readers, this journal provides supporting information supplied by the authors. Such materials are peer reviewed and may be re‐organized for online delivery, but are not copy‐edited or typeset. Technical support issues arising from supporting information (other than missing files) should be addressed to the authors.
Supplementary
Acknowledgements
Measurements at ELETTRA were supported through project number 20180220 (M.G. as P.I.). M.G. acknowledges the support Initiative and Networking Fund of the Helmholtz As‐sociation within the Network of Excellence on post‐Lithium batteries (ExNet‐0035) for the visiting professor scholarship at Helmholtz Institute Ulm. The HIU authors acknowledge the basic funding of the Helmholtz Association.
A. Mullaliu, G. Aquilanti, P. Conti, M. Giorgetti, S. Passerini, ChemSusChem 2020, 13, 608.
Contributor Information
Prof. Dr. Marco Giorgetti, Email: marco.giorgetti@unibo.it.
Prof. Dr. Stefano Passerini, Email: stefano.passerini@kit.edu.
References
- 1. Chu S., Majumdar A., Nature 2012, 488, 294–303. [DOI] [PubMed] [Google Scholar]
- 2. Tarascon J. M., Armand M., Nature 2001, 414, 359–367. [DOI] [PubMed] [Google Scholar]
- 3. Goodenough J. B., Manthiram A., MRS Commun. 2014, 4, 135–142. [Google Scholar]
- 4. Goodenough J. B., Energy Environ. Sci. 2014, 7, 14–18. [Google Scholar]
- 5. Bresser D., Hosoi K., Howell D., Li H., Zeisel H., Amine K., Passerini S., J. Power Sources 2018, 382, 176–178. [Google Scholar]
- 6. Lu Y., Wang L., Cheng J., Goodenough J. B., Chem. Commun. 2012, 48, 6544–6546. [DOI] [PubMed] [Google Scholar]
- 7. Wang L., Lu Y., Liu J., Xu M., Cheng J., Zhang D., Goodenough J. B., Angew. Chem. Int. Ed. 2013, 52, 1964–1967; [DOI] [PubMed] [Google Scholar]; Angew. Chem. 2013, 125, 2018–2021. [Google Scholar]
- 8. Song J., Wang L., Lu Y., Liu J., Guo B., Xiao P., Lee J. J., Yang X. Q., Henkelman G., Goodenough J. B., J. Am. Chem. Soc. 2015, 137, 2658–2664. [DOI] [PubMed] [Google Scholar]
- 9. Pasta M., Wessells C. D., Liu N., Nelson J., McDowell M. T., Huggins R. A., Toney M. F., Cui Y., Nat. Commun. 2014, 5, 3007. [DOI] [PubMed] [Google Scholar]
- 10. Wessells C. D., McDowell M. T., Peddada S. V., Pasta M., Huggins R. A., Cui Y., ACS Nano 2012, 6, 1688–1694. [DOI] [PubMed] [Google Scholar]
- 11. Wessells C. D., Peddada S. V., Huggins R. A., Cui Y., Nano Lett. 2011, 11, 5421–5425. [DOI] [PubMed] [Google Scholar]
- 12.“Metal Hexacyanoferrates: Ion Insertion (or Exchange) Capabilities”: Mullaliu A., Giorgetti M. in Applications of Ion Exchange Materials in the Environment, Springer, Cham, 2019, pp. 109–133. [Google Scholar]
- 13. Sato O., Iyoda T., Fujishima A., Hashimoto K., Science 1996, 272, 704–705. [DOI] [PubMed] [Google Scholar]
- 14. Chen R., Tanaka H., Kawamoto T., Asai M., Fukushima C., Kurihara M., Watanabe M., Arisaka M., Nankawa T., Electrochem. Commun. 2012, 25, 23–25. [Google Scholar]
- 15. Ciabocco M., Cancemi P., Saladino M. L., Caponetti E., Alduina R., Berrettoni M., J. Biol. Inorg. Chem. 2018, 23, 385–398. [DOI] [PubMed] [Google Scholar]
- 16. Kurihara Y., Matsuda T., Moritomo Y., Jpn. J. Appl. Phys. 2013, 52, 017301. [Google Scholar]
- 17. Matsuda T., Takachi M., Moritomo Y., Chem. Commun. 2013, 49, 2750–2752. [DOI] [PubMed] [Google Scholar]
- 18. Zhou A., Xu Z., Gao H., Xue L., Li J., Goodenough J. B., Small 2019, 15, 1902420. [DOI] [PubMed] [Google Scholar]
- 19. Mullaliu A., Asenbauer J., Aquilanti G., Passerini S., Giorgetti M., Small Methods 2019, 1900529. [DOI] [PubMed] [Google Scholar]
- 20. Wang H., Xu E., Yu S., Li D., Quan J., Xu L., Wang L., Jiang Y., ACS Appl. Mater. Interfaces 2018, 10, 34222–34229. [DOI] [PubMed] [Google Scholar]
- 21. Moritomo Y., Urase S., Shibata T., Electrochim. Acta 2016, 210, 963–969. [Google Scholar]
- 22. Kurihara Y., Moritomo Y., Jpn. J. Appl. Phys. 2014, 53, 067101. [Google Scholar]
- 23. Ganguli S., Bhattacharya M., J. Chem. Soc. Faraday Trans. 1 1983, 79, 1513–1522. [Google Scholar]
- 24. Kareis C. M., Lapidus S. H., Her J. H., Stephens P. W., Miller J. S., J. Am. Chem. Soc. 2012, 134, 2246–2254. [DOI] [PubMed] [Google Scholar]
- 25. Giorgetti M., Berrettoni M., Inorg. Chem. 2008, 47, 6001–6008. [DOI] [PubMed] [Google Scholar]
- 26. Pasta M., Wang R. Y., Ruffo R., Qiao R., Lee H. W., Shyam B., Guo M., Wang Y., Wray L. A., Yang W., Michael M. F., Cui Y., J. Mater. Chem. A 2016, 4, 4211–4223. [Google Scholar]
- 27. Conti P., Zamponi S., Giorgetti M., Berrettoni M., Smyrl W. H., Anal. Chem. 2010, 82, 3629–3635. [DOI] [PubMed] [Google Scholar]
- 28. Rodríguez-Carvajal J., Phys. B 1993, 192, 55–69. [Google Scholar]
- 29. Momma K., Izumi F., J. Appl. Crystallogr. 2011, 44, 1272–1276. [Google Scholar]
- 30. Aquilanti G., Giorgetti M., Dominko R., Stievano L., Arčon I., Novello N., Olivi L., J. Phys. D 2017, 50, 074001. [Google Scholar]
- 31. Ravel B., Newville M., J. Synchrotron Radiat. 2005, 12, 537–541. [DOI] [PubMed] [Google Scholar]
- 32. Filipponi A., Di Cicco A., Natoli C. R., Phys. Rev. B 1995, 52, 15122–15134. [DOI] [PubMed] [Google Scholar]
- 33. Filipponi A., Di Cicco A., Phys. Rev. B 1995, 52, 15135–15149. [DOI] [PubMed] [Google Scholar]
- 34. Giorgetti M., Berrettoni M., Filipponi A., Kulesza P. J., Marassi R., Chem. Phys. Lett. 1997, 275, 108–112. [Google Scholar]
- 35. Giorgetti M., Guadagnini L., Tonelli D., Minicucci M., Aquilanti G., Phys. Chem. Chem. Phys. 2012, 14, 5527–5537. [DOI] [PubMed] [Google Scholar]
- 36. Hedin L., Lundqvist I. B., Lundqvist S., Solid State Commun. 1971, 9, 537–541. [Google Scholar]
- 37. Krause M. O., Oliver J. H., J. Phys. Chem. Ref. Data 1979, 8, 329–338. [Google Scholar]
- 38. De Juan A., Jaumot J., Tauler R., Anal. Methods 2014, 6, 4964–4976. [Google Scholar]
Associated Data
This section collects any data citations, data availability statements, or supplementary materials included in this article.
Supplementary Materials
As a service to our authors and readers, this journal provides supporting information supplied by the authors. Such materials are peer reviewed and may be re‐organized for online delivery, but are not copy‐edited or typeset. Technical support issues arising from supporting information (other than missing files) should be addressed to the authors.
Supplementary