Abstract
Continuous and beat-to-beat monitoring of blood pressure (BP), compared to office-based BP measurement, provides significant advantages in predicting future cardiovascular disease. Traditional BP measurement methods are based on a cuff, which is bulky, obtrusive and not applicable to continuous monitoring. Measurement of pulse transit time (PTT) is one of the prominent cuffless methods for continuous BP monitoring. PTT is the time taken by the pressure pulse to travel between two points in an arterial vessel, which is correlated with the BP. In this paper, we present a new cuffless BP method using an array of wrist-worn bio-impedance sensors placed on the radial and the ulnar arteries of the wrist to monitor the arterial pressure pulse from the blood volume changes at each sensor site. BP is accurately estimated by using AdaBoost regression model based on selected arterial pressure pulse features such as transit time, amplitude and slope of the pressure pulse, which are dependent on the cardiac activity and the vascular properties of the wrist arteries. A separate model is developed for each subject based on calibration data to capture the individual variations of BP parameters. In this pilot study, data was collected from 10 healthy participants with age ranges from 18 to 30 years after exercising using our custom low-noise bio-impedance sensing hardware. Post-exercise BP was accurately estimated with an average correlation coefficient and root mean square error (RMSE) of 0.77 and 2.6 mmHg for the diastolic BP and 0.86 and 3.4 mmHg for the systolic BP.
Keywords: Bio-impedance, blood pressure, cuffless, pulse transit time, wearable, wrist
I. Introduction
CARDIOVASCULAR disease is the leading global cause of death, accounting for more than 17.3 million deaths per year in 2013 (31% of all global deaths), a number that is expected to grow to more than 23.6 million by 2030 [2]. In 2010, the estimated global cost of cardiovascular disease was $863 billion, and it is estimated to rise to $1044 billion by 2030 according to the predictions of the American Heart Association. Blood pressure (BP) is a leading risk factor for the prediction of cardiovascular disease [3]. Many studies have now confirmed that ambulatory BP measured continuously every half-hour over a 24-hour period is better than traditional office-based BP measurement in predicting future cardiovascular events. Moreover, the nighttime pressure is superior to daytime pressure in predicting cardiovascular disease [4]. BP is commonly measured by a sphygmomanometer or oscillometric method using an inflatable cuff which is bulky, obtrusive and allows only sporadic measurements [5]. Therefore, cuffless BP monitoring methods are essential to achieving continuous BP measurement during daily activities and sleeping in order to provide better predictions for cardiovascular disease. Our objective in this paper is to develop a cuffless BP monitoring method for a wrist-worn device, which is comfortable and easy-to-use to provide continuous and accurate BP measurements autonomously without user intervention. A prominent method for continuous BP monitoring without using a cuff is pulse transit time (PTT). This method relies on modeling the correlation between BP and PTT which is the time taken by the pressure pulse to travel through the arteries between two fixed points during each cardiac cycle. PTT increases as BP decreases according to Moens–Korteweg equation [6]. PTT is challenging to be measured between two points within a few centimeters over the wrist arteries because it requires accurate local measurements of the pressure pulse. In addition, the radial and ulnar arteries of the wrist exhibit different vascular properties, which affect the PTT measurements. Our approach is based on placing an array of sensors on the wrist arteries, which provide local measurements of the cardiac activity of both the radial and ulnar arteries for accurate estimation of the PTT and consequently the BP [1]. In this paper, we use a model for the vascular properties of the radial and ulnar arteries of the wrist to estimate the systolic and diastolic BP by a regression model based on PTT and other features extracted from an array of 2x2 of bio-impedance sensors placed on the wrist arteries. A pair of bio-impedance sensors are placed on each of the radial and ulnar arteries to measure the local blood volume changes of the arteries to estimate the local PTT of each artery for accurate BP measurements. A model is generated for each user to characterize the unique vascular properties of the wrist arteries, which vary from person to person. We use bio-impedance sensing because it is a non-invasive electrical signal that can measure local blood volume changes in the arteries using small metal electrodes placed on the skin. Bio-impedance sensors are low cost and low power, which can be easily used for a large array of sensors in a wearable device. In addition, configurable sensing areas can be realized by controlling the location of the current injection and voltage sensing electrodes.
The contributions of this paper can be summarized as follows:
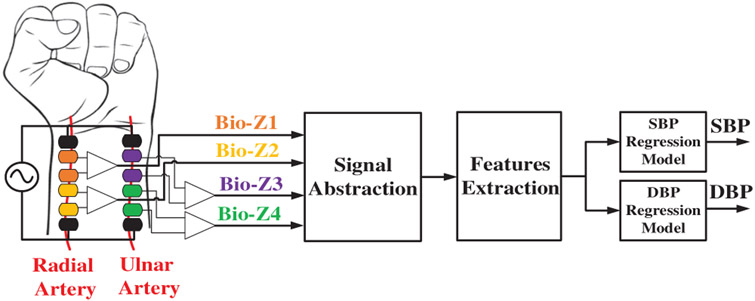
A new cuffless BP method using an array of bio-impedance sensors placed on the radial and ulnar arteries of the wrist, which can be integrated into a wrist-worn device, as illustrated in Fig. 1.
High-resolution bio-impedance sensing circuits and signal processing with root mean square error (RMSE) less than 1 mΩ for accurate measurements of the local arterial pressure pulse in the wrist arteries.
Accurate systolic and diastolic BP estimation by abstracting the pressure pulse with six characteristic points which are used for feature extraction based on the amplitude and slope of the pulse of each sensor and the transit time between each pair of sensors.
In this pilot study, we evaluate the performance of our methods on 10 human subjects for post-exercise blood pressure changes.
Fig. 1.
The block diagram of the BP estimation hardware and signal processing from wrist-worn bio-impedance sensors array. [1]
This paper is organized into seven sections. After the introduction, the previous work related to cuffless BP is presented in section II. Our methods are discussed in section III, and the data collection procedures are shown in section IV. The results are presented in section V, and the limitations of this work are discussed in section VI. Finally, conclusions are presented in section VII.
II. Previous Work
The high potential for using PTT method for continuous BP measurement has led to significant interest in the research community. The predominant method of estimating PTT in the literature measures the time delay between each R-peak of the Electrocardiogram (ECG) signal and a characteristic point on a corresponding pulse wave measured by a distally placed sensor of a different modality, e.g., photoplethysmography (PPG) or bio-impedance (Bio-Z) [7-12]. These PTT measurement methods rely on ECG, which has two main issues. First, ECG is monitored from the potential between two electrodes across the two sides of the heart, which can be realized in a small form factor device as a chest patch. However, this patch is not conveniently wearable and cannot be integrated with the distal pulse arrival sensor in a single wearable device. Second, the time delay measured using ECG includes the pre-ejection period (PEP), which is the time from the onset of the R-peak to the start of the physical pumping of blood out of the heart. PEP is not included in PTT and is not correlated with BP, which leads to higher errors in BP estimation [13]. In a previous study, a wrist-worn device was used to monitor BP based on PTT measured from ECG and PPG signals. However, the user needs to press a finger on an electrode on the device to get a measurement by monitoring ECG between both hands [14]. BP was also monitored through a watch using seismocardiogram (SCG) and PPG sensors only when the user holds his arm with the watch towards his chest for a specific time [15]. In another prior investigation, BP was measured without ECG using PTT calculated from dual PPG sensors placed on the forearm and the wrist with 17cm distance between them, which cannot fit in a small form factor wearable device [16]. In a more recent investigation, a smartphone-based approach was used to measure BP via the oscillometric finger-pressing method, which requires the user to press his finger towards a PPG sensor with gradual pressure increase constrained by a specific range [17]. These methods, although providing interesting and important insights into BP monitoring, are not applicable for continuous BP monitoring because they require user’s intervention or cannot be incorporated into a smart watch form factor for a true wearable experience. A recent investigation estimated BP using PTT measured from a pair of bio-impedance sensors placed on the wrist where each sensor covers both arteries [18]. This method measures a global PTT from both arteries, which results in larger BP error compared to our approach that depends on local measurements from each artery.
PPG sensors are commonly used for measuring hemodynamic parameters including heart rate, PTT and cuffless BP monitoring leveraging optics. In previous work, a multi-wavelength PPG sensor on the finger was used to measure the pulse delay through the arterioles and the capillaries, which was found to be correlated to BP [19]. On the other side, the proposed approach depends on measuring the pulse transit time through the arteries, which are the main blood vessels that branch into multiple smaller arterioles, which branch into further smaller capillaries. BP is mainly controlled by the stiffness of the arteries rather than the arterioles and the capillaries. In the arteries, the pulse pressure (PP) and blood velocity near the heart are very high and decrease in the arterioles and the capillaries where the rate of flow is slowed by the narrow openings of the arterioles and the capillaries till BP becomes constant inside the capillaries. Therefore, estimation of pulse transit time through the arteries is more accurate than the arterioles and the capillaries. In addition, the challenge with optical modalities is the light cannot travel far and can only capture blood volume changes in skin surface (i.e. from capillaries). On the other hand, since Bio-Z injects a current, it can reach deeper tissue compared to the propagation depth of light used by PPG sensors. Thus, the Bio-Z signal provides a more accurate measurement of arterial blood volume changes since it can reach deep arterial sites. PPG signals can be affected by ambient light and skin tone, which is not applicable for bio-impedance. In addition, the PPG signal requires optical components such as a light source and a photo detector, which consume large power to penetrate the skin.
Other pulse waveform measurement methods are available such as flexible strain or pressure sensors placed over a superficial artery, which can measure waveforms indicative of BP via the tonometric principle [20]. The strain sensor measures the force on the skin surface due to the pulsation of the artery that is deep inside the tissue. Therefore, the measured signal is corrupted by external sources of skin movements such as muscle contractions. On the other side, Bio-Z sensor injects current into the body and senses the voltage difference using separate pairs of electrodes (4-probe Kelvin sensing) to measures the impedance of the underlying tissue and blood volume changes inside the arteries with the minimum effect from skin surface movements. Recently, ultra-thin ultrasound device was presented for cuffless BP monitoring by measuring blood flow velocity [21]. However, ultrasound methods use highly directive beam, which is extremely sensitive to the placement location of the device relative to the artery, and require an expert to place the sensor directly over the artery to get the arterial pulse signal. On the other side, the Bio-Z sensor has lower directivity, which makes it less sensitive to the artery’s location. In addition, the Bio-Z sensor has lower power consumption compared to ultrasound because Bio-Z operate at low frequency of few kHz compared to few MHz for ultrasound. Furthermore, the simplicity of the hardware implementation of the Bio-Z sensor is preferable for our method, which relies on an array of sensors integrated into a small-form factor wearable device.
III. Methods
A. Bio-impedance Sensing Hardware
Bio-impedance is an electrical non-invasive signal measured by injecting AC current in the human body and sensing the voltage difference using separate pairs of electrodes. The changes in bio-impedance over time (ΔZ) corresponds to the blood volume changes at the sensing location, which is used to measure the arrival time of the pressure pulse. In order to measure PTT over wrist arteries, a pair of Bio-Z sensors are placed on the wrist along the radial artery (Bio-Z1 & Bio-Z2) and another pair were placed along the ulnar artery (Bio-Z3 & Bio-Z4). Each pair of sensors shares the current injection electrodes to place all the electrodes in a small area suitable for a small form factor wrist watch. Small size pre-gelled Ag/AgCl electrodes with dimensions 0.8cm x 1.5cm are used to provide contact with the skin for current injection and voltage sensing. The spacing between the sensing electrodes is 0.8cm and all other electrodes are placed as close as possible.
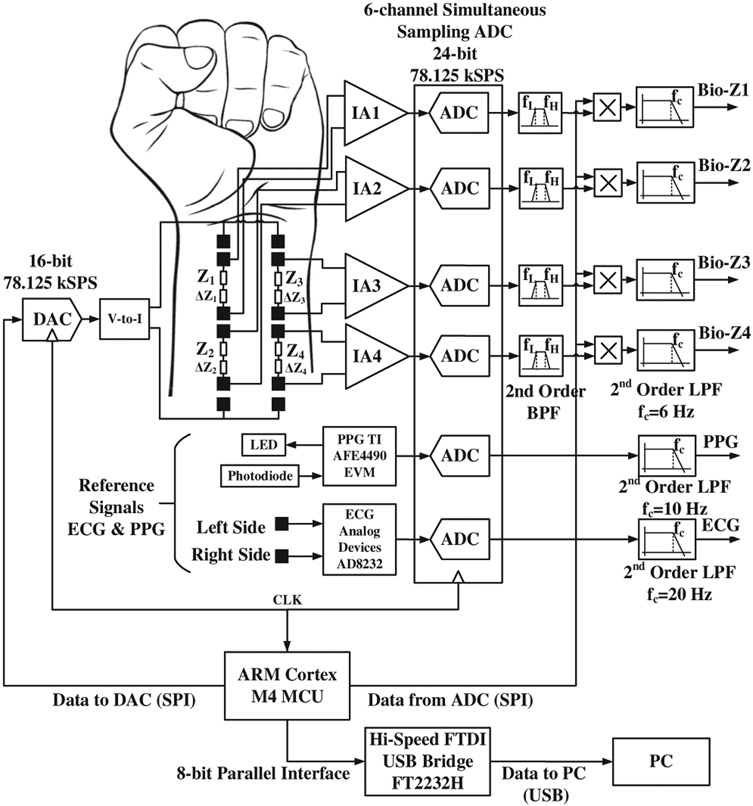
The amplitude of the Bio-Z variations due to blood volume changes is very small of about 20 mΩ for the proposed small spacing distance between sensing electrodes. Therefore, we built low-noise bio-impedance sensing hardware using discrete components to provide high-quality signals of the blood volume changes from the wrist arteries. Our bio-impedance sensing hardware depends on the ARM Cortex M4 microcontroller (MCU), which sends a digital waveform to a 16-bit digital-to-analog converter (DAC) to drive the voltage-to-current converter to generate a programmable AC current signal. The MCU can control the frequency and amplitude of the current signal as shown in Fig. 2. Any residual DC voltage at the DAC output is removed by a series capacitor to avoid injection of DC current into the human body. We measure a voltage in response to the injected current, which is modulated in amplitude (amplitude modulation or AM) as a function of the tissue bio-impedance. The sensed voltage is demodulated. The voltage sensing path depends on the low noise instrumentation amplifier (IA) AD8421 from Analog Devices with low noise spectral density of 3.5 nV/√/Hz at 1 kHz. The IA is followed by an analog anti-aliasing low-pass filter, after which the signal is sampled by a high-precision analog-to-digital converter (ADC). The IA has a programmable gain set by an external resistor, which is adjusted to provide a gain of 40 dB to measure Bio-Z up to 70 Ω. In addition, the IA has a high common-mode rejection ratio (CMRR) of 126 dB to cancel out the DC offset voltage before ADC sampling in order to ensure full utilization of the ADC’s dynamic range. The circuits of the sensing path are replicated exactly for the four Bio-Z channels in order to match the delays between them to ensure time synchronization. The time delay mismatch between the Bio-Z channels was measured to be a few micro seconds using an external resistor connected to all channels. The ADC ADS1278 from Texas Instruments samples the four Bio-Z channels simultaneously at 78.125 kSPS with 24-bit resolution to enable accurate measurement of PTT with a time error less than 12.8 μs, or 0.39% of the average measured PTT. Table I presents a summary of the specifications used in the proposed Bio-Z sensing hardware.
Fig. 2.
The block diagram of the bio-impedance sensing hardware. [1]
TABLE I.
Bio-Z Hardware Specifications
| Specification | Value |
|---|---|
| Resistance Range | Up to 70 Ω |
| Accuracy | 1 mΩ |
| IA Gain | 40 dB |
| IA CMRR | 126 dB |
| Sampling Frequency | 78.125 kSPS |
| 3-dB Bandwidth | 6 Hz |
| Number of Channels | 6 |
The sampled data of all channels are sent to the MCU through SPI interface, which then sends it to the PC through an FTDI Hi-Speed USB Bridge for signals post-processing. Each received channel is filtered by a bandpass filter centered around the AC current frequency to remove the residual DC offset, 60 Hz interference and high-frequency noise. Then, the Bio-Z is extracted using synchronous demodulation by multiplying the filtered signal by the in-phase carrier signal generated by the MCU and its quadrature to generate the real and imaginary parts of the Bio-Z signal. The multiplier outputs are filtered by a second order low pass filter with a cut-off frequency of 6 Hz to remove the image frequency and out of band noise, and measure up to the maximum human heart rate of 220 beats per minute. The hardware is calibrated by measuring the impedance of a known resistor in order to convert the measured voltage to an accurate resistance value. The measurement system was capable of measuring impedance with RMS error less than 1 mΩ, which is much lower than the target Bio-Z variations.
B. Blood Pressure Estimation Algorithms
The BP estimation algorithms consist of signal abstraction of each Bio-Z signal with its characteristic points followed by feature extraction, and finally systolic BP (SBP) and diastolic BP (DBP) estimation using AdaBoost regression models.
1). Signal Abstraction
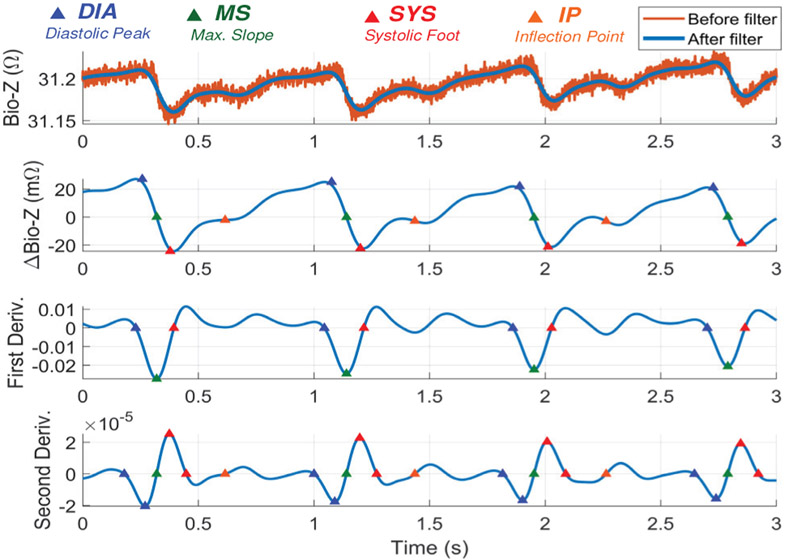
The wrist Bio-Z signal variations due to blood volume changes in the arteries are abstracted by four characteristic points for every heart beat after removing the Bio-Z DC offset. At every heart beat, the Bio-Z signal descends from the first main peak to the first notch, which indicates a sudden increase in the blood volume due to the arrival of the pressure pulse to the sensing location. The Bio-Z peak point represents the diastolic phase while the notch point represents the systolic phase of the pressure pulse. In addition, the back reflection of the pressure pulse due to higher vascular resistance causes the second smaller peak and notch in the middle of the cardiac cycle. In order to detect both DBP and SBP, we use four characteristic points from all phases of the cardiac pulse of Bio-Z signal, which are the diastolic peak, maximum slope, systolic foot and the inflection point as shown in Fig. 3. The diastolic peak (DIA) and the systolic foot (SYS) are detected by the intersection of the tangent to the slope with the horizontal line from the maximum and the minimum of the signal, respectively. This method provides accurate measurement of the diastolic and systolic points because it is immune to noise that may occur at the peak or the foot of the signal [22]. The maximum slope (MS) point is also an important point in the middle of the descending slope section. The fourth point is the inflection point (IP), which is the maximum slope point between the second peak and notch. All these points are identified from the first and the second derivative of the Bio-Z signal using the zero crossing, peak and foot points. The amplitude and time values of these points are used for extracting the BP features.
Fig. 3.
The Bio-Z signal marked with four different points selected for Bio-Z signal abstraction, which are diastolic peak (DIA), maximum slope (MS), systolic foot (SYS) and inflection point (IP). [1]
2). Features Extraction
The features extracted from the measured pulse waveforms are highly correlated with BP. When the heart pumps blood to the rest of the body, the velocity of the pressure pulse, which propagates through the arteries, is highly correlated with the elastic properties of arteries, similar to a pipe with elastic walls according to Moens–Korteweg (M–K) equation [6]:
| (1) |
where PWV is the pulse wave velocity, E is Young’s modulus, which is related to the vessels elasticity, h is the vessel thickness, R is the inner radius of vessels and ρ represents the blood density. For an elastic vessel, the relation between the blood pressure and E is given by [23] as follows:
| (2) |
where E0 and P0 are constants, P represents the blood pressure in arteries and α is a correction factor. PWV can be measured by dividing PTT by the distance between two sensing sites on an artery. Therefore, PTT was selected as one of our main features of BP, which is proportional to 1/PTT2. Additional features were also selected to improve correlation with BP such as the ratio between the amplitudes of systolic foot and inflection point relative to the diastolic peak, which is a measure of the intensity of the reflection wave. In addition, the time interval between the systolic foot and the inflection point measures the arterial stiffness, while the area under the curve represents the total peripheral resistance [24]. All these features are useful in modeling the vascular properties of arteries and we use them in building the regression model for BP.
The four characteristic points of the four Bio-Z signals are used to generate 50 features for each heart beat that can accurately model the vascular properties of the two arteries of the wrist. The features can be categorized into four sets, which are PTT, time, amplitude and area as shown in TABLE II. The PTT features are calculated from each pair of signals, while the rest of the features are calculated from each signal individually. These features are related to the cardiac output and arterial stiffness of each wrist artery which can be used for accurate estimation of BP. Window-based features are proposed in this paper in order to reduce the effect of feature variations from beat to beat due to noise or other physiological activities that are uncorrelated to BP such as respiration rate. The window-based features are calculated by taking the average of the beat-by-beat features over 10 beats with 50% overlap. We assume BP to be constant during each window which is equivalent to an average of 8 seconds of time, which is a realistic expectation.
TABLE II.
Wrist Bio-Z Features
| Feature Set |
Feature Description | Number of Features |
|---|---|---|
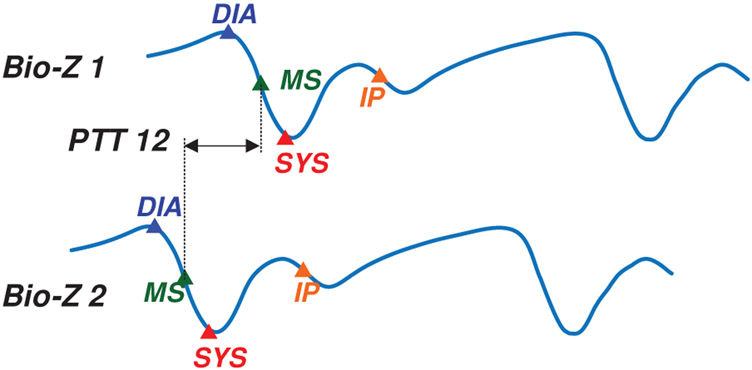
| PTT | The time delay between each pair of Bio-Z signals measured at MS point as shown in Fig. 4. | 6 |
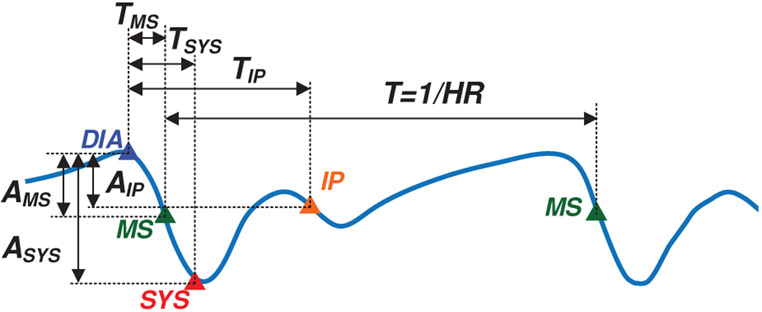
| Time | The inter-beat interval (T) and the time interval from the DIA point to the rest of points, which are TMS, TSYS and TIP as shown in Fig. 5. | 16 |
| Amplitude | These are the difference in amplitude from DIA point to the rest of points, which are AMS, ASYS and AIP as shown in Fig. 5 | 12 |
| Area | The areas under the Bio-Z curve starting from the DIA point to the rest of points, which are ARMS, ARSYS, ARIP and AR as shown in Fig. 6. |
16 |
3). BP Regression Model
Finally, DBP and SBP are estimated using advanced regression models trained by the Bio-Z features extracted from the wrist and BP data measured simultaneously by a reference continuous BP monitoring device. Although BP varies from one location to another over an artery, they are correlated with each other. Our method provides brachial BP measurements from features extracted from the wrist pulse signals by training the regression models using brachial BP data. Separate models are used for DBP and SBP estimation because DBP and SBP rely on different features. The models are trained for each user in order to capture the individual variations of their vascular properties for more accurate BP estimation.
Our subject-specific models are trained using a limited number of training window samples for each subject, which require careful selection of model hyper-parameters to avoid overfitting. We use the Adaptive Boosting (AdaBoost) regression model, which establishes a prediction by combining the outputs of a number of weak learners through a weighted sum of different subsets of the training data set. AdaBoost is an ensemble learner that reduces overfitting by decreasing the variance between the different training data subsets. The dataset of each subject is shuffled and divided into 10 folds to get 80% of the data for training the models, 10% for selecting the hyper-parameters, and 10% for testing. The AdaBoost models consist of 50 decision trees with tree depth is selected from the range of 4 to 14. For each model, the tree depth with the minimum testing error is selected to provide the best model complexity that avoids overfitting and underfitting. The performance of the models is evaluated using the average across all the 10 folds of the root mean square error (RMSE), mean absolute error (MAE) and correlation coefficient (R).
IV. Data Collection
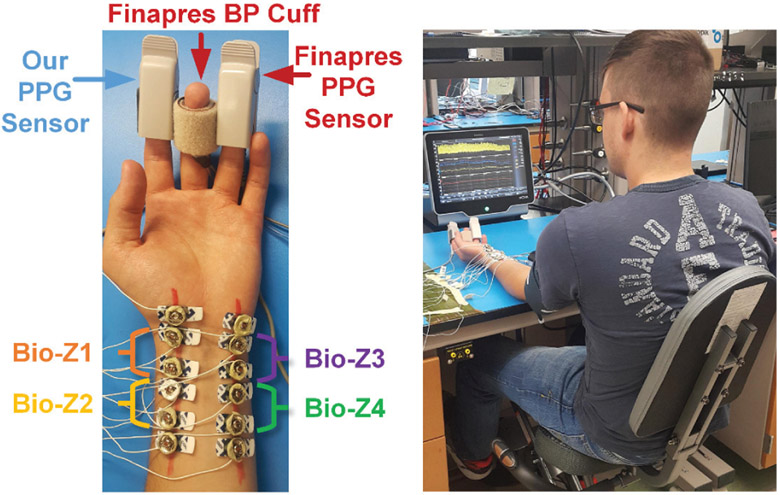
The performance of our method was evaluated using Bio-Z and BP data collected simultaneously from human subjects during exercising to produce a change in BP. Four Bio-Z signals were measured from the wrist using our hardware. The electrodes were placed on the radial and the ulnar arteries, as shown in Fig. 7, after detecting the location of the arteries using the Huntleigh Dopplex MD2 Bi-Directional Doppler, which can measure arterial blood flow with a high sensitivity probe with a diameter of 20 mm. For the Bio-Z current injection frequency, we used the highest possible frequency supported by our measurement system, which is 9.75 kHz. At higher current injection frequency, the cell membrane impedance gets smaller, more current can flow inside the cells and the electrode exhibits a lower impedance with the skin, which results in better sensing of blood volume changes from the Bio-Z signal. The current amplitude was adjusted to 800μA in order to be compliant with the safety standards [25]. For the validation of Bio-Z measurements, ECG signals from the chest and PPG signals from the finger were measured simultaneously with the Bio-Z signals. The ECG was measured by the SparkFun single lead Heart Rate Monitor board, which is based on the AD8232 analog front end developed by Analog Devices. The leads were attached to Covidien pre-gelled ECG patches and placed on the chest to provide a single channel of ECG. The PPG was measured using the AFE4490 EVM by Texas Instruments. The sensor itself is a finger-clip based transmitting type PPG device. The ECG analog output and the PPG photodiode output were directly routed to two channels of our own ADC just like the Bio-Z channels to maintain accurate time synchronization between all of them.
Fig. 7.
Pictures showing the placement of electrodes and sensors on the wrist and fingers (left) and the experimental setup for BP monitoring (right). [1]
In order to monitor SBP and DBP at every heart beat simultaneously with Bio-Z, continuous BP was measured using the non-invasive reference device Finapres NOVA system. This system measures BP continuously using a finger pressure cuff placed on the middle finger, which was calibrated by the standard brachial pressure cuff. Finapres system was cleared from the U.S. Food and Drug Administration (FDA) for measuring BP in 2017 [26] and is also widely used in literature as a reference device for continuous BP measurements [10, 17, 27-29]. In order to synchronize the heart beats of the Bio-Z signal acquired by our setup with the continuous BP signal measured from Finapres device, an additional PPG signal was monitored by the Finapres device using a PPG finger clip. Both PPG signals measured by our setup and Finapres were synchronized together using a matched filter dependent on matching the unique pattern of inter-beat-intervals.
Data was collected from ten healthy human subjects (seven males and three females) with age ranges from 18 to 30 years in this pilot study under the IRB approval IRB2017-0086D by Texas A&M University, and each participant was seated on a bike with his arm rested on the bench. Initially, 3 minutes of data were collected at rest. Then, the participant exercised for 5 minutes through cycling on the bike to raise the BP followed by 4 minutes of data collection to capture the recovery of BP to its normal value. This was repeated 5 times to increase the number of samples collected per subject to be able to train a model for each subject. Finally, another 3 minutes of data were collected at rest.
V. Results
A. BP and Wrist Bio-impedance Data
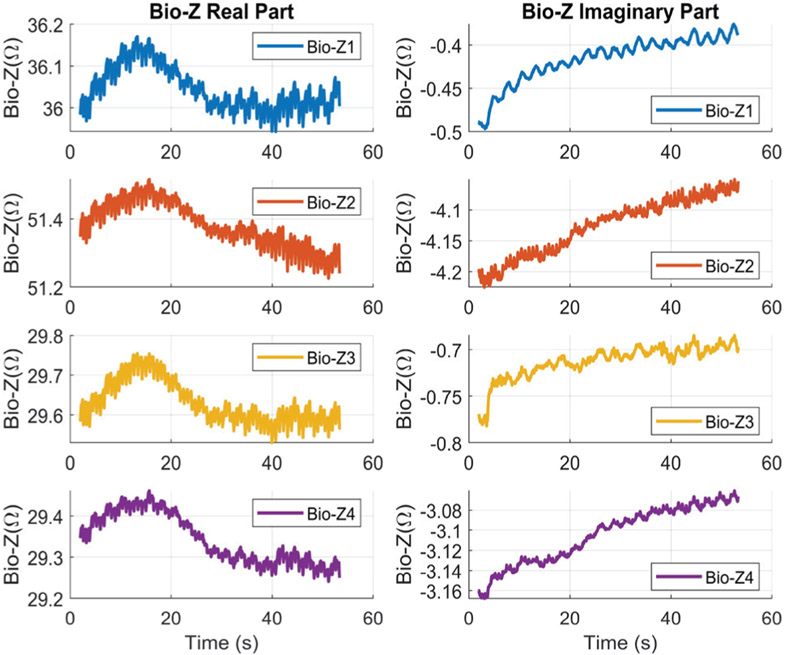
The proposed Bio-Z measurement method relies on synchronous demodulation, in order to monitor both the real and imaginary parts (or magnitude and phase) of the Bio-Z signal which provides complementary information about the tissue and blood flow. Fig. 8 shows an example of the real and imaginary parts of the four Bio-Z channels. Each Bio-Z signal consists of a DC offset which represents the tissue impedance in addition to variations due to heart signal rate. The DC component of the real part of wrist Bio-Z at 9.75 kHz varies from 29 to 51 Ω, which is significantly higher than the imaginary component that varies from 0.4 to 4 Ω depending on the Bio-Z sensor location. The DC offset varies slowly due to slight movements of the wrist. This slow variation of the DC offset is consistent across all sensors because they are placed within a small area on the wrist and affected by the same pattern of wrist movements. There are different trends in the real part compared to the imaginary part, because the real part measures the resistance of the intra- and extra- cellular fluids, while the imaginary part measures the capacitance of the cell membrane.
Fig. 8.
An example of the real and imaginary parts of the Bio-Z signals for the four sensors.
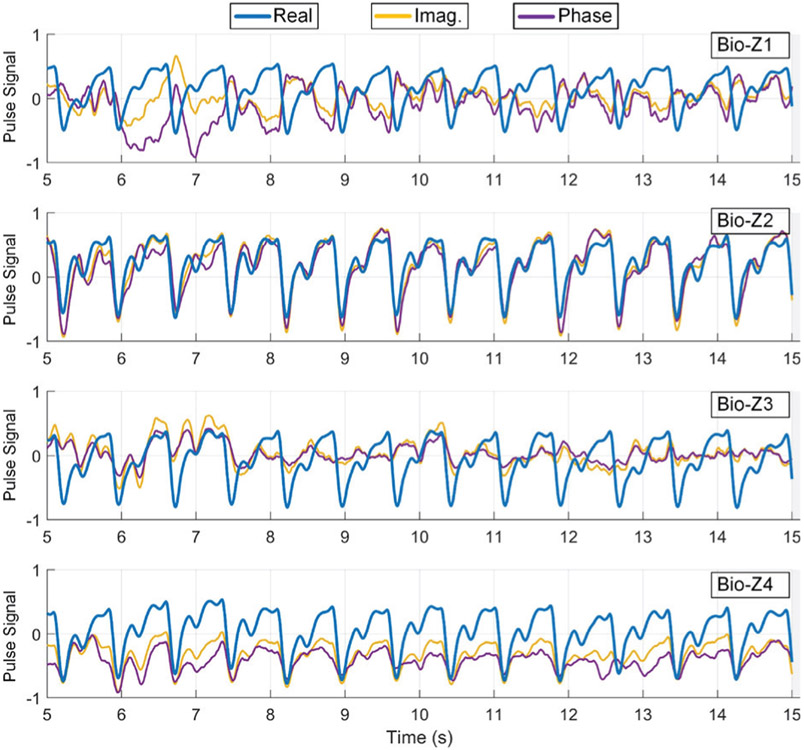
We compared the heart pulse signal of the different parts of the Bio-Z signal (real, imaginary, magnitude and phase) for the four Bio-Z sensors after removing the DC offset and respiration rate by a high pass filter as shown in Fig. 9. The real and magnitude of Bio-Z are almost equivalent because the real part is much larger than the imaginary part. Also, the pulse signal exhibits higher consistency in the real part compared to the imaginary and phase representations. Therefore, we used the pulse signal from the real part of Bio-Z for the proposed BP models.
Fig. 9.
An example of the heart pulse signals extracted from the real, imaginary and phase parts of ΔBio-Z for the four Bio-Z sensors. The real part has the most consistent pulse signal.
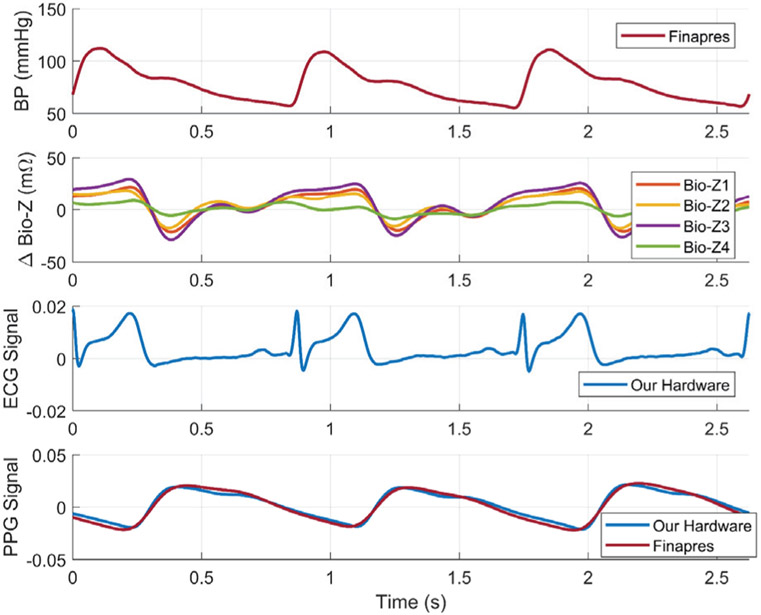
An example of the physiological signals as measured by our circuits and Finapres after filtering and pre-processing are shown in Fig. 10. The figure plots the Bio-Z variations (ΔBio-Z) versus time for the 4 sensors placed on the wrist arteries with an amplitude varying from ±10 mΩ to ±25mΩ after removing the DC offset. ΔBio-Z clearly shows the arrival time of the pressure pulse at the wrist arteries every heart beat which is the time when ΔBio-Z drops suddenly from the peak to the foot. Our measured ΔBio-Z signals in time domain show a significant difference in amplitude and timing between the four sensors placed on the wrist, which implies that vascular properties vary with location and from an artery to another. In addition, Fig. 10 shows the cardiac cycle that starts with the R-peak of the ECG signal followed by the rise in the BP from the DBP to SBP, and then the Bio-Z and PPG signals show the arrival of the pressure pulse at the wrist and the finger respectively. The reflections inside the arteries are shown by the smaller peaks that occur before the next heart beat.
Fig. 10.
An example of continuous BP signal measured from the Finapres device and bio-impedance variations measured from our four sensors placed on the radial and ulnar arteries of the wrist. Simultaneous ECG signal measured from the chest and PPG signal measured from the finger were shown for validation. [1]
Fig. 11 illustrates an example of the different Bio-Z waveforms during signal processing and characteristic points detection. The figure shows the raw Bio-Z signal with DC offset of around 31.2 Ω and high-frequency noise before low pass filtering, in addition to the clean output Bio-Z signal after the filtering. After removing the DC offset, ΔBio-Z is shown with amplitude of around ±20 mΩ. The ΔBio-Z is used to detect the four characteristic points (DIA, MS, SYS and IP) relying on the peak, foot and zero crossing points of the first and second derivatives of ΔBio-Z as shown in Fig. 11.
Fig. 11.
Example of Bio-Z signal before and after low pass filtering, ΔBio-Z, first derivative and second derivative highlighted with the detected four characteristic points (DIA, MS, SYS and IP)
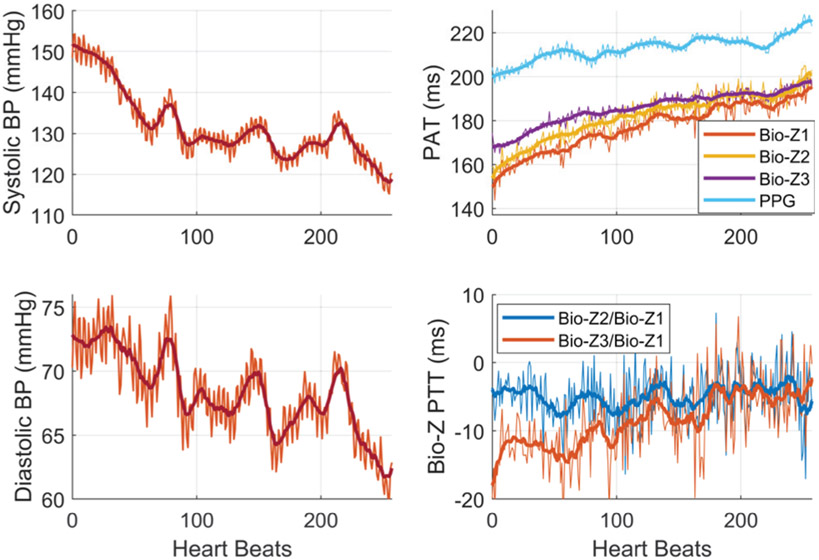
Fig. 12 shows an example of the beat-to-beat SBP and DBP of subject 1 for short period of 1.3 minutes (260 heart beats) after exercising simultaneously with the measured PTT in addition to the pressure pulse arrival time (PAT) which is the time from the R-peak of the ECG to the maximum slope point of the Bio-Z or PPG signals. The SBP and DBP decrease with heart beats from the elevated SBP and DBP of 150 and 75 mmHg respectively to the normal BP of 120 and 60 mmHg. In addition, the figure illustrates PAT at wrist and finger as they increase continuously when BP decreases with high correlation as expected. The PAT measured at the finger from the PPG sensor is higher than the PAT measured at the wrist from the Bio-Z sensors with around 30 ms. This shows that Bio-Z sensors at the wrist capture the arterial pulse signal that arrives at the wrist first then move to the finger following the blood flow direction in the arteries from the heart to the finger. Furthermore, the variation of beat-to-beat PTT due to BP change is shown in this figure. The PTT between different Bio-Z channels exhibit different behavior, therefore it is useful to account for PTT between all Bio-Z channels for more accurate BP estimation. The BP, PAT, and PTT show large variations from beat to beat due to physiological effects such as respiration rate. Therefore, the proposed window-based features act as a filter to remove these variations as shown by the solid lines in this figure, which leads to more accurate BP estimation compared to the beat-to-beat features. The measured PTT from the wrist is less than 30 ms and negative for some trials as shown in this figure because blood may move in the opposite direction for small distances near the wrist as a result of the reflection of the pressure pulse from the termination of the wrist arteries in the hand in addition to the slope variations between the measured Bio-Z signals due to different vascular properties [30].
Fig. 12.
The heartbeat-based and window-based BP and Bio-Z features after exercise for subject 1. [1]
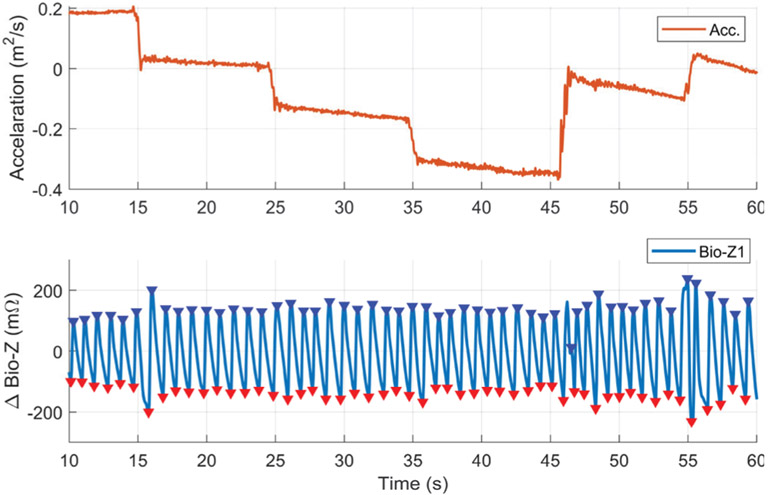
Motion artifacts especially due to wrist movements can cause signal corruption to the Bio-Z signals measured from the wrist sensors. Although the participants placed their wrist in resting position on the bench during the data collection, small wrist movements can cause Bio-Z signal corruption for few heart beats. We conducted a number of experiments for the characterization of the effect of small wrist movements on the measured Bio-Z signals. A motion sensor was placed on the wrist to measure the wrist movements simultaneously with the measured Bio-Z signals. The participants were asked to place their wrist on the bench in resting position then moved it by 5 cm horizontally every 10 seconds. Fig. 13 shows an example for the acceleration measured by the motion sensor and the Bio-Z signal measured from the sensor Bio-Z1 for 50 seconds during the wrist movements. The Bio-Z signal shows clear pulse waveform during the applied wrist movements with some noise in the waveform in few heart beats. This results show that Bio-Z signal can be reliably acquired during small movements of the wrist in our experiment.
Fig. 13.
An example of the clean pulse signal as measured from the ΔBio-Z signal in presence of small wrist movements that was captured by the acceleration change from a motion sensor placed on the wrist.
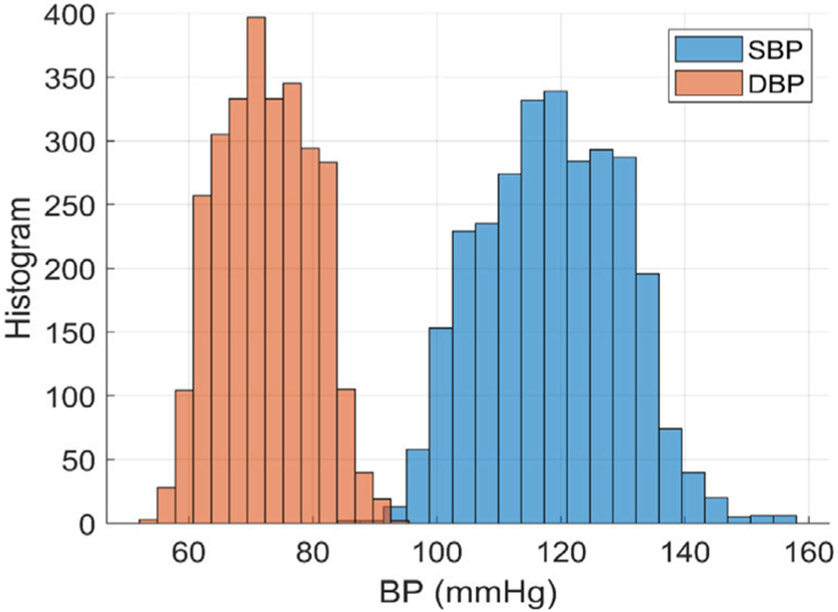
We collected a total of 13,050 samples of beat-to-beat BP and Bio-Z features which are equivalent to of 2,848 sample windows from all subjects after removing noisy samples which are the samples corrupted by motion artifacts. We removed the corrupted heart beats with large PTT variance higher than a certain threshold based on the small distance between the sensors. These noisy samples were removed to ensure proper training of our models and accurate BP predictions. The measured DBP ranges from 50 to 100 mmHg and SBP ranges from 90 to 160 mmHg according to the histogram in Fig. 14.
Fig. 14.
The histograms of DBP and SBP for all the subjects. The DBP ranges from 50 to 100 mmHg and SBP ranges from 90 to 160 mmHg.
B. BP Estimation Error
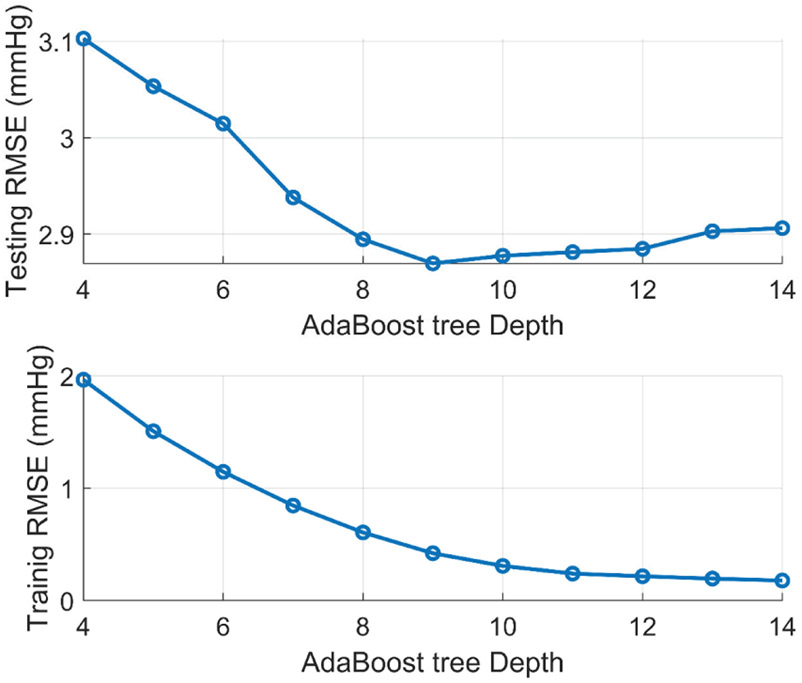
The collected BP and Bio-Z features were used for training and testing the AdaBoost regression models for DBP and SBP for each subject. The best tree depth was selected for each model at the minimum testing error to avoid over or under fitting. Fig. 15 shows an example of the behavior of the testing and training RMSE with the variation of the AdaBoost tree depth from 4 to 14. The training error decreases monotonically with increasing the tree depth, while the testing error had a minimum at tree depth of 9, which is the best choice for the model complexity for best fitting.
Fig. 15.
Example of the variation of testing and training error with changing the AdaBoost tree depth. The best model fitting occurs at the minimum testing error wat tree depth=9.
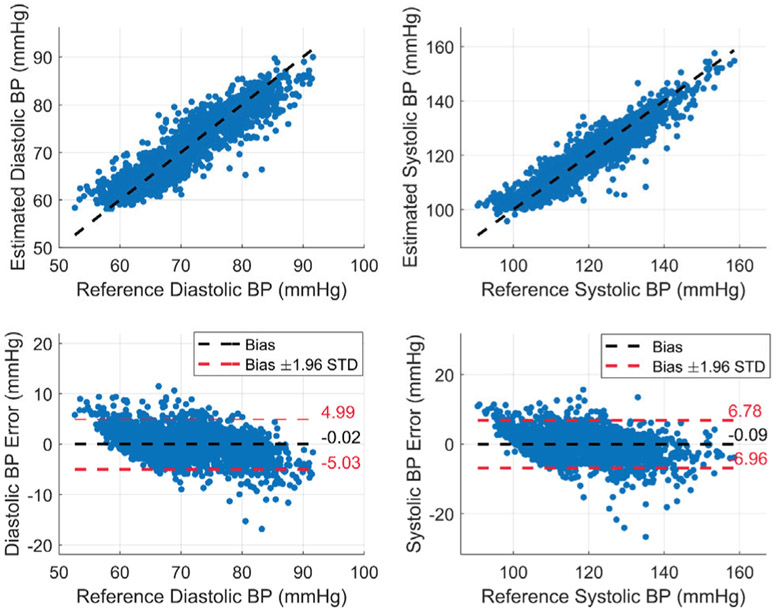
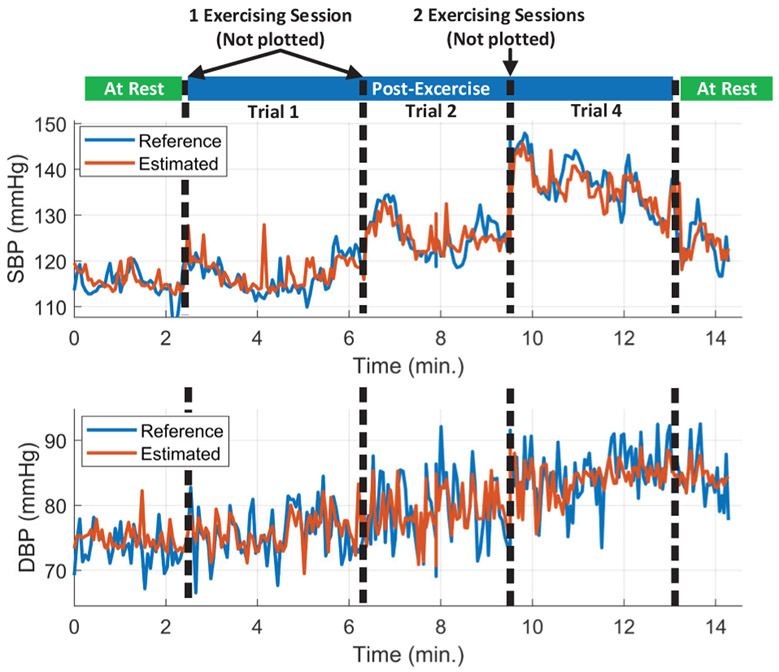
The performance of the DBP and SBP regression models is evaluated by taking the average of the correlation coefficient and RMSE of all the subjects as shown in TABLE III. Our regression models show excellent performance for BP estimation with average correlation coefficient and RMSE of 0.77 and 2.63 mmHg for the DBP and 0.86 and 3.44 mmHg for the SBP, respectively. The achieved performance from the AdaBoost regression model is much better than the maximum correlation coefficients of the individual features with BP, which is 0.16 and 0.22 for the area under the curve from DIA to IP points of Bio-Z2 with DBP and SBP respectively. The AdaBoost models are able to capture more complicated functions between these features to model BP effectively. In Fig. 16, we present the estimated SBP and DBP and the BP error for all BP samples from all subjects. Fig. 17. shows the long-term variation of SBP and DBP due to multiple exercising sessions by showing 15 minutes of data from subject 3 collected over 50 minutes by the concatenation of initial rest data, three post-exercise data trials (1,2 and 4) and final rest data after removing noisy data. The estimated SBP and DBP track the reference changes over wide BP range (from 110 to 150 mmHg for SBP and from 70 to 90 mmHg for DBP). The figure shows a sudden increase in BP after each 5-minute exercising session followed short-term recovery. This figure shows that BP increases in the long-term for 50 minutes due to successive exercising sessions.
TABLE III.
DBP and SBP estimation performance for each subject using AdaBoost
| Subject | DBP | SBP | ||
|---|---|---|---|---|
| R | RMSE (mmHg) |
R | RMSE (mmHg) |
|
| 1 | 0.86 | 2.25 | 0.86 | 2.86 |
| 2 | 0.83 | 3.29 | 0.92 | 3.84 |
| 3 | 0.78 | 2.01 | 0.91 | 2.54 |
| 4 | 0.83 | 2.46 | 0.92 | 2.5 |
| 5 | 0.79 | 3.69 | 0.89 | 4.78 |
| 6 | 0.59 | 3.25 | 0.81 | 4.64 |
| 7 | 0.77 | 2.67 | 0.83 | 3.93 |
| 8 | 0.76 | 2.38 | 0.82 | 3.37 |
| 9 | 0.7 | 2.16 | 0.77 | 2.69 |
| 10 | 0.83 | 2.18 | 0.85 | 3.22 |
| Average | 0.77±0.08 | 2.63±0.58 | 0.86±0.05 | 3.44±0.84 |
Fig. 16.
The estimated DBP and SBP and the error for all the subjects using AdaBoost model using the window-based features. [1]
Fig. 17.
The estimated and reference SBP and DBP of all valid data concatenated together for subject 3 (Initial rest, three post-exercise trial and final rest). The estimated SBP and DBP track the reference over wide range (from 110 to 150 mmHg for SBP and from 70 to 90 mmHg for DBP). BP was increased after each exercising session followed by short-term recovery. Trials 3 and 5 were removed because the data included some noisy heart beats from wrist movements.
C. Feature Importance Analysis
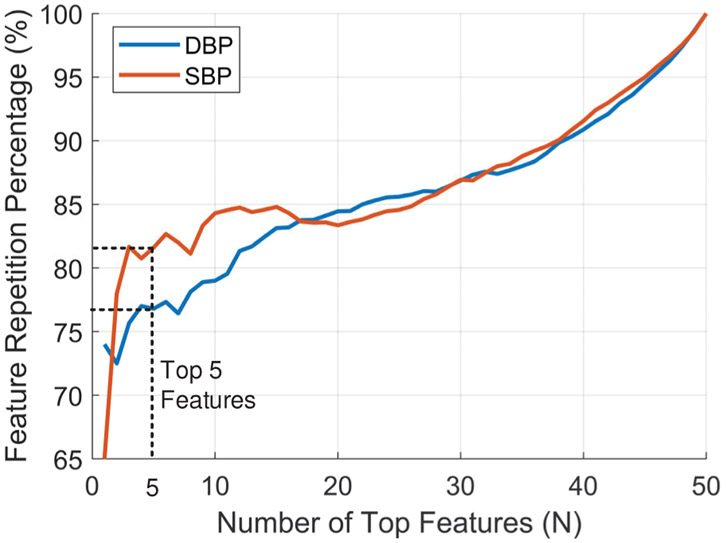
The feature importance score was calculated for each AdaBoost model for DBP and SBP for each subject by counting the times a feature was used to split a node, weighted by the number of samples it splits. We checked the detection of the right BP parameters for each AdaBoost model by measuring the consistency of feature ranking for the different training folds for each BP model. We calculated the percentage of the repetition of the top N important features in the top N rankings of the 10 folds used in model training. In Fig. 18, the average repetition percentage is plotted for all features with top 5 features are repeated on average of 77% for DBP and 82% for SBP.
Fig. 18.
Average repetition percentage of top N important features among the 10 training folds.
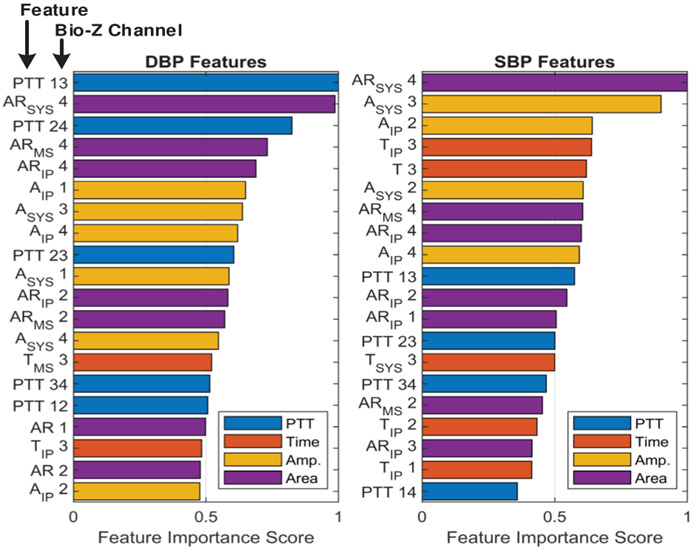
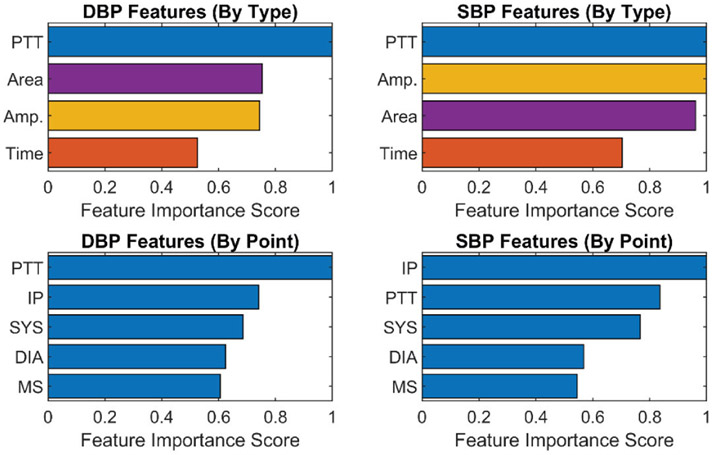
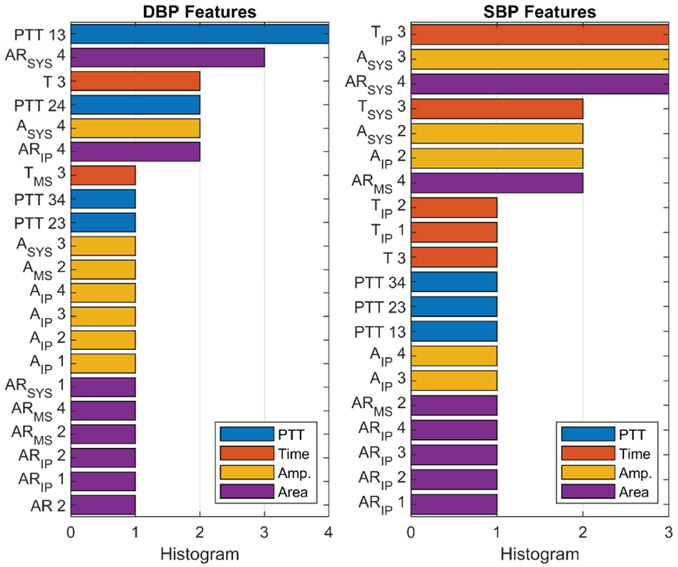
The top 20 important individual features for DBP and SBP are shown in Fig. 19, which were calculated from the average of their feature importance scores across all the subjects, while the most important features categorized by type and point for DBP and SBP are presented in Fig. 20. These figures show that the PTT features are the most important for DBP as previously shown in [31], while PTT, amplitude and area features are equally important features for SBP. In addition, PTT between the radial and ulnar arteries (PTT 13, 14, 23 and 24) are more important compared with PTT from a single artery (PTT 12 and PTT 34). This shows the importance of sensing the Bio-Z signals from both arteries to measure the time difference between the arrival of the pressure pulse to both arteries for more accurate BP estimation. We can also conclude from the feature importance categorized by points that the IP point is effective for BP estimation because it is the most important point for SBP and the second most important point for DBP. The features extracted from the IP point measure the amplitude and timing of the reflected pressure pulse through the arteries, which is highly correlated to BP [32].
Fig. 19.
The top 20 most important individual features of DBP and SBP for all subjects.
Fig. 20.
Feature importance for SBP and SBP categorized by feature type (top). Feature importance for SBP and SBP categorized by feature point (bottom).
D. Inter-subject Variability
The feature importance variation from one subject to another is shown in the histogram of the top 3 features of all subjects as illustrated in Fig. 21. The most frequent feature is repeated for only 4 subjects for DBP and for 3 subjects for SBP out of 10 subjects. This shows the large variations in the important wrist BP features among subjects, which is the motivation for using subject-specific models to capture these individual variations instead of one global model for all subjects to achieve accurate estimated BP values.
Fig. 21.
Histogram of top 3 individual features from all subjects.
E. Comparison with Different Regression Models and Previous Work
The BP estimation performance of the AdaBoost model is compared to other regression models such as Support Vector, Random Forest, Linear, Gradient Boosting and Decision Tree regression models as shown in Table IV. The AdaBoost model has the best performance compared to the other models. The linear model shows larger BP errors, which indicate that BP estimation from the used features is a non-linear problem that requires a non-linear model such as AdaBoost for more accurate results.
TABLE IV.
regression models comparison for DBP and SBP
| Regression Model | DBP | SBP | ||
|---|---|---|---|---|
| R | RMSE (mmHg) |
R | RMSE (mmHg) |
|
| AdaBoost | 0.77 | 2.6 | 0.86 | 3.5 |
| Support Vector | 0.76 | 2.7 | 0.83 | 3.8 |
| Random Forest | 0.73 | 2.7 | 0.72 | 4.2 |
| Linear | 0.66 | 3.3 | 0.76 | 4.5 |
| Gradient Boosting | 0.64 | 3.5 | 0.75 | 5.3 |
| Decision Tree | 0.62 | 3.5 | 0.68 | 5.1 |
The window-based features show significant improvement compared to the beat-to-beat features as shown in Table V which has a worse correlation coefficient and RMSE for both DBP and SBP compared to the window-based features. Since we have a limited number of around 280 window samples per subject, we shuffled the data before splitting it into training and testing to include BP samples from all trials in the training dataset. However, we also tested our models without shuffling the data to use consecutive samples in the training and testing our models. The RMSE increases for unshuffled data to 3.34 and 5.0 mmHg for DBP and SBP respectively, because the unshuffled data results in an increase in the difference between the BP values in the training and testing datasets. In our collected data, there is a variation of BP ranges from one trial to another because of the time duration between the trials, fatigue of the subject, removal of invalid data or other external factors. The measured average BP difference between closest pairs in the training and testing dataset is doubled from 0.08 mmHg for the shuffled data to 0.16 mmHg for the unshuffled data. In addition, the correlation between this BP difference and the measured BP error is 0.4 and 0.44 for DBP and SBP respectively. Therefore, the larger BP error measured from the unshuffled data is due to the larger BP difference between the BP values in training and testing datasets. This implies that the accuracy of BP estimation improves with larger training dataset that uniformly covers all BP ranges.
TABLE V.
DBP and SBP estimation performance compared with other work
| Work | DBP | SBP | ||||
|---|---|---|---|---|---|---|
| R | RMSE (mmHg) |
MAE (mmHg) |
R | RMSE (mmHg) |
MAE (mmHg) |
|
| Window-based Features | 0.77 | 2.63 | 1.95 | 0.86 | 3.44 | 2.51 |
| Beat-to-beat Features | 0.64 | 3.88 | 2.95 | 0.74 | 5.11 | 3.84 |
| Window-based Features (Unshuffled) | 0.5 | 3.34 | 2.59 | 0.62 | 5.0 | 3.74 |
| [10] | 0.57 | 3.52 | 4.31 | 0.54 | 5.45 | 8.21 |
| [11] | 0.79 | 2.2 | - | 0.85 | 3.1 | - |
| [18] | 0.84 | 7.47 | - | 0.81 | 5.17 | - |
In comparison with other prior investigations using PTT from ECG and PPG signals in Table V, our method offers better performance in all metrics compared to [9] and similar performance compared to [10]. In addition, the BP RMSE of our method is better by 4.9 mmHg for DBP and 1.7 mmHg for SBP compared to the previous work [18] that estimates BP from wrist Bio-Z.
We also investigated the BP estimation performance with a smaller number of sensors as shown in Table VI. The performance degrades when using two sensors only on the radial or the ulnar arteries compared to the full array of 4 sensors. Similarly, using two sensors is better than using only 1 sensor. This shows the importance of sensing the pressure pulse from multiple sensors from both wrist arteries for more accurate BP estimation.
TABLE VI.
The comparison of the BP error for different sensors
| Bio-Z Sensors Placement |
DBP | SBP | ||
|---|---|---|---|---|
| R | RMSE (mmHg) |
R | RMSE (mmHg) |
|
| Ulnar pair of sensors only | 0.73 | 2.8 | 0.82 | 3.8 |
| Radial pair of sensors only | 0.69 | 3.0 | 0.79 | 4.1 |
| Average of single sensor only | 0.65 | 3.1 | 0.75 | 4.4 |
VI. Discussion
The results of this pilot study presented in the previous section show that BP can be estimated from the wrist using features extracted from an array of bio-impedance sensors with a small error for both SBP and DBP. We can conclude that our approach that employed information from both arteries can improve the accuracy of BP estimation from the wrist, which helps in achieving an accurate wearable device for cuffless BP monitoring. However, these results were achieved under specific assumptions. First, the results were shown for 10 healthy subjects with a limited range of age for only post-exercise BP variations for one day. Our approach requires detailed validation with a larger number of subjects including hypertensive people for different blood pressure modulation mechanisms. In addition, the long-term validity of the developed BP models can be tested on different days with a new attachment of the electrodes, which was shown in a previous cuffless BP method [33]. Second, a unique model was trained for each subject to capture the individual variations of BP parameters from the wrist arteries for better BP estimation performance. However, calibration data is required to be measured from each user to build its unique model. Third, the location of the wrist arteries was detected by measuring the blood flow using an ultrasound Doppler device in order to place the sensors directly over the arteries which is not applicable to an easy-to-use wearable device. In addition, each time the user wears the wearable device, the sensors can be placed on a different location on the wrist which may be far from the arteries and could result in using a wrong model. Therefore, a method is required for automatic artery detection each time the user wears the device. Our future solution for this problem is to use a larger array of sensors that covers both arteries. Signals will be monitored from each sensor on the array and based on some specific metrics, the sensors close to the artery can be detected. Fourth, fixed posture with a specific position of the participant’s wrist on the bench was used during the whole data collection process. The change of posture and wrist position relative to the heart causes changes in the BP. These BP changes can be corrected using a motion sensor placed on the wrist to detect the height of the wrist relative to the heart and the posture through activity recognition methods. Finally, we used wet electrodes in the data collection, which have a large size and are not applicable for long-term usage because of the skin irritation and dryness of the gel over time. Using smaller dry metal electrodes solves this problem and helps in developing an array of electrodes on a small area of 5cm x 5cm which can fit in a wrist band as we proposed in [34]. However, dry electrodes may suffer from motion artifacts more than wet electrodes, which can cause signal corruption during wrist and body movements. However, studies showed that taking BP readings every 30 minutes is enough to predict cardiovascular disease. Therefore, a wrist-worn device with a motion sensor can detect when the wrist is at rest to start measuring the Bio-Z signals for a few seconds without motion artifacts, which is enough for accurate BP reading. In addition, sleeping time is more important than daytime for BP measurements, meanwhile it an excellent time to measure valid data without motion artifacts.
VII. Conclusion
In this paper, we presented a method for cuffless blood pressure monitoring from the wrist using an array of bio-impedance sensors. Two pairs of sensors were placed on the radial and ulnar arteries of the wrist to capture the vascular properties of the two arteries. We showed our low noise circuits for accurate bio-impedance sensing from the wrist. Systolic and diastolic blood pressure were measured using AdaBoost regression model based on different features extracted from the bio-impedance signals. In this pilot study, data was collected from 10 human subjects after exercising to evaluate the performance of our method for post-exercise BP variations. The results showed a large correlation coefficient and small root mean square error of 2.6 and 3.4 mmHg for diastolic and systolic blood pressure respectively. Leveraging window-based features and an array of sensors provided a smaller error compared to using sample-based features and a pair of sensors on only one artery. In this paper, we proposed a new method for continuous blood pressure measurement in a comfortable form factor such as smart watches, which can contribute to more effective monitoring and management of cardiovascular disease.
Fig. 4.
The PTT features measured between a pair of Bio-Z signals at all the characteristic points.
Fig. 5.
The time and amplitude features measured for a single Bio-Z signal from PK to the rest of points.
Fig. 6.
The time and amplitude features measured for a single Bio-Z signal from PK to the rest of points.
Acknowledgments
This work was supported in part by the National Institutes of Health, under grant 1R01EB028106-01 and National Science Foundation, under grant CNS-1734039. Any opinions, findings, conclusions, or recommendations expressed in this material are those of the authors and do not necessarily reflect the views of the funding organizations.
Biography

Bassem Ibrahim (S’12) is a Ph.D. student in Computer Engineering at Texas A&M University. He received his B.Sc. and M.Sc. degrees in Electrical Engineering from Ain Shams University, Cairo, Egypt in 2004 and 2012 respectively. His research interests include exploring new modalities for wearable physiological sensing as well as investigating machine learning and signal processing techniques to predict actionable information from physiological time-series data. He has 10 years of experience in the design of integrated circuits for sensors chips.

Roozbeh Jafari (SM’12) is an associate professor in Biomedical Engineering, Computer Science and Engineering and Electrical and Computer Engineering at Texas A&M University. He received his Ph.D. in Computer Science from UCLA and completed a postdoctoral fellowship at UC-Berkeley. His research interest lies in the area of wearable computer design and signal processing. His research has been funded by the NSF, NIH, DoD (TATRC), AFRL, AFOSR, DARPA, SRC and industry (Texas Instruments, Tektronix, Samsung & Telecom Italia). He has published over 170 papers in refereed journals and conferences. He has served as the general chair and technical program committee chair for several flagship conferences in the area of Wearable Computers. Dr. Jafari is the recipient of the NSF CAREER award (2012), IEEE Real-Time & Embedded Technology & Applications Symposium best paper award (2011), Andrew P. Sage best transactions paper award (2014), ACM Transactions on Embedded Computing Systems best paper award (2019), and the outstanding engineering contribution award from the College of Engineering at Texas A&M (2019). He is an associate editor for the IEEE Transactions on Biomedical Circuits and Systems, IEEE Sensors Journal, IEEE Internet of Things Journal, IEEE Journal of Biomedical and Health Informatics and ACM Transactions on Computing for Healthcare. He serves on scientific panels for funding agencies frequently and is presently serving as a standing member of the NIH Biomedical Computing and Health Informatics study section.
Contributor Information
Bassem Ibrahim, Department of Electrical and Computer Engineering at Texas A&M University, College Station, Texas, 77843, USA..
Roozbeh Jafari, Departments of Biomedical, Computer Science and Engineering, and Electrical Engineering at Texas A&M University, College Station, Texas, 77843, USA..
References
- [1].Ibrahim B and Jafari R, "Continuous Blood Pressure Monitoring using Wrist-worn Bio-impedance Sensors with Wet Electrodes," in 2018 IEEE Biomedical Circuits and Systems Conference (BioCAS), 2018, pp. 1–4. [DOI] [PMC free article] [PubMed] [Google Scholar]
- [2].Smith SC et al. , "Our time: a call to save preventable death from cardiovascular disease (heart disease and stroke)," Journal of the American College of Cardiology, vol. 60, no. 22, pp. 2343–2348, 2012. [DOI] [PubMed] [Google Scholar]
- [3].High T, "Blood pressure, systolic and diastolic, and cardiovascular risks," Arch Intern Med, vol. 153, pp. 598–615, 1993. [DOI] [PubMed] [Google Scholar]
- [4].Dolan E et al. , "Superiority of ambulatory over clinic blood pressure measurement in predicting mortality: the Dublin outcome study," Hypertension, vol. 46, no. 1, pp. 156–161, 2005. [DOI] [PubMed] [Google Scholar]
- [5].Ogedegbe G and Pickering T, "Principles and techniques of blood pressure measurement," Cardiology clinics, vol. 28, no. 4, pp. 571–586, 2010. [DOI] [PMC free article] [PubMed] [Google Scholar]
- [6].Vlachopoulos C, O'Rourke M, and Nichols WW, McDonald's blood flow in arteries: theoretical, experimental and clinical principles. CRC press, 2011. [Google Scholar]
- [7].Cho M. c., Kim JY, and Cho S, "A Bio-Impedance Measurement System for Portable Monitoring of Heart Rate and Pulse Wave Velocity Using Small Body Area," vol. 1, pp. 3106–3109, 2009. [Google Scholar]
- [8].Poon C and Zhang YT, "Cuff-less and noninvasive measurements of arterial blood pressure by pulse transit time," in Engineering in Medicine and Biology Society, 2005. IEEE-EMBS 2005. 27th Annual International Conference of the, 2006, pp. 5877–5880. [DOI] [PubMed] [Google Scholar]
- [9].Kachuee M, Kiani MM, Mohammadzade H, and Shabany M, "Cuffless Blood Pressure Estimation Algorithms for Continuous Health-Care Monitoring," IEEE Trans Biomed Eng, vol. 64, no. 4, pp. 859–869, April 2017, doi: 10.1109/TBME.2016.2580904. [DOI] [PubMed] [Google Scholar]
- [10].Miao F et al. , "A Novel Continuous Blood Pressure Estimation Approach Based on Data Mining Techniques," IEEE J Biomed Health Inform, April 28 2017, doi: 10.1109/JBHI.2017.2691715. [DOI] [PubMed] [Google Scholar]
- [11].Su P, Ding XR, Zhang YT, Liu J, Miao F, and Zhao N, "Long-term blood pressure prediction with deep recurrent neural networks," in Biomedical & Health Informatics (BHI), 2018 IEEE EMBS International Conference on, 2018, pp. 323–328. [Google Scholar]
- [12].Miao F, Liu Z, Liu J, Wen B, and Li Y, "Multi-sensor Fusion Approach for Cuff-less Blood Pressure Measurement," IEEE journal of biomedical and health informatics, 2019. [DOI] [PubMed] [Google Scholar]
- [13].Muehlsteff J, Aubert X, and Schuett M, "Cuffless estimation of systolic blood pressure for short effort bicycle tests: the prominent role of the pre-ejection period," in Engineering in Medicine and Biology Society, 2006. EMBS'06. 28th Annual International Conference of the IEEE, 2006, pp. 5088–5092. [DOI] [PubMed] [Google Scholar]
- [14].Thomas SS, Nathan V, Zong C, Soundarapandian K, Shi X, and Jafari R, "BioWatch: A Noninvasive Wrist-Based Blood Pressure Monitor That Incorporates Training Techniques for Posture and Subject Variability," IEEE Journal of Biomedical and Health Informatics, vol. 20, pp. 1291–1300, 2016, doi: 10.1109/JBHI.2015.2458779. [DOI] [PubMed] [Google Scholar]
- [15].Carek AM, Conant J, Joshi A, Kang H, and Inan OT, "SeismoWatch: Wearable Cuffless Blood Pressure Monitoring Using Pulse Transit Time," Proceedings of the ACM on Interactive, Mobile, Wearable and Ubiquitous Technologies, 2017. [DOI] [PMC free article] [PubMed] [Google Scholar]
- [16].Wang Y, Liu Z, and Ma S, "Cuff-less blood pressure measurement from dual-channel photoplethysmographic signals via peripheral pulse transit time with singular spectrum analysis," Physiological measurement, vol. 39, no. 2, p. 025010, 2018. [DOI] [PubMed] [Google Scholar]
- [17].Chandrasekhar A, Kim CS, Naji M, Natarajan K, Hahn JO, and Mukkamala R, "Smartphone-based blood pressure monitoring via the oscillometric finger-pressing method," Science translational medicine, vol. 10, no. 431, p. eaap8674, 2018. [DOI] [PMC free article] [PubMed] [Google Scholar]
- [18].Huynh TH, Jafari R, and Chung WY, "An Accurate Bioimpedance Measurement System for Blood Pressure Monitoring," Sensors (Basel, Switzerland), vol. 18, no. 7, 2018. [DOI] [PMC free article] [PubMed] [Google Scholar]
- [19].Liu J, Yan BP, Zhang Y-T, Ding X-R, Su P, and Zhao N, "Multi-wavelength photoplethysmography enabling continuous blood pressure measurement with compact wearable electronics," IEEE Transactions on Biomedical Engineering, vol. 66, no. 6, pp. 1514–1525, 2018. [DOI] [PubMed] [Google Scholar]
- [20].Luo N et al. , "Flexible piezoresistive sensor patch enabling ultralow power cuffless blood pressure measurement," Advanced Functional Materials, vol. 26, no. 8, pp. 1178–1187, 2016. [Google Scholar]
- [21].Wang C et al. , "Monitoring of the central blood pressure waveform via a conformal ultrasonic device," Nature biomedical engineering, vol. 2, no. 9, p. 687, 2018. [DOI] [PMC free article] [PubMed] [Google Scholar]
- [22].Kazanavicius E, Gircys R, Vrubliauskas A, and Lugin S, "Mathematical methods for determining the foot point of the arterial pulse wave and evaluation of proposed methods," Information Technology and control, vol. 34, no. 1, 2005. [Google Scholar]
- [23].Hughes D, Babbs CF, Geddes L, and Bourland J, "Measurements of Young's modulus of elasticity of the canine aorta with ultrasound," Ultrasonic Imaging, vol. 1, no. 4, pp. 356–367, 1979. [DOI] [PubMed] [Google Scholar]
- [24].Elengdi M, "On the analysis of fingertip photo plethysmogram signal," Current cardiology reviews, pp. 14–25, 2012.22845812 [Google Scholar]
- [25]."Medical electrical equipment, Part 1: General requirements for basic safety and essential performance, ANSI/AAMI ES60601-1:2005/A1:2012." ANSI/AAMI ES60601-1:2005/A1:2012. (accessed.
- [26].Finapres.com. "FMS Finapres Medical Systems. The Finapres NOVA has received 510(k) clearance from the US FDA!, 2017. " www.finapres.com. [Google Scholar]
- [27].Maver J, Strucl M, and Accetto R, "Autonomic nervous system activity in normotensive subjects with a family history of hypertension," Clinical Autonomic Research, vol. 14, no. 6, pp. 369–375, 2004. [DOI] [PubMed] [Google Scholar]
- [28].Timmers HJ, Karemaker JM, Wieling W, Marres HA, Folgering HT, and Lenders JW, "Baroreflex and chemoreflex function after bilateral carotid body tumor resection," Journal of hypertension, vol. 21, no. 3, pp. 591–599, 2003. [DOI] [PubMed] [Google Scholar]
- [29].Voss A, Schroeder R, Truebner S, Goernig M, Figulla HR, and Schirdewan A, "Comparison of nonlinear methods symbolic dynamics, detrended fluctuation, and Poincare plot analysis in risk stratification in patients with dilated cardiomyopathy," Chaos: An Interdisciplinary Journal of Nonlinear Science, vol. 17, no. 1, p. 015120, 2007. [DOI] [PubMed] [Google Scholar]
- [30].Ibrahim B, Akbari A, and Jafari R, "A novel method for pulse transit time estimation using wrist bio-impedance sensing based on a regression model," in Biomedical Circuits and Systems Conference (BioCAS), 2017 IEEE, 2017, pp. 1–4. [Google Scholar]
- [31].Mukkamala R et al. , "Toward ubiquitous blood pressure monitoring via pulse transit time: theory and practice," IEEE Transactions on Biomedical Engineering, vol. 62, no. 8, pp. 1879–1901, 2015. [DOI] [PMC free article] [PubMed] [Google Scholar]
- [32].Dawber TR, THomas HE Jr, and McNamara PM, "Characteristics of the dicrotic notch of the arterial pulse wave in coronary heart disease," Angiology, vol. 24, no. 4, pp. 244–255, 1973. [DOI] [PubMed] [Google Scholar]
- [33].Su P, Ding X-R, Zhang Y-T, Liu J, Miao F, and Zhao N, "Long-term blood pressure prediction with deep recurrent neural networks," in 2018 IEEE EMBS International Conference on Biomedical & Health Informatics (BHI), 2018: IEEE, pp. 323–328. [Google Scholar]
- [34].Ibrahim B, McMurray J, and Jafari R, "A Wrist-Worn Strap with an Array of Electrodes for Robust Physiological Sensing," in 2018 40th Annual International Conference of the IEEE Engineering in Medicine and Biology Society (EMBC), 2018, pp. 4313–4317. [DOI] [PMC free article] [PubMed] [Google Scholar]


