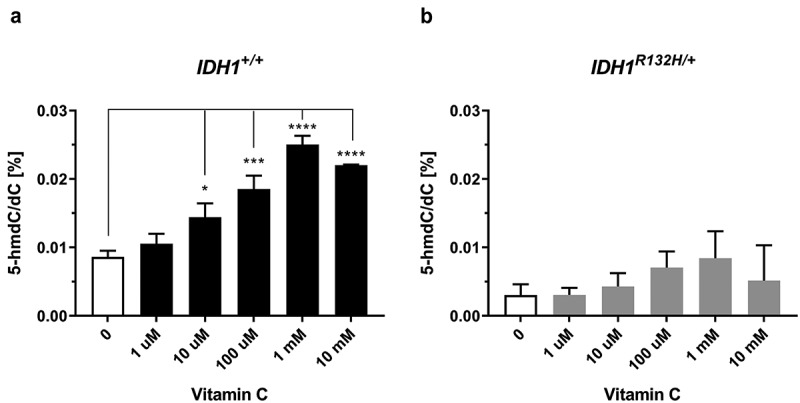
Figure 3.

Impact of VC on genomic 5-hmdC/dC levels in IDH1+/+ and IDH1R132H/+ cells.
(a,b) Quantification of 5-hmdC/dC levels in IDH1+/+ and IDH1R132H/+ treated for 48 h with increasing concentrations of VC as indicated (*p < 0.05, **p < 0.01, ***p < 0.001, ****p < 0.0001 – significant results; error bars = SD; n = 3).
