Abstract
Genome-wide screening of transcriptional changes among normal, cancer, and nodal metastases provides insights into the molecular basis of breast cancer (BC) progression and metastasis. To identify transcriptional changes and differentially expressed genes (DEGs) in the metastatic progression of BC and to determine the prognostic role of these DEGs in clinical outcome, we compared transcriptome profiling in matched normal, cancer, and lymph node metastatic tissues of 7 patients with estrogen receptor–positive, HER2-negative BC by using massive parallel RNA sequencing. The global profiles of gene expression in cancer and nodal metastases were highly correlated (r=0.962, P<0.001). In 6 (85.8%) patients, cancer and corresponding nodal metastases from the same patient clustered together. We identified 1522 and 664 DEGs between normal and cancer and between cancer and nodal metastases, respectively. The DEGs in normal versus cancer and cancer versus nodal metastases were significantly clustered in 1 and 8 Kyoto Encyclopedia of Genes and Genomes (KEGG) pathways, respectively. The chemokine signaling pathway was the most significant pathway in the cancer-to-nodal metastasis transition (false discovery rate=2.15E−13). The expression of 2 dysregulated RAC2 and PTGDS genes was confirmed by quantitative real-time polymerase chain reaction and immunohistochemistry. Interestingly, the lower RAC2 and PTGDS expression were associated with significantly worse disease-free survival in patients with BC. Our results show a high concordance of gene expression in BC and their nodal metastases, and identify DEGs associated with the metastatic progression of BC. The DEGs identified in this study represent novel biomarkers for predicting the prognosis of patients with BC.
Key Words: gene expression profile, RNA-Seq, lymph node metastasis, breast cancer
Breast cancer (BC) is the most common malignancy and one of the leading causes of cancer deaths among women in Korea.1 Axillary lymph node metastasis in patients with BC is a major risk factor associated with poor prognosis, including early relapse and short survival.2
Nodal metastasis involves a series of sequential processes and a systematic genome-wide approach of the metastatic process at the biological and molecular levels facilitates the development of new therapeutics to effectively target metastatic cancer and to discover prognostic biomarkers.3,4 Although most of the somatic mutations occur in cancer cells, it is known that phenotypic changes in the cancer microenvironment play an important role in the progression and metastasis of cancer.4 In this respect, comparison of global gene expression between primary BCs and their matched lymph node metastases may be the most direct and persuasive way to elucidate the molecular alterations associated with metastatic progression.
Whole-transcriptome analysis using microarrays has been used extensively to examine differential gene expression profiles that contribute to cancer initiation and metastatic progression by comparing primary cancers with normal tissues and by comparing primary cancers with their matched nodal metastases in BC.5–14 However, microarrays show limited sensitivity, low dynamic range, and cross-hybridization artifacts.15
With the development of next-generation sequencing techniques, RNA sequencing (RNA-Seq) analysis avoids the limitations of microarrays and provides a powerful way to determine the gene expression profiles with greater accuracy and higher efficiency.16,17 Despite using RNA-Seq to study cancer transcriptome, few studies have been performed with RNA-Seq to identify transcriptome dysregulation among normal, cancer, and nodal metastases of BC.
To identify molecular changes and differentially expressed genes (DEGs) in the metastatic progression of BC and to determine whether these genes have predictive power for clinical outcome, we generated comprehensive gene expression profiles of matched normal, cancer, and lymph node metastatic tissues from 7 patients with BC using RNA-Seq analysis. DEGs were determined by statistical analysis, and selected DEGs were further analyzed by quantitative real-time polymerase chain reaction (qRT-PCR) and their expression pattern tested by immunohistochemistry. DEGs were subsequently verified to serve as prognostic biomarkers for BC using a public BreastMark database.18 BC is a heterogenous disease and classified into 3 basic therapeutic groups: estrogen receptor (ER)–positive group, human epidermal growth factor 2 (HER2)-expressing group, and triple-negative group.19 To reduce background genetic variations between different subtypes, we focused our study on ER-positive, HER2-negative invasive carcinoma, no special type (NST).
MATERIALS AND METHODS
Breast Tissue Samples
Frozen and formalin-fixed paraffin-embedded samples, including primary cancer and matched adjacent normal and axillary lymph node metastatic tissues from patients with ER-positive and HER2-negative invasive carcinoma, NST was provided by Korea Biobank Network (07SA2015001-001). Before adding biological samples to biobank, informed consent was obtained from all patients. The study protocol was approved by the Institutional Review Board of the Chonnam National University Hwasun Hospital (CNUHH-2014-156). The resected specimen in a mirror-imaged manner was alternatively submitted for biobanking and for histologic assessment to evaluate the overall suitability of frozen banking tissues. Specimens for biobanking were immediately embedded in optimal cutting temperature compound medium (Scigen Scientific, Gardena, CA) and frozen in liquid nitrogen within 30 minutes of devascularization. Specimens were stored at a temperature below −196°C in a liquid nitrogen freezer. Specimens for histologic evaluation were fixed in 10% neutral buffered formalin and further processed into paraffin blocks. Tumor characteristics were obtained from histopathology reports. Evaluation of ER, progesterone receptor (PR) and HER2 expression was carried out by immunohistochemistry. Positive expression of ER or PR was defined as at least 1% positive staining of tumor nuclei.20 HER2+ status was defined as an immunohistochemical staining score of 3+ as per the American Society of Clinical Oncology/College of American Pathologists guidelines for HER2 immunohistochemistry.21 Cases with equivocal (2+) result for HER2 immunostaining were retested by silver in situ hybridization. The patients did not receive neoadjuvant treatment.
RNA Isolation and Sequencing
After obtaining sections for RNA isolation, 1 slide was stained with hematoxylin and eosin to determine the number of tumor cells. We select only samples without tumor cells in normal breast tissues and ≥70% tumor cells in cancers and lymph node metastases. Seven cases provided satisfactory material from matched normal, cancer, and lymph node metastatic tissues (Table 1). Only 1 of 7 cases was negative for PR. Total RNA was extracted from each tissue sample using RNeasy 96 Universal Tissue Kit (Qiagen, Gaithersburg, MD). We used 20 to 30 serial cryosections (15 μm thickness) of each tissue sample, which were sufficient to yield ≥10 μg of total RNA. Total RNA quality and quantity were verified with NanoDrop microvolume spectrophotometer (Thermo Scientific, Wilmington, DE) and Bioanalyzer 2100 (Agilent Technologies, Palo Alto, CA). RNA integrity number >8 represented the quality threshold for RNA-Seq.
TABLE 1.
Patients’ Characteristics
Libraries were prepared using the TruSeq RNA Library Prep Kit v2 (Illumina, San Diego, CA) according to the vendor’s instructions. Briefly, mRNA was purified from total RNA using poly-T oligo-attached magnetic beads, fragmented, and converted into single-strand cDNA. Sequencing adapters were ligated to the cDNA and the fragments were amplified by PCR. Paired-end reads of 101 bases were generated using a HiSeq 2000 platform (Illumina).
RNA-Seq Data Processing
The relevant expression levels were estimated by mapping the sequences to the human genome using TopHat (version 1.3.3), which uses Cufflinks software (version 1.2.1) under the default options.22,23 The reference genome sequence (hg19, Genome Reference Consortium GRCh37) and annotation data were obtained from the UCSC website (http://genome.uscs.edu). The transcript counts were calculated at the isoform and gene levels, and the relative transcript abundances were measured as fragments per kilobase of exon per million fragments mapped (FPKM) using Cufflinks.
We excluded transcripts with zeroed FPKM values, involving more than half of the total samples. We added 1 with FPKM value of the filtered transcript to facilitate log2 transformation. Filtered data were transformed logarithmically and normalized via quantile normalization. We calculated the Pearson correlation coefficient to compare the global gene expression in the samples. Hierarchical clustering analysis was performed by Gene Cluster 3.0 with default parameters, correlation (uncentered), and complete linkage.24 Each transcript was analyzed using paired t test to compare pairs of 3 groups (normal, cancer, and lymph node metastasis). We finally determined the significant DEGs by adjusting fold change ≥2 and paired t test raw P<0.05 for each compared pair.
Categorization of Genes by Expression Pattern During Metastatic Progression
The initial categorization was carried out depending on whether the gene was upregulated (fold change ≥2 and paired t test raw P<0.05), downregulated (fold change ≤−2 and paired t test raw P<0.05), or unchanged in cancer compared with adjacent normal tissues. A second categorization was based on whether the gene was upregulated (fold change ≥2 and paired t test raw P<0.05), downregulated (fold change ≤−2 and paired t test raw P<0.05), or unchanged when comparing lymph node metastasis with cancer. This entire process was assigned to 1 of 9 categories depending on the overall expression pattern.
Functional Enrichment Analysis of DEGs
We performed gene ontology (GO) and Kyoto Encyclopedia of Genes and Genomes (KEGG) enrichment analysis to explore the biological significance of the DEGs. This analysis was performed using the Database for Annotation, Visualization, and Integrated Discovery, which is a set of web-based functional annotation tool.25 The unique lists of DEGs and all the expressed genes (FPKM>0 in more than half cases for total samples) were submitted as the gene and background lists, respectively. A 5% cut-off of the false discovery rate (FDR) was used.
Validation of Candidate DEGs by qRT-PCR and Immunohistochemistry
qRT-PCR
To validate the RNA-Seq data, the 2 DEGs including dysregulated Rac family small GTPase 2 (RAC2) and prostaglandin D2 synthase (PTGDS) were reanalyzed by qRT-PCR, as previously described.26 We selected these 2 genes because their correlation with the prognosis of BC patients has not been well studied. The isolated RNA for RNA-Seq was used for qRT-PCR. Real-time PCR was performed using the Applied Biosystems (Foster City, CA). The following probes of TaqMan Gene Expression Assays (Thermo Fisher Scientific) were used: Hs00427439_g1 (RAC2), Hs00168748_m1 (PTGDS), and Hs02758991_g1 (glyceraldehyde 3-phosphate dehydrogenase, GAPDH). All experiments were performed in triplicate. For data analysis, the 2−ΔΔCt method was used and the value of 2-ΔΔCt indicated the fold change in gene expression normalized to GAPDH.
Immunohistochemical Analysis
Formalin-fixed paraffin-embedded samples comprising cancer, adjacent normal mammary, and metastatic lymph node tissues from the same 7 patients were used for immunohistochemical analysis. RAC2 and PTGDS immunohistochemical staining were conducted using a Bond-max automatic device (Leica Microsystems, Bannockburn, IL) as previously described.27 Rabbit polyclonal antibodies to RAC2 (1:50 dilution, SIGMA Life Science, St. Louis, MO) and PTGDS (1:50 dilution, Novus Biologicals, Littleton, CO) were used. Immunostaining for RAC2 and PTGDS was scored using the Allred scoring system,28 based on the estimated proportion of positive staining and intensity of positive cells. The Allred score represents the sum of the staining intensity score (0 for no staining, 1 for light staining, 2 for moderate staining, and 3 for strong staining) and the percentage score of immunostained cells (0, none; 1, ≤1; 2, 1% to 10%; 3, 11% to 33%; 4, 34% to 66%; and 5, ≥67%).
Identification of Candidate DEGs as Prognostic Biomarkers
RAC2 and PTGDS were analyzed further to test their prognostic significance in patients with BC. We used a BreastMark database. This online database integrates gene expression and survival data from 26 data sets on 12 different microarray platforms corresponding to ∼17,000 genes in up to 4738 samples.18 Disease-free survival (DFS) was analyzed, and the median expression was used to dichotomize the data. DFS was analyzed for BC as a whole, lymph node–positive and lymph node–negative BC, and across molecular subtypes based on Pam50 classifier, luminal A, luminal B, HER2, and basal types. Survival curves were determined by Kaplan-Meier estimates and differences in survival were compared using the log-rank test. Hazard ratios (HR) with 95% confidence intervals were computed using the Cox’s regression analysis.
RESULTS
Characterization of Sequencing and Mapping
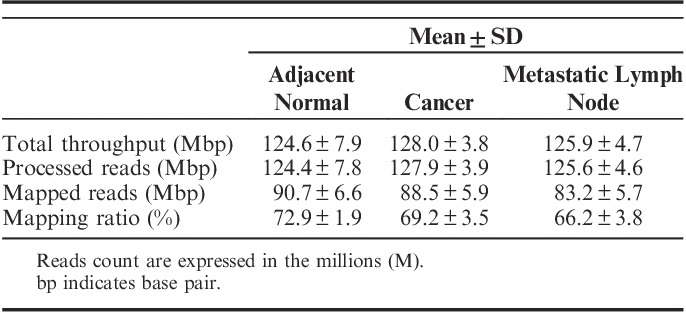
Three samples per patient were subjected to massively parallel paired-end mRNA sequencing. Finally, we obtained 124.6, 128.0, and 125.9 million sequencing reads in the adjacent normal, cancer, and metastatic lymph node tissues, respectively. The uniquely aligned reads for the 3 sets ranged from 83.2 to 90.7 million reads. The proportion of reads that mapped to the reference genes ranged from 66.2% to 72.9% for the 3 sets. The details of the mapping results are shown in Table 2.
TABLE 2.
RNA Sequencing Results
Genes Expression Profiling
The normalized expression level of each gene was measured by FPKM. On the basis of the FPKM>0 in more than half of the 21 samples, we totally detected 20,112 expressed genes, which included a majority of the annotated human reference genes. We explored the correlation of the global gene expression. The correlation coefficients (r) of gene expression between normal and cancer tissues and between cancer and nodal metastatic tissues were 0.929 and 0.962, respectively (Fig. 1). The global profiles of gene expression between normal and cancer samples and between cancer and metastatic samples were highly correlated (P<0.001 in both).
FIGURE 1.
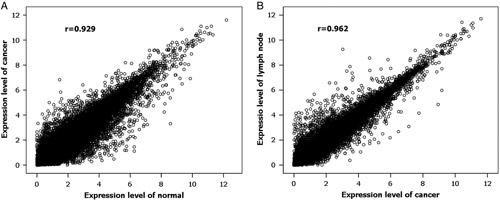
Scatter plot of global expression in normal and cancer tissues (A) and primary cancer and lymph node metastasis (B). The global profiles of gene expression are generally highly correlated and the Pearson correlation coefficient is shown.
An unsupervised hierarchical clustering map among normal, cancer, and metastatic lymph node tissues was generated utilizing 20,112 expressed genes (Fig. 2). Normal breast samples were clustered together and were relatively well separated from cancer and metastatic samples, except in 1 case. One outlier normal breast tissue was clustered next to corresponding cancer. In 6 (85.8%) patients, primary cancer and corresponding nodal metastasis from the same patient clustered together, suggesting that lymph node metastasis express a highly similar set of genes as the corresponding cancer.
FIGURE 2.
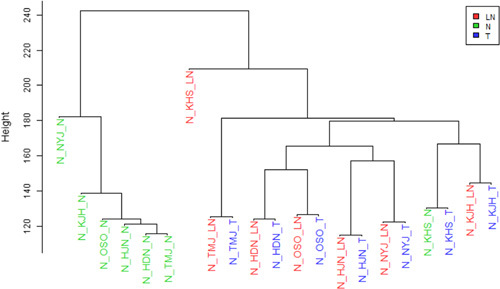
Unsupervised hierarchical clustering of gene expression profiles in the 3 tissue groups. Normal breast tissues clustered in pairs except for one. Tight side-by-side clustering of carcinoma-LNs pairs was seen in 6 of 7 patients. LN indicates lymph node metastasis; N, normal breast; T, cancer.
Analysis of DEGs
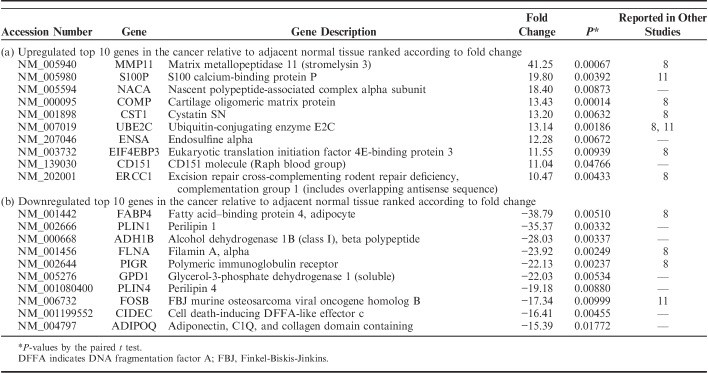
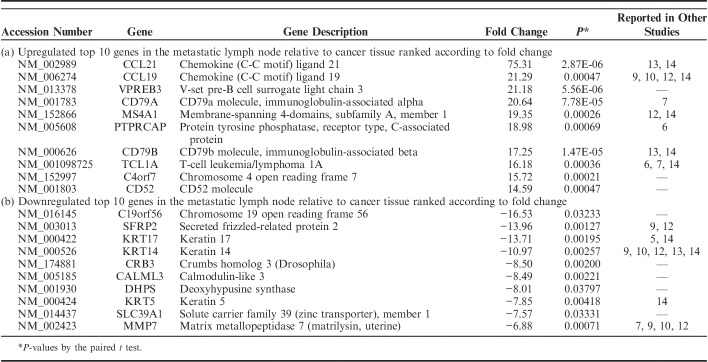
We identified the DEGs among matched normal, cancer, and lymph node metastatic tissue samples using the Cuffdiff approach and detected 2186 DEGs, which were satisfied with fold change ≥2 and P<0.05 in at least 1 of the 2 compared pairs, normal and cancer, and cancer and lymph node metastasis. Of 2186 DEGs, 1522 DEGs were detected in the comparison between cancer and adjacent normal tissues. A total of 611 genes were found upregulated and 911 genes were downregulated in cancer relative to adjacent normal tissues. In total, 664 DEGs between cancer and metastatic lymph node tissues were identified, consisting of 461 upregulated genes and 203 downregulated genes in lymph node metastasis relative to corresponding cancer. The top 10 upregulated and downregulated DEGs, ranked by fold change along with their P-values between the normal and cancer tissues and between the cancer and metastatic lymph node tissues are summarized in Tables 3 and 4, respectively.
TABLE 3.
Top 10 Lists of Differentially Expressed Genes Between Cancer and Adjacent Normal Tissues
TABLE 4.
Top 10 Lists of Differentially Expressed Genes Between Metastatic Lymph Node and Cancer Tissues
Gene expression variability during progression from normal tissue to cancer and subsequently to metastatic node of BC was evaluated, by considering the number of genes upregulated or downregulated (fold change ≥2 and P<0.05) or unchanged in the normal versus cancer and in the cancer versus metastasis comparisons. Figure 3 shows that most variation in expression occurred in the normal versus cancer comparison, displaying 2 alternative patterns of gene expression variation in the progression: (1) genes upregulated or downregulated in normal versus cancer and basically stable in cancer versus metastasis (Fig. 3, left), and (2) genes unchanged in normal versus cancer and modulated in cancer versus metastasis (Fig. 3, right). The large majority of DEGs with varied expression in the normal versus cancer comparison remain stable during metastasis (1414 genes of 1522, 92.9%). In total, 556 of 664 (83.7%) DEGs modulated in the cancer versus metastasis comparison are invariant in the normal versus cancer comparison.
FIGURE 3.
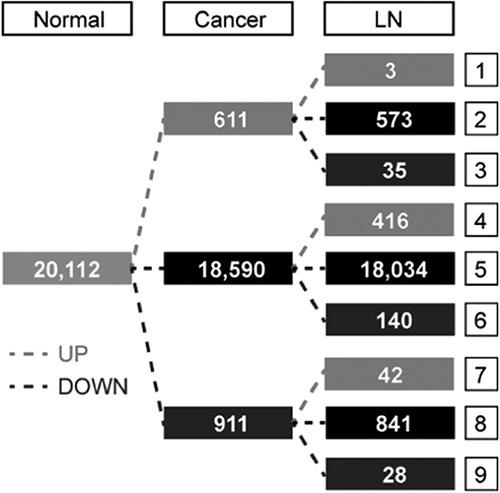
Variation in gene expression during progression from normal tissue to cancer and subsequently to LN. LN indicates lymph node metastasis.
Genes associated with tumorigenesis (normal-cancer transition) and metastasis (cancer-metastasis transition), were identified by a Venn diagram comparison. Gene list “A” includes DEGs in the normal and cancer tissues, and gene list “B” represents DEGs in the primary cancer and nodal metastasis groups. When the 2 gene lists were considered, 3 distinct patterns were found: only A (1414 genes), A and B (108 genes), and only B (556 genes) (Fig. 4). Genes in the A category represent DEGs associated with tumorigenesis, whereas genes in the B category represent DEGs associated with lymph node metastasis. Genes in both A and B categories represent DEGs associated with both tumorigenesis and lymph node metastasis in BC.
FIGURE 4.
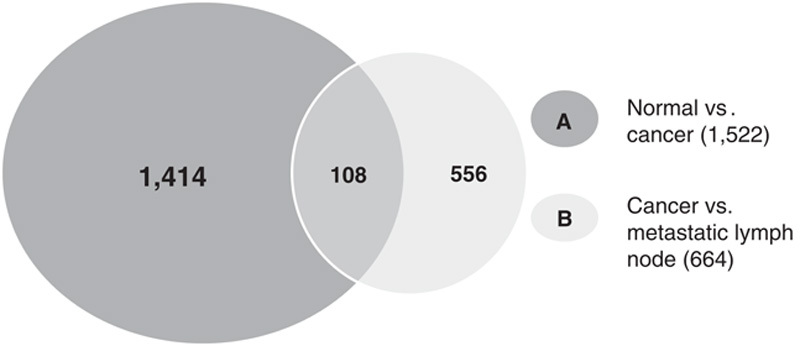
Venn diagram illustrating the overlap of differentially expressed genes between normal, cancer, and lymph node metastasis samples.
Functional Enrichment Analysis of DEGs
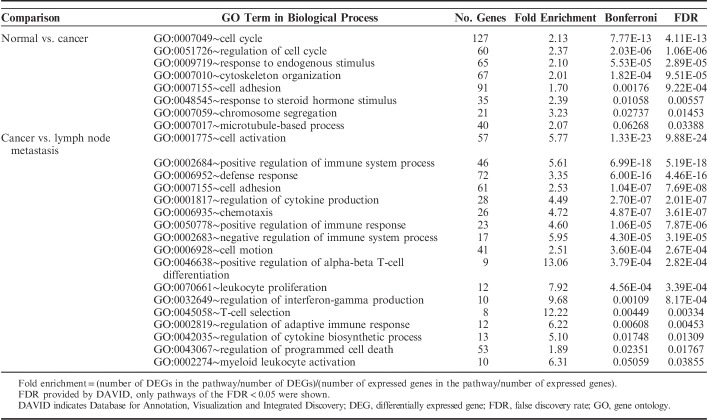
To obtain a more comprehensive insight into the biological function of DEGs, a GO analysis was performed. GO categories are divided into 3 groups: biological process, cellular component, and molecular function. The present study considered the only biological process. Using a threshold of FDR<0.05, we found that all DEGs in normal versus cancer and in primary cancer versus lymph node metastasis were categorized into 8 and 13 functional categories, respectively (Table 5). In these GO categories cell adhesion was the predominant signature in both normal versus cancer and cancer versus lymph node metastasis. Gene sets associated with the immune system carried the dominant signature of cancer versus lymph node metastasis.
TABLE 5.
Enriched GO Categories of DEGs
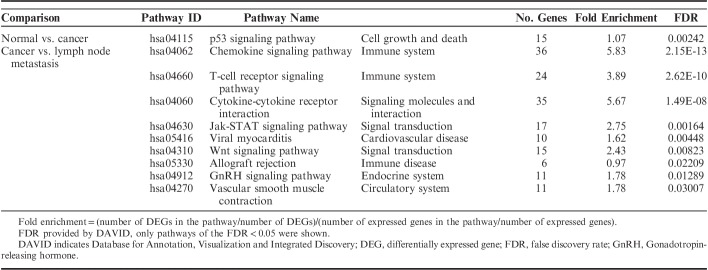
To understand the functional pathway of DEGs, the KEGG pathway was performed. With the threshold of FDR<0.05, we found that all DEGs between normal versus cancer and cancer versus lymph node metastasis were significantly clustered in 1 and 8 KEGG pathways, respectively (Table 6). The p53 signaling pathway was the only significant pathway in normal-to-cancer transition (FDR=0.00242). The chemokine signaling pathway was the most significant pathway in the cancer-to-metastasis transition (FDR=2.15E-13).
TABLE 6.
Kyoto Encyclopedia of Genes and Genomes Pathway of Enriched DEGs
Validation of Candidate DEGs by qRT-PCR and Immunohistochemistry
To validate the reliability of RNA-Seq data, we confirmed our data at the level of mRNA and protein. First, we selected 2 genes, RAC2 and PTGDS to measure their expression levels by qRT-PCR. RAC2 gene belonged to category 4, which was unchanged in cancer compared with corresponding normal tissues, and subsequently upregulated when comparing metastatic lymph node with corresponding cancer tissues. PTGDS belonged to category 7, which was downregulated in cancer compared with corresponding normal tissues, and subsequently upregulated when metastatic lymph node was compared with corresponding cancer tissues. We used the unamplified total RNA (from the same batch used for RNA-Seq) as the template. Overall, the results for each of these 2 genes were broadly consistent between the 2 different techniques (Fig. 5). In accordance with RNA-Seq data, these 2 genes were upregulated in metastatic lymph node compared with primary cancer tissues (P<0.05 and <0.05, respectively).
FIGURE 5.
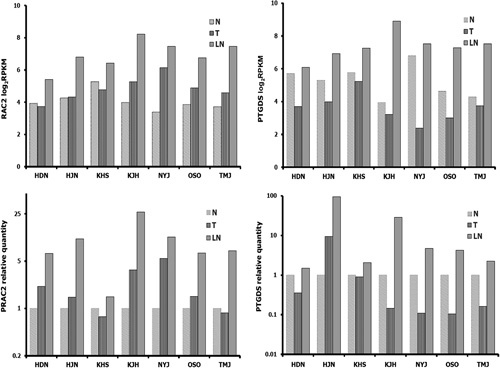
In accordance with RNA-Seq data, mRNA expression of RAC2 and PTGDS by quantitative real-time PCR was upregulated in LNs compared with primary cancers. LN indicates lymph node metastasis; N, normal breast; PCR, polymerase chain reaction; T, cancer.
To confirm our data at the protein level, we performed immunohistochemical analysis of RAC2 and PTGDS (Fig. 6). RAC2 and PTGDS were expressed in the nuclei of epithelial and myoepithelial cells of normal breast and carcinoma cells in primary tumors and metastatic lymph nodes. In metastatic lymph nodes, lymphoid cells also tested positive to RAC2 and PTGDS. Allred scores of RAC2 and PTGDS were higher in metastatic lymph nodes than in corresponding cancer tissues (P<0.01 and <0.05, respectively) (Fig. 7). These results are quite consistent with those of RNA-Seq and qRT-PCR. However, Allred scores of RAC2 and PTGDS between normal and cancer tissues were not different.
FIGURE 6.
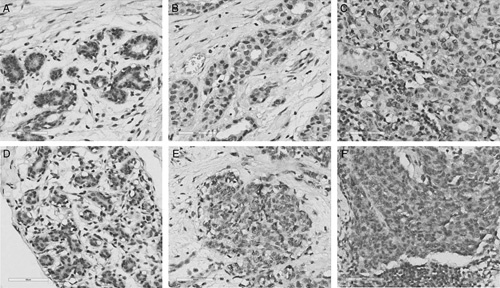
Representative immunostaining patterns of RAC2 and PTGDS in normal epithelium of the breast (A, D), corresponding carcinoma (B, E), and metastatic lymph node (C, F) (A–C, RAC2; D–F, PTGDS) (×400, scale bars; 60 μm).
FIGURE 7.
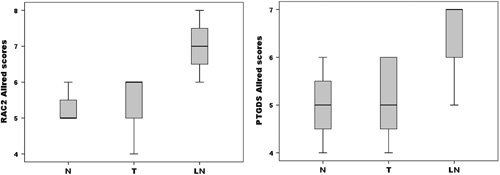
Distribution of Allred scores for RAC2 and PTGDS in normal breast tissues, corresponding carcinoma, and LN. The ends of the box represent the 25th and 75th percentiles; the bars indicate the 10th and 90th percentiles, and a horizontal line inside the box shows the median. LN indicates lymph node metastasis; N, normal breast; T, cancer.
Candidate DEGs for Prognostic Biomarkers
RAC2 and PTGDS were tested using a BreastMark. Lower RAC2 expression in BC was significantly associated with poor DFS in the overall group (HR=0.858, P=0.01055, n=2652), lymph node–negative group (HR=0.773, P=0.01611, n=1183), luminal B subtype (HR=0.781, P=0.00703, n=1103), and basal subtype (HR=0.699, P=0.00860, n=424) (Fig. 8). Lower PTGDS expression in BC was significantly associated with poor DFS in the overall group (HR=0.843, P=0.00619, n=2543), HER2 subtype (HR=0.673, P=0.02277, n=275), and basal subtype (HR=0.735, P=0.03091, n=406) (Fig. 9).
FIGURE 8.
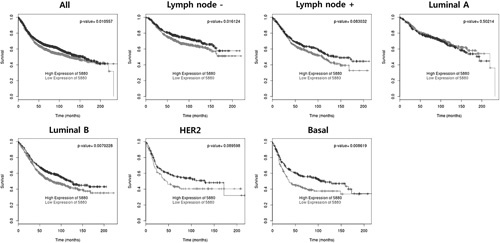
Overall survival analysis based on RAC2 expression.
FIGURE 9.
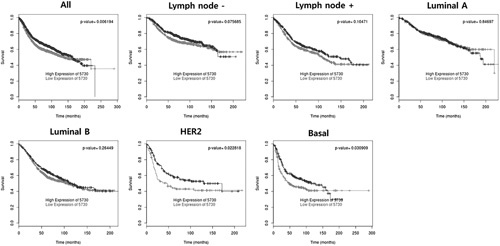
Overall survival analysis based on PTGDS expression.
DISCUSSION
In this study, we generated comprehensive transcriptome profiles of matched normal, cancer, and nodal metastatic tissues using RNA-Seq, to identify the molecular changes and DEGs in the metastatic progression of BC. Our results revealed a high concordance of gene expression between primary cancer and corresponding nodal metastasis. We were also able to identify DEGs in association with BC initiation and metastatic progression. Among DEGs, a lower level of RAC2 and PTGDS expression was significantly associated with worse prognosis in patients with BC.
Lymph node metastasis is a major risk factor for prognosis in patients with BC.2 Lymph node metastasis is a multistep process, comprising various dynamic changes in the genome.3,4 To develop new therapeutics that effectively target metastatic cancer and to discover predictive biomarkers for metastatic progression, it is apparent that a systematic genome-wide approach of the global gene expression changes during malignant transformation and metastatic progression is needed. In BC, several groups have analyzed the expression profiles contributing to malignant transformation from normal to cancer in addition to nodal metastatic progression by comparing the gene expression profiles from primary cancers with normal tissues and from primary cancers with metastatic tissues.5–14
Most of the studies in BC were conducted to identify the altered gene expression during BC initiation and nodal metastasis separately.5,7–14 It is more reasonable to compare the concomitant changes in gene expression during progression from normal tissue to BC and subsequent metastasis to the lymph node. We generated comprehensive gene expression profiles of normal, cancer, and nodal metastatic tissues. Furthermore, to reduce the background noise from genetic variations among unrelated patients, we used matched samples from the same patients. BC is a heterogenous disease and categorized into 3 basic therapeutic groups.19 To reduce the background genetic variation between different subtypes, we focused our study on ER-positive, HER2-negative, and luminal BC.
Laser capture microdissection has been used to reduce contamination in a few studies6,8,13 compared with other studies using bulk tissues because they better reflect the wider context of metastasis.5,7,9–12,14 We used whole cancer tissues in BC and lymph node metastasis. Although great care was adopted to eliminate the stromal cells and host immune cells from cancer tissues to the extent possible, it is important to recognize that cancers are complex mixtures of tissues including host cell populations and the complex gene profiles of the individual components may contribute significantly to cancer behavior.4
Until now microarrays have been extensively used.5–14 Although miroarrays facilitate high-throughput analysis of thousands of genes and provide valuable insights into whole-transcriptome analysis, the limitations include limited sensitivity, low dynamic range, and cross-hybridization artifacts.15 RNA-Seq has greater sensitivity and higher dynamic range than microarray analysis.16,17 Despite the role of RNA-Seq in BC transcriptome analysis,29,30 RNA-Seq data for normal, primary cancer, and nodal metastases of BC are limited.
In the current study, we initially performed RNA-Seq analysis of 7 paired samples. The RNA‑Seq analysis acquired ∼126 million reads, which is adequate for transcriptome sequencing.31 The genome map rate of sequencing reads was ∼73%. To validate the RNA-Seq data, qRT-PCR and immunohistochemical analysis were performed. Although we only tested 2 genes, our RNA-Seq, qRT-PCR, and immunohistochemistry of RAC2 and PTGDS revealed similar trends. Overall, these results showed that the data obtained by RNA-Seq adequately reflected the status of the original RNA, and confirmed the reliability of our RNA-Seq data.
Different hypotheses have been proposed to elucidate the mechanism of nodal metastasis. By directly comparing DEGs between primary cancers and their matched lymph node metastases using microarray analyses, Weigelt et al7 reported that the overall gene expression patterns of lymph node metastases were similar to the corresponding primary tumors, and few unique genetic alterations were identified. These data support the “ab initio” hypothesis that the metastatic potential is encoded in the bulk of a primary cancer.32 If subpopulations of cells in the primary cancer acquire high metastatic phenotype and metastasize to a lymph node, it results in a greater degree of difference in gene expression profiles between primary tumors and metastases. Most recent studies have shown that although at the transcriptome level, lymph node metastases in BC were similar to the corresponding primary cancer, distinct DEGs were found between primary BC and their lymph node metastases.5,6,8–14 These findings have led to the hypothesis that while BC might be imprinted ab initio with a nodal metastatic ability, the actual acquisition of the nodal metastatic phenotype might depend on additional genetic changes.
In the present study, we directly compared the altered gene expression from primary BC with the expression in the matched normal breast and axillary lymph node metastases. The global profiles of comparative gene expression in normal and cancer samples were highly correlated with the expression in cancer and metastatic samples. As previously reported,7,9,12,13 the unsupervised hierarchical clustering revealed that 6 of 7 lymph node metastases clustered together with the corresponding primary BC, showing a high degree of concordance in gene expression between BC and its lymph node metastases. These results suggest that the overall features of gene expression remain conserved between primary BC and matched lymph node metastasis.
In this study, normal breast samples were clustered together and were relatively well separated from cancer and metastasis samples, except in one case, which showed clustering of normal sample next to corresponding BC. Although we used a single slide for hematoxylin and eosin stain and confirmed absence of cancer cells in the surrounding normal breast tissues, it increased the risk of contamination of cancer cells in the serial cryosections of normal breast tissues for RNA isolation.
In addition, we also detected 2186 DEGs between normal and cancer, and cancer and lymph node metastasis. A comparative analysis of the lists of DEGs published by other studies with our top 10 lists revealed several partial overlaps in identity. Among the top 10 upregulated and downregulated DEGs between the normal and cancer tissues and between the cancer and metastatic lymph node tissues, 11 and 12 genes overlapped to the previous studies, respectively. The discrepancy among DEGs lists can be attributed to various external factors, including different analytical approaches, study design, and use of small sample sizes.13
Among these DEGs, 1414 genes were only associated with cancer initiation (normal-to-cancer transition), whereas 556 genes were only associated with cancer-to-metastasis transition; 108 genes were associated with both normal-to-cancer transition, and cancer-to-metastasis transition. On the basis of the above results, it is possible to conclude that occasionally the genes activated early in tumorigenesis may eventually contribute to lymph node metastasis, whereas in other cases, acquisition of additional genetic alterations may be necessary for nodal metastatic phenotype.
GO analysis of all DEGs revealed that cell adhesion was the predominant signature in normal versus cancer and cancer versus lymph node metastasis. Gene sets associated with the immune system represented the dominant signature in cancer versus lymph node metastasis. KEGG pathway analysis showed that all DEGs between normal versus cancer were enriched for p53 signaling pathway related to cell growth and death. The chemokine signaling pathway related to immune system was the most significant pathway in the cancer-to-metastasis transition. These significant GO categories and KEGG pathway found in this study were implicated in tumor progression and nodal metastasis in previous studies.7–9,13,14
In the DEGs identified in our study, RAC2 and PTGDS were subsequently verified as prognostic biomarkers for BC using a public BreastMark database. Interestingly, the lower levels of RAC2 and PTGDS expression in BC correlated with poor prognosis. RAC2 is a member of the Ras superfamily of small GTP-metabolizing proteins. It has been reported that RAC2 might have a pivotal role in the regulation of actin cytoskeleton during BC metastasis33 and its downregulation has been associated with invasive and metastatic competence in human cancer.34 In addition, reduced RAC2 protein expression was significantly associated with distant metastasis-free survival of patients with triple-negative BC, which supports our findings.35 PTGDS catalyzes the conversion of prostaglandin H2 to prostaglandin D2. PTGDS induces apoptosis and inhibits cell proliferation and migration in multiple cell types.36,37 Furthermore, loss of PTGDs has been associated with malignant progression of astrocytomas and was predictive of poor survival.36
There are obvious limitations when examining a limited number of cases. Nonetheless, this study is one of the most comprehensive RNA-Seq studies using individually matched samples (normal breast, BC, and nodal metastasis). Whether our DEGs contribute to tumorigenesis and metastatic progression of BC, not only in ER-positive, HER2-negative luminal subtype but in other molecular subtypes as well, warrants further study.
In summary, analysis of gene expression profiles by RNA-Seq analysis in BC and their matching normal and lymph node metastatic tissues provides useful information elucidating the mechanism underlying carcinogenesis and lymph node metastasis of BC, not only revealing the role of DEGs in progression of BC, but also providing information for identification of novel prognostic markers.
Footnotes
Supported by a grant (HCRI17906-1) Chonnam National University Hwasun Hospital Institute for Biomedical Science.
Presented in part at the 2018 USCAP Annual Meeting, March 17 to 23, 2018, Vancouver.
The authors declare no conflict of interest.
REFERENCES
- 1.Park EH, Min SY, Kim Z, et al. Basic facts of breast cancer in Korea in 2014: the 10-year overall survival progress. J Breast Cancer. 2017;20:1–11. [DOI] [PMC free article] [PubMed] [Google Scholar]
- 2.Eifel P, Axelson JA, Costa J, et al. National Institutes of Health Consensus Development Conference Statement: adjuvant therapy for breast cancer, November 1-3, 2000. J Natl Cancer Inst. 2001;93:979–989. [DOI] [PubMed] [Google Scholar]
- 3.Liu X, Kolokythas A, Wang J, et al. Gene expression signatures of lymph node metastasis in oral cancer: molecular characteristics and clinical significances. Curr Cancer Ther Rev. 2010;6:294–307. [DOI] [PMC free article] [PubMed] [Google Scholar]
- 4.Ikemura S, Aramaki N, Fujii S, et al. Changes in the tumor microenvironment during lymphatic metastasis of lung squamous cell carcinoma. Cancer Sci. 2017;108:136–142. [DOI] [PMC free article] [PubMed] [Google Scholar]
- 5.Hao X, Sun B, Hu L, et al. Differential gene and protein expression in primary breast malignancies and their lymph node metastases as revealed by combined cDNA microarray and tissue microarray analysis. Cancer. 2004;100:1110–1122. [DOI] [PubMed] [Google Scholar]
- 6.Mimori K, Kataoka A, Yoshinaga K, et al. Identification of molecular markers for metastasis-related genes in primary breast cancer cells. Clin Exp Metastasis. 2005;22:59–67. [DOI] [PubMed] [Google Scholar]
- 7.Weigelt B, Wessels LF, Bosma AJ, et al. No common denominator for breast cancer lymph node metastasis. Br J Cancer. 2005;93:924–932. [DOI] [PMC free article] [PubMed] [Google Scholar]
- 8.Grigoriadis A, Mackay A, Reis-Filho JS, et al. Establishment of the epithelial-specific transcriptome of normal and malignant human breast cells based on MPSS and array expression data. Breast Cancer Res. 2006;8:R56. [DOI] [PMC free article] [PubMed] [Google Scholar]
- 9.Feng Y, Sun B, Li X, et al. Differentially expressed genes between primary cancer and paired lymph node metastases predict clinical outcome of node-positive breast cancer patients. Breast Cancer Res Treat. 2007;103:319–329. [DOI] [PubMed] [Google Scholar]
- 10.Suzuki M, Tarin D. Gene expression profiling of human lymph node metastases and matched primary breast carcinomas: clinical implications. Mol Oncol. 2007;1:172–180. [DOI] [PMC free article] [PubMed] [Google Scholar]
- 11.Gur-Dedeoglu B, Konu O, Kir S, et al. A resampling-based meta-analysis for detection of differential gene expression in breast cancer. BMC Cancer. 2008;8:396. [DOI] [PMC free article] [PubMed] [Google Scholar]
- 12.Vecchi M, Confalonieri S, Nuciforo P, et al. Breast cancer metastases are molecularly distinct from their primary tumors. Oncogene. 2008;27:2148–2158. [DOI] [PubMed] [Google Scholar]
- 13.Ellsworth RE, Seebach J, Field LA, et al. A gene expression signature that defines breast cancer metastases. Clin Exp Metastasis. 2009;26:205–213. [DOI] [PubMed] [Google Scholar]
- 14.Reyngold M, Turcan S, Giri D, et al. Remodeling of the methylation landscape in breast cancer metastasis. PLoS One. 2014;9:e103896; 2119. [DOI] [PMC free article] [PubMed] [Google Scholar]
- 15.Han SS, Kim WJ, Hong Y, et al. RNA sequencing identifies novel markers of non-small cell lung cancer. Lung Cancer. 2014;84:229–235. [DOI] [PubMed] [Google Scholar]
- 16.Wang Z, Gerstein M, Snyder M. RNA-Seq: a revolutionary tool for transcriptomics. Nat Rev Genet. 2009;10:57–63. [DOI] [PMC free article] [PubMed] [Google Scholar]
- 17.Oshlack A, Robinson MD, Young MD. From RNA-seq reads to differential expression results. Genome Biol. 2010;11:220. [DOI] [PMC free article] [PubMed] [Google Scholar]
- 18.Madden SF, Clarke C, Gaule P, et al. BreastMark: an integrated approach to mining publicly available transcriptomic datasets relating to breast cancer outcome. Breast Cancer Res. 2013;15:R52. [DOI] [PMC free article] [PubMed] [Google Scholar]
- 19.Weigelt B, Reis-Filho JS. Histological and molecular types of breast cancer: is there a unifying taxonomy? Nat Rev Clin Oncol. 2009;6:718–730. [DOI] [PubMed] [Google Scholar]
- 20.Hammond ME, Hayes DF, Dowsett M, et al. American Society of Clinical Oncology/College of American Pathologists guideline recommendations for immunohistochemical testing of estrogen and progesterone receptors in breast cancer. Arch Pathol Lab Med. 2010;134:907–922. [DOI] [PMC free article] [PubMed] [Google Scholar]
- 21.Wolff AC, Hammond ME, Schwartz JN, et al. American Society of Clinical Oncology/College of American Pathologists guideline recommendations for human epidermal growth factor receptor 2 testing in breast cancer. J Clin Oncol. 2007;25:118–145. [DOI] [PubMed] [Google Scholar]
- 22.Trapnell C, Pachter L, Salzberg SL. TopHat: discovering splice junctions with RNA-Seq. Bioinformatics. 2009;25:1105–1111. [DOI] [PMC free article] [PubMed] [Google Scholar]
- 23.Trapnell C, Williams BA, Pertea G, et al. Transcript assembly and quantification by RNA-Seq reveals unannotated transcripts and isoform switching during cell differentiation. Nat Biotechnol. 2010;28:511–515. [DOI] [PMC free article] [PubMed] [Google Scholar]
- 24.Saldanha AJ. Java Treeview-extensible visualization of microarray data. Bioinformatics. 2004;20:3246–3248. [DOI] [PubMed] [Google Scholar]
- 25.Conesa A, Madrigal P, Tarazona S, et al. A survey of best practices for RNA-seq data analysis. Genome Biol. 2016;17:13. [DOI] [PMC free article] [PubMed] [Google Scholar]
- 26.Kim NI, Kim GE, Park MH, et al. Up-regulation of SPARC is associated with tumor progression and epithelial SPARC expression is correlated with poor survival and MMP-2 expression in patients with breast carcinoma. Int J Clin Exp Pathol. 2017;10:2675–2688. [Google Scholar]
- 27.Kim GE, Kim JH, Lee KH, et al. Stromal matrix metalloproteinase-14 expression correlates with the grade and biological behavior of mammary phyllodes tumors. Appl Immunohistochem Mol Morphol. 2012;20:298–303. [DOI] [PubMed] [Google Scholar]
- 28.DC Allred, Harvey JM, Berardo M, et al. Prognostic and predictive factors in breast cancer by immunohistochemical analysis. Mod Pathol. 1998;11:155–168. [PubMed] [Google Scholar]
- 29.Eswaran J, Cyanam D, Mudvari P, et al. Transcriptomic landscape of breast cancers through mRNA sequencing. Sci Rep. 2012;2:264. [DOI] [PMC free article] [PubMed] [Google Scholar]
- 30.Shi Y, Ye P, Long X. Differential expression profiles of the transcriptome in breast cancer cell lines revealed by next generation sequencing. Cell Physiol Biochem. 2017;44:804–816. [DOI] [PubMed] [Google Scholar]
- 31.Lin W, Feng M, Li X, et al. Transcriptome profiling of cancer and normal tissues from cervical squamous cancer patients by deep sequencing. Mol Med Rep. 2017;16:2075–2088. [DOI] [PMC free article] [PubMed] [Google Scholar]
- 32.Ramaswamy S, Ross KN, Lander ES, et al. A molecular signature of metastasis in primary solid tumors. Nat Genet. 2003;33:49–54. [DOI] [PubMed] [Google Scholar]
- 33.Li H, Yang L, Fu H, et al. Association between Gαi2 and ELMO1/Dock180 connects chemokine signalling with Rac activation and metastasis. Nat Commun. 2013;4:1706. [DOI] [PMC free article] [PubMed] [Google Scholar]
- 34.Gildea JJ, Seraj MJ, Oxford G, et al. RhoGDI2 is an invasion and metastasis suppressor gene in human cancer. Cancer Res. 2002;62:6418–6423. [PubMed] [Google Scholar]
- 35.Gámez-Pozo A, Trilla-Fuertes L, Prado-Vázquez G, et al. Prediction of adjuvant chemotherapy response in triple negative breast cancer with discovery and targeted proteomics. PLoS One. 2017;12:e0178296. [DOI] [PMC free article] [PubMed] [Google Scholar]
- 36.Payne CA, Maleki S, Messina M, et al. Loss of prostaglandin D2 synthase: a key molecular event in the transition of a low-grade astrocytoma to an anaplastic astrocytoma. Mol Cancer Ther. 2008;7:3420–3428. [DOI] [PubMed] [Google Scholar]
- 37.Ragolia L, Palaia T, Hall CE, et al. Diminished lipocalin-type prostaglandin D2 synthase expression in human lung tumors. Lung Cancer. 2010;70:103–109. [DOI] [PubMed] [Google Scholar]


