Abstract
Background
The doubly-labeled water (DLW) method is the gold standard methodology for determination of free-living, total daily energy expenditure (TEE). However, there is no single accepted approach for either the sampling protocols (daily vs. two-point, in which samples are collected after dosing and at the end of the measurement period) or the calculations used in the determination of the rate of carbon dioxide production (rCO2) and TEE. Moreover, fluctuations in natural background abundances introduce error in the calculation of rCO2 and TEE. The advent of new technologies makes feasible the possibility of including additional isotope measures (17O) to account for background variation, which may improve accuracy.
Methods
Sixteen subjects were studied for 7 consecutive days in a whole-room indirect calorimeter (IC) with concurrent measurement of TEE by DLW. Daily urine samples were obtained and isotope ratios determined using off-axis integrated cavity output spectroscopy (OA-ICOS).
Results
We determined the best combination of approaches for estimating dilution spaces, elimination rates, and calculated average daily carbon dioxide production (VCO2) using six different published equations. Using the best combination, multi-point fitting of isotope elimination rates using the daily urine samples substantially improved the average precision (4.5% vs. 6.0%) and accuracy (−0.5% vs. −3.0%) compared with the two-point method. This improvement may partly reflect the less variable day-to-day chamber measurements of energy expenditure. Utilizing 17O measurements to correct for errors due to background isotope fluctuations provided additional but minor improvements in precision (4.2% vs. 4.5%) and accuracy (0.2% vs. 0.5%).
Conclusions
This work shows that optimizing sampling and calculation protocols can improve the accuracy and precision of DLW measurements.
Keywords: Adult, Energy Metabolism, Humans, Oxygen Isotope, Deuterium, Respiratory Gas Exchange
The gold-standard for measuring total daily energy expenditure (TEE) in free-living individuals is the doubly-labeled water (DLW) method. The general principle of the method is that after consuming a dose of water labeled with the “heavy” stable isotopes of 2H and 18O, the elimination rates of these isotopes can be measured in samples of urine, saliva, or blood.(1, 2) A baseline sample is obtained prior to dosing, which is assumed to represent the background isotope levels. One or two samples are obtained shortly after dosing (typically within 4–6 hours), which are assumed to represent the point at which the labeled isotopes have fully equilibrated with the body water pools. Samples are then obtained at one or more points after dosing (typically within 1–21 days) and used to determine the rate of elimination of oxygen (kO) and hydrogen (kD) which are then used to determine the average daily rate of carbon dioxide production (rCO2 in mole/day) over the measurement period. rCO2 is then converted to the average daily volume of CO2 production (VCO2, L/day), which is used to estimate TEE, using an assumed respiratory quotient (typically 0.85) and the equation of Weir.(3) There are a number of assumptions built into these equations, and the impact they have on the determination of rCO2 have been previously considered (reviewed in Speakman, 1997).(2) Some of these issues were conclusively resolved, such as the use of a two-pool model (i.e. separate pools for the loss of 18O and 2H) to estimate the dilution spaces for large animals including humans, and the use of population rather than individual estimates of the dilution space ratio when calculating the size of the total body water (TBW) pool.(2, 4, 5) However, while there has been some discussion in the literature of other issues such as estimating TBW using the plateau or intercept methods, (6, 7) and whether to use one or the average of the two post-dose samples in this estimate, these issues have not been resolved and continue to vary from lab to lab. Furthermore, although many labs use only two samples (post-dose and end of study) to determine kO and kD, it is conceivable that using multiple samples (e.g. daily) to determine kO and kD may improve the accuracy and precision of the DLW method.(8–10) In addition, there have been several different equations published to estimate rCO2. Which combination of approaches to estimate TBW (plateau vs. intercept), ko and kD (two-point model vs. exponential decay), and equations to determine rCO2 produces the greatest accuracy and precision is not known. Moreover, the existence of multiple protocols and calculation types potentially compromises comparisons between studies.
Another factor that impacts the accuracy and precision of the DLW technique is that 2H and 18O occur naturally and their background levels fluctuate over time, primarily due to variations in sources of water and food in the diet.(11) To accurately determine kD and kO, the sample enrichments must be expressed as enrichments above background. The most common practice is to obtain a sample prior to dosing and assume that the background levels remain constant over the measurement period.(9, 12) However, if the natural (background) abundance changes substantially during the measurement period, this can result in errors in determining rCO2 and TEE.(12) It has been suggested that background fluctuations of 18O and 2H during the course of a typical DLW experiment might be reconstructed from changes in the levels of 17O.(13–15) Measurements of natural abundance variations of 17O by mass spectrometry are, however, technically challenging. The emergence of laser-spectroscopy approaches to isotope determination in water has made measurement of 17O much more feasible.(16, 17) Indeed, we have previously shown using off-axis integrated cavity output spectroscopy (OA-ICOS) that background fluctuations of 17O are highly correlated with background fluctuations of both 18O and 2H, and suggested that measurements of 17O could be used to measure and correct for the background isotope fluctuations of 18O and 2H in body water. (13) However, this approach has one substantial limitation, namely that the 17O stable isotope is enriched along with the 18O stable isotope in all commercially-available water enriched in 18O, and therefore 17O in dosed subjects is not at background abundance. Nevertheless, there are mathematical approaches which may overcome this problem.
The purpose of the analysis presented here is to determine the combination of approaches to calculate TBW, kO and kD, and equations to estimate rCO2, which produces the best accuracy and precision of the final, calculated daily VCO2. To achieve this, we used data from our recently-completed off-axis integrated cavity output spectroscopy (OA-ICOS) validation study using near continuous measurements from whole-room indirect calorimetry with additional measurements of 17O by OA-ICOS.(18) Additionally, we explored the potential to use these OA-ICOS 17O measurements to improve the accuracy and precision of the DLW method by correcting for background enrichment fluctuations.
EXPERIMENTAL
Participants
Adult volunteers (≥ 18 years) were recruited from the University of Colorado Anschutz Medical Campus and local communities. The study was registered on ClinicalTrials.gov (NCT01938794). Primary study exclusion criteria were self-reported smoking or use of smokeless tobacco products, self-reported chronic disease (e.g. heart disease, diabetes, or thyroid disease), or currently pregnant. The study was approved by the Colorado Multiple Institutional Review Board on May 2, 2013. As reported previously, 17 participants completed the primary validation study.(18) However, the isotope enrichments for one subject did not exhibit an exponential decay, likely due to measurement errors; because this would introduce artificial errors into the exponential modeling, this participant was excluded from the current analysis. Thus, the sample included in the current analysis consisted of 16 participants (9 females; age = 24–63 years; weight = 48.9–115.0 kg; BMI = 19.4 – 46.4 kg/m2).
Experimental design and study procedures
TEE and near continuous 24 h EE were measured simultaneously for 7 consecutive days using DLW and whole room indirect calorimetry, respectively, as previously described.(18) Upon arrival on day 1, body weight was measured and a baseline urine sample was obtained for determination of background isotope abundances. Participants were then given an oral dose of 0.25 g of 98 atom percent excess (APE) 18O labeled water and 0.14 g 99.8 APE 2H labeled water (Sigma Aldrich) per kg of total body water. Highly-enriched 18O labeled water was used to minimize the concurrent enrichment of 17O. After the dose was provided, subjects entered the room calorimeter to begin the 7 day study. Post-dosing urine samples were obtained 4 (PD4) and 5 hours (PD5) after the DLW dosing. The second urine void of the day was collected on days 2–7. On Day 8, subjects exited the calorimeter and end-dose urine samples were obtained at the same times of day as on Day 1 (ED4 and ED5).
OA-ICOS analysis of urine samples
Previously frozen urine samples were prepared and analyzed by OA-ICOS as previously described (13, 16). Simultaneous measurements of δ2H, δ18O, and δ17O were performed on each individual injection into the spectrometer. Isotopic data from the OA-ICOS analyzer were processed using commercially-available Post Analysis Software (LGR, version 3.1.0.9) as previously described.(13, 16) All samples were run and analyzed in duplicate, and repeated if the difference between runs exceeded 2 δ‰ for 2H:1H or 1 δ‰ for 18O:16O. 2H:1H and 18O:16O data from the original study (18) was used for all analyses; 17O:16O data, which was collected simultaneously with the other isotope data, is reported here for the first time.
Calculation of Dilution spaces (NO and ND)
Isotope dilution spaces were calculated using the plateau and intercept methods. In the plateau method, the dilution space is calculated from the measured isotope value of the post-dose sample(s) without further adjustment. Samples are assumed to represent the point of maximum enrichment. In the intercept method, the maximum isotope enrichment is calculated as the back-extrapolation of the isotope elimination to time zero, and this calculated maximum enrichment is used to determine the dilution space. The intercept dilution space was determined using each of the tested elimination rate methods (e.g. exponential), and used as appropriate with the matching elimination rate method in each individual calculation. For both the plateau and intercept approaches, ND and NO were calculated using each of the post-dose samples (PD4 and PD5), as well as the average of these two samples.
Calculation of isotope elimination rates
Isotope elimination rates (kO and kD) were calculated using four different approaches. In the traditional two-point method using the standard linear least-squares fit to log transformed data method as described by Schoeller et al. (4), four calculations for each elimination rate (pairwise 2-point linear fits for PD4 and PD5 with ED4 and ED5) were determined and averaged to create the final rate. We also utilized the daily urine samples to calculate isotope elimination rates using three different best-fit approaches. The linear fit to log method involved log(e) transformation of the isotope abundances followed by a linear least-squares fit to the data to determine the elimination rates. The exponential fit used the isotope abundances without further transformation and a Levenberg-Marquardt non-linear least-squares exponential fit to the data to determine the elimination rates. The weighted exponential method utilized a Levenberg-Marquardt non-linear least-squares exponential fit to the data with the measured standard deviations of the isotope measurements used as weighting factors in the calculation of chi squared. Simply stated, in the weighted fit, measurements with a high standard deviation are given less weight in creating the exponential fit than measurements with a low standard deviation. With all four approaches, enrichments were determined after subtraction of the estimated natural background isotope abundances, either assumed to equal the pre-dose sample or calculated using the background fluctuation correction. All calculations were performed in Igor Pro (v 6.37, WaveMetrics).
Calculation of the rate of CO2 production (rCO2) from kO, kD, NO, and ND
rCO2 was calculated using six different equations that have been proposed for converting the elimination rates (kO and kD), and dilution spaces (NO and ND) into rCO2:
- equation 35 of Lifson and McClintock,(1)
- equation 3 of Coward et al 1985,(19)
- equation 2 of Speakman et al 1993,(5)
where N = ((NO/1.01)+(ND/1.0532))/2 - equation 1 of Racette et al. 1994,(21)
where N = ((NO/1.01)+(ND/(1.01*Rdil)))/2, Rdil = ( + 1.034)/2, and is the average dilution space ratio from the current study - equation 17.41 of Speakman,(2)
where N = (NO+(ND/)) and is the average dilution space ratio from the current study.
These equations differ in their treatments of the impact of fractionation of isotopes, fractionation temperature assumed, isotope dilution spaces (a single space or one for each isotope), and population dilution space ratio. (2) The rationales for the different derivations can be found in Speakman. (2)
Background Fluctuation Correction
Isotopic measurements of 17O were used to measure and correct for background isotope fluctuations of 18O and 2H in body water samples. However, enrichment of 17O in the enriched 18O dose necessitated a mathematical model of the measured 17O data and subtraction of the 17O enrichment prior to the background fluctuation correction. Fourteen different methods of modeling the 17O enrichment followed by background fluctuation correction were compared with no background fluctuation correction. In each case the measured 17O of the pre-dose urine sample was subtracted from the 17O data before modeling. Weighted fits use the standard deviations of measured isotope ratios as weighting factors in the calculation of chi squared. All calculations were performed in Igor Pro (v 6.37, WaveMetrics). The fourteen modeling methods were:
Exponential fit to 17O/16O ratios fixing background offset to zero
Weighted exponential fit to 17O/16O ratios fixing background offset to zero
Exponential fit to 18O/16O ratios fixing background offset to zero; use this fixed calculated oxygen elimination rate in an exponential fit to 17O/16O ratios fixing background offset to zero
Weighted exponential fit to 18O/16O ratios fixing background offset to zero; use this fixed calculated oxygen elimination rate in an exponential fit to 17O/16O ratios fixing background offset to zero
Iteration of (c) above until the calculated 18O elimination rate is stable
Iteration of (d) above until the calculated 18O elimination rate is stable
Fully proscribe an exponential decay describing the 17O enrichment with the following parameters: background offset of zero, maximum value equal to the measured PD4 17O/16O ratio, and elimination rate from the 18O elimination rate
Iteration of (g) above until the calculated 18O elimination rate is stable
Exponential fit to 17O/16O ratios floating background offset
Weighted exponential fit to 17O/16O ratios floating background offset
Exponential fit to 18O/16O ratios fixing background offset to zero; use this fixed calculated oxygen elimination rate in an exponential fit to 17O/16O ratios floating background offset
Weighted exponential fit to 18O/16O ratios fixing background offset to zero; use this fixed calculated oxygen elimination rate in an exponential fit to 17O/16O ratios floating background offset
Iteration of (k) above until the calculated 18O elimination rate is stable
Iteration of (l) above until the calculated 18O elimination rate is stable
Many of the methods (c-h and k-n) rely on the assumption that all oxygen elimination occurs at the same rate, i.e. the elimination rate measured for 18O is the same as the elimination rate for 17O. As there is no evidence that the elimination rates of the two oxygen heavy stable isotopes would be different, and the since differences in fractionation are small compared with the elimination, we believe this is a reasonable assumption.
Each model of the 17O enrichment was subtracted from the measured 17O/16O ratios, resulting in 17O residuals. These residuals are hypothesized to be measurements of the background fluctuations of the 17O isotope. Previously measured relationships between 17O/16O and 18O/16O and 17O/16O and 2H/1H were utilized with the 17O residuals to correct 18O and 2H isotopic abundances for the effects of background fluctuations (13). Adjustments were made on the raw isotope ratios (rather than delta values) using the following equations, which were derived using linear fits to experimental data of urine from 40 undosed human subjects (13):
These adjustments use the measured correlation in fluctuations between isotopes to create a background fluctuation correction. Background fluctuation correction was utilized with each combination of calculations, including all methods of dilution space, isotope elimination rate, and rCO2 calculation equations.
Statistics - Differences between IC and the various calculation approaches were determined using paired t-tests. Because the various calculations are not independent, they cannot be directly compared with one another, hence each calculation was separately compared to IC. Level of agreement was evaluated using the difference between the criterion and observed values (percent error, a measure of accuracy), the average absolute value of the accuracy (average percent precision, a measure of precision), root mean squared error (RMSE, a measure of the magnitude of errors resulting from both bias and variability), and Bland-Altman plots (which provide a measure of bias and limits of agreement, as well as determining whether the error is associated with the magnitude of the criterion measure). The Bland-Altman analyses were performed using the IC as the criterion measure. Significance for all tests was set at p=0.05. Analyses were performed using Origin Pro (9.0, Northampton, MA). Data are reported as mean ± SD.
RESULTS
Calculation of Dilution spaces (NO and ND) and Ratios
Dilution spaces (NO and ND) were determined using 4hr and 5hr urine measurements and the average of the two, using both the plateau and intercept methods (Table 1). The table shows only the results using the two-point isotope elimination rate for simplicity. Regardless of approach ND and NO were similar, and the average dilution space ratios were close to the population value for adult humans of 1.036.(22) As expected, dilution spaces calculated using the plateau method are slightly greater than those calculated by the intercept method.
Table 1.
Deuterium (ND) and oxygen (NO) dilution spaces (kg) and dilution space ratio (ND:NO) measured using 4 hour and 5 hour urine measurements and the average of the two. Results are presented for both plateau and intercept methods. Mean (SD).
| Intercept Method | Plateau Method | |||||
|---|---|---|---|---|---|---|
| 4 hr | 5 hr | Average | 4 hr | 5 hr | Average | |
| ND | 38.3 (6.6) | 38.8 (6.9) | 38.5 (6.7) | 39.0 (6.6) | 39.7 (6.8) | 39.4 (6.7) |
| NO | 37.1 (6.3) | 37.5 (6.6) | 37.3 (6.4) | 37.9 (6.3) | 38.6 (6.6) | 38.2 (6.5) |
| ND:NO | 1.0323 (0.0058) | 1.0335 (0.0050) | 1.0329 (0.0053) | 1.0291 (0.0065) | 1.0292 (0.0056) | 1.0292 (0.0059) |
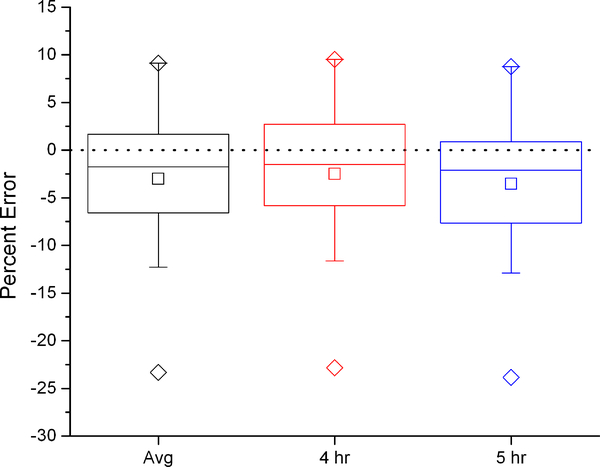
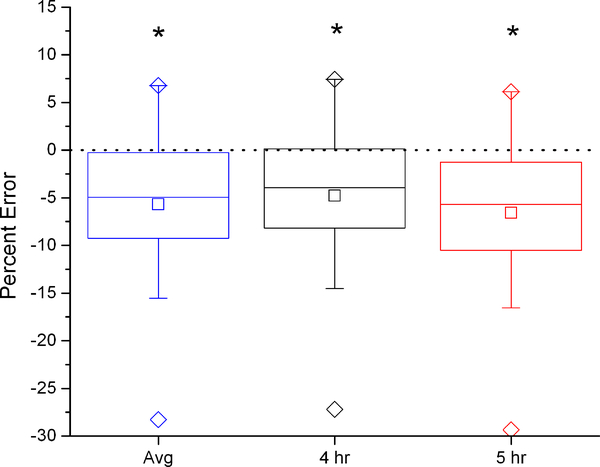
To demonstrate the effect of the dilution space calculation on calculated VCO2, the six dilution space calculation methods were used with a two-point elimination calculation, the modified Schoeller A6 equation (equation c above) (4, 20) and no background fluctuation correction. With the intercept method, there were no significant differences between calculated and measured VCO2, regardless of which time points (4hr, 5hr, or the average of the two) were used to calculate the dilution spaces (Figure 1). Conversely, with the plateau method, calculated VCO2 was 4–6% lower than IC measured VCO2 for all time points.
Figure 1:
Percent error in VCO2 using average, 4 hour, and 5 hour dilution spaces compared to the criterion measure IC with the intercept (left) and plateau (right) methods. Box represents interquartile range with center line at median and center square at mean. Error bars represent 5’th and 95’th percentile, diamonds maximum and minimum values. Paired t-tests of each DLW calculation with the IC criterion measure indicate which equations show significant differences from IC (*, p=0.05).
Calculation of isotope elimination rates
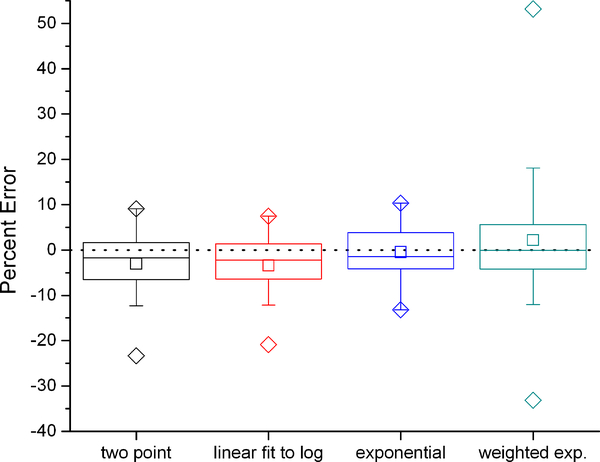
Figure 2 shows the percent error between DLW and IC VCO2 for the four different methods of calculating the isotope elimination rates. These calculations used the average dilution space calculated with the intercept method, the modified Schoeller et al A6 equation (equation c above)(4, 20) and no background fluctuation correction. Regardless of the method, there were no statistically significant differences between calculated and measured VCO2. The most accurate (−0.5%) and precise (4.7%) calculation method was found to be the exponential fit. Calculations made with the plateau method showed a similar pattern with the choice of method for calculation of the isotope elimination rates.
Figure 2:
Percent error in VCO2 using different methods to calculate the isotope turnover rates compared to the criterion measure IC with the intercept method. Box represents interquartile range with center line at median and center square at mean. Error bars represent 5’th and 95’th percentile, diamonds maximum and minimum values.
Calculation of CO2 production (VCO2)
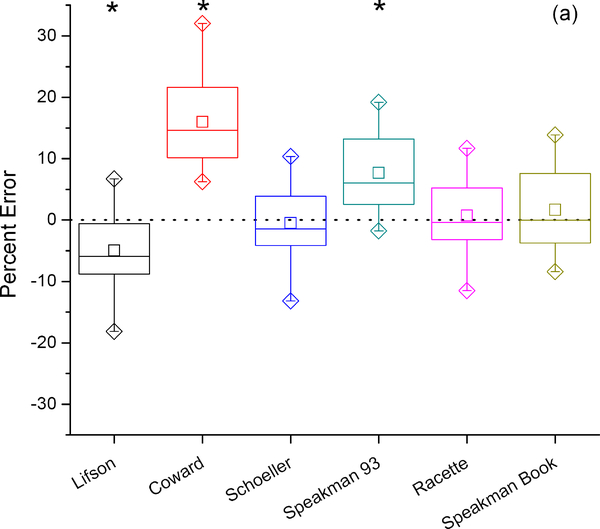
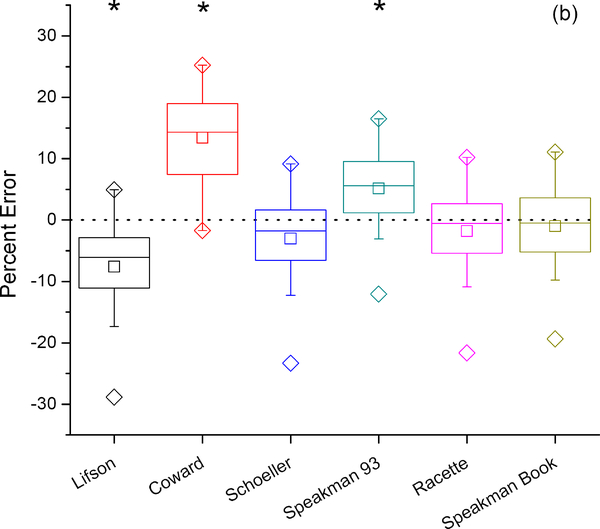
Figure 3 shows the percent error for six different equations used to calculate rCO2 using the average dilution space determined with the intercept method and no background fluctuation correction. For comparison purposes, these calculations were performed using the two-point elimination rate (Figure 3b) and the exponential elimination rate (Figure 3a). Significant differences between calculated and measured VCO2 were observed for the equations of Lifson,(1) Coward,(19) and Speakman(5) (equations a, b, and d above, respectively). However, there were no significant differences in calculated and measured VCO2 with the equations of Schoeller,(4, 20) Racette,(21) and Speakman,(2) (equations c, e, and f above, respectively). Similar results were obtained whether the two-point or exponential-fit methods were used to determine the isotope elimination rates. The average (standard deviation) percent error for the Schoeller,(4, 20) (equation c) Racette,(21) (equation e) and Speakman (2) (equation f) equations were −0.5% (6.1%), 0.7% (6.0%), and 1.7% (6.4%) respectively using the exponential elimination method, and −3.0% (8.0%), −1.8% (7.9%), and −1.0% (8.1%) using the two-point elimination calculations.
Figure 3:
Percent error in VOC2 using six previously-published DLW equations compared to the criterion measure IC with exponential fit (a) and two-point (b) calculations of elimination rates. Box represents interquartile range with center line at median and center square at mean. Error bars represent 5’th and 95’th percentile, diamonds maximum and minimum values. Paired t-tests of each DLW calculation with the IC criterion measure indicate which equations show significant differences from IC (*).
Background Fluctuation Correction
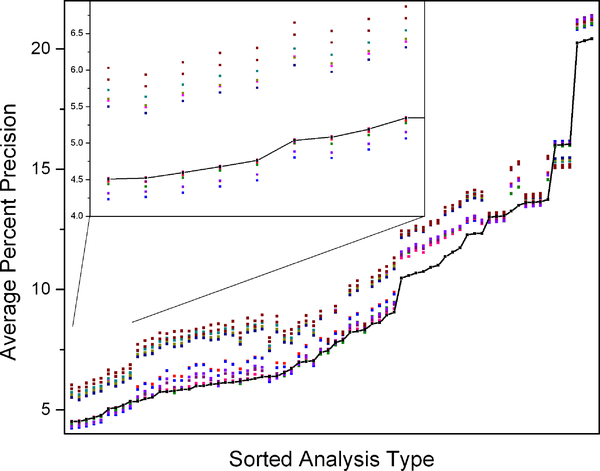
Average percent precisions were calculated using 17O to adjust for fluctuations in background abundances. Permuting all methods of determining dilution spaces, elimination rates, DLW calculation equations, and background fluctuation correction resulted in 2160 different combinations. The average percent precision for each calculation is shown as a single point in Figure 4. Because the intercept and plateau methods of calculating dilution spaces give similar results, results from only the intercept method are shown. Each point on the x axis represents a single combination of approaches and equations to calculate dilution spaces, isotope elimination rates, and VCO2. Each point at a given x position represents a different approach to correct for background fluctuations; the black points represent the results without background fluctuation correction, and each color represents one of the 14 different background fluctuation correction approaches. Six methods of 17O enrichment subtraction and background fluctuation correction produce consistently less precise results than no background fluctuation correction (points above the black line in Figure 4) while seven methods produce more precise results than no background fluctuation correction (points below the black line in Figure 4).
Figure 4:
Average percent precision of multiple combinations of approaches and equations to estimate dilution spaces, elimination rates, and VCO2 with application of different methods of utilizing 17O abundances to correct for background fluctuations (intercept method). The black trace shows the average percent precision of each combination of equations without any correction and each color represents a different background correction approach. The inset shows an enlargement of the data for the most precise combinations with and without 17O background fluctuation correction.
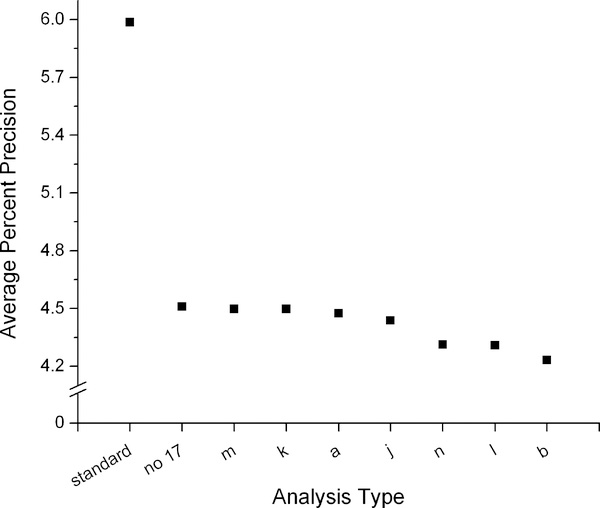
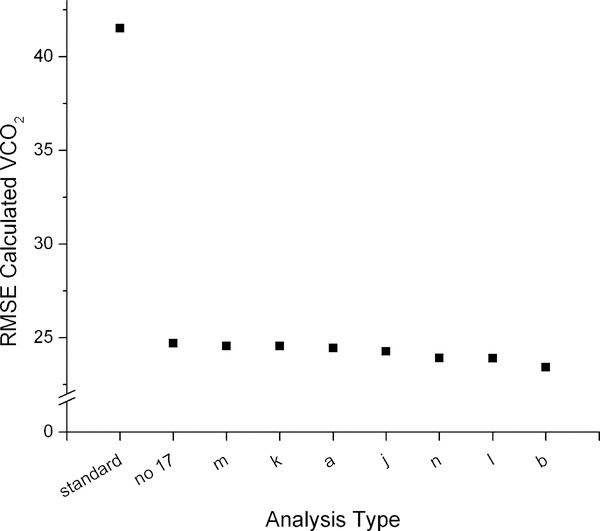
The impact of the seven best methods of background fluctuation correction on the precision and accuracy of the VCO2 measurement is shown in Figure 5. The leftmost point shows a ‘typical’ calculation without background correction (average of the dilution spaces using the intercept method from the 4 and 5 hr post dose samples, two-point elimination calculations, the Schoeller et al. A6 (4, 20) equation). The second point shows the most precise (measured as average percent precision) calculation without background fluctuation correction, which utilizes the intercept dilution space (using the 4hr time point for the post dose sample), exponential elimination calculations, and the Schoeller et al. A6 (4, 20) equation (equation c); this calculation is shown in the first x position in Figure 4. This result is compared with seven different methods of 17O enrichment subtraction and background fluctuation correction using the same approaches to the calculations other than the background fluctuation correction. Changing from the two-point to the exponential elimination rate calculation improved the precision from 6.0% to 4.5% and the RMSE from 41.5 to 24.7. Adding the background fluctuation correction using the best-performing model (b) further improves the percent precision to 4.2% and the RMSE to 23.4. The improvement in precision when the background fluctuation correction is applied is small compared to the improvement afforded by using an exponential elimination rate calculation. Regardless of approach used to estimate background fluctuation, average precision was 4.2 – 4.5%.
Figure 5:
Average percent precision (left) and root mean squared error (RMSE, right) of VCO2 calculated from DLW data compared to the criterion measure IC. The most precise combination of calculations without background fluctuation (no 17) is compared with the seven best methods of background fluctuation correction using the 17O data (model type listed on the x axis). VCO2 determined using a standard approach (left most point) is included for comparison.
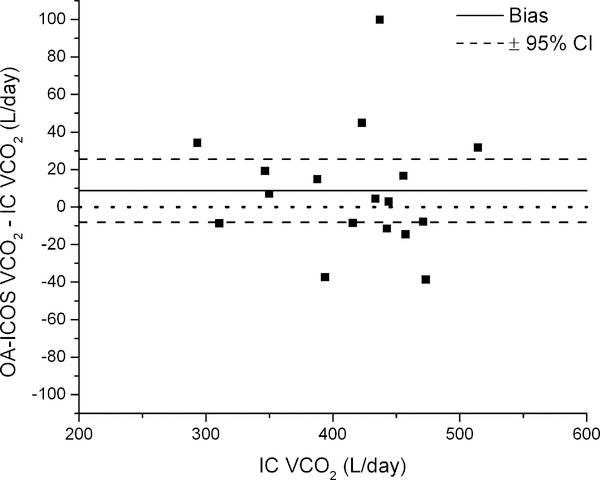
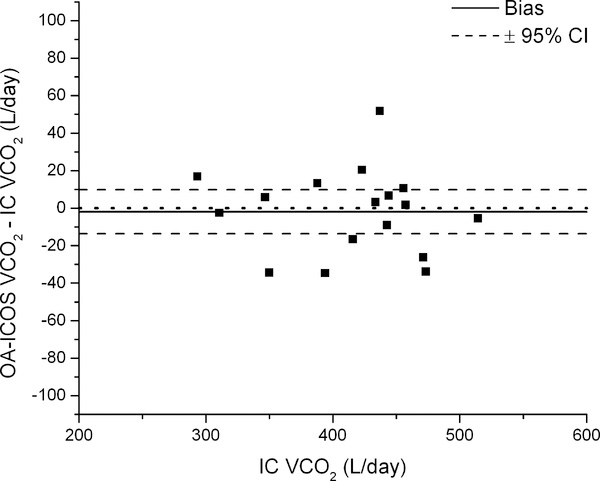
We performed a Bland-Altman analyses of a typical approach (Figure 6, left) and the overall most precise combination of approaches and calculations (Figure 6, right; intercept method to determine the dilution space using only the 4hr post dose sample; exponential elimination to determine isotope turnover rates; the equation of Schoeller et al. to calculate VO2 (4, 20); and background fluctuation correction using the weighted exponential fit to 17O/16O ratios fixing background offset to zero). Applying the most precise combination of steps reduced the magnitude of the bias (from +8.65 to −1.96 L/day), and produced a smaller and more centered 95% CI (−13.69 to +9.76 vs. −8.22 to +25.53 L/day).
Figure 6:
Bland-Altman plots of a typical approach for calculating VCO2 (left) and the most precise combination of equations and approaches for determining dilution spaces, turnover rates, and VCO2 after background fluctuation correction (right; approach “b” in Figure 5) compared to VCO2 measured using IC.
DISCUSSION
The purpose of this study was to determine the optimal combination of approaches for calculating dilution space, isotope turnover rates, and equations to calculate VCO2 using the DLW method that produces the most accurate and precise measurements of VCO2. We also determined if applying methods to account for background fluctuations in natural isotope abundance improved this precision. First, we determined that using the different time point measurements to determine the dilution space had no effect on the accuracy of VCO2; regardless of approach used, calculated VCO2 was not significantly different from measured VCO2. However, there were differences between the intercept and plateau method, with the plateau method producing statistically significant 4–6% lower results. The plateau method producing lower VCO2 is to be expected since the oxygen elimination rate is greater and thus the extrapolation to time zero creates a larger difference for oxygen elimination than for hydrogen elimination. Second, we determined that exponential fitting of daily measurements of isotope abundance substantially improved the average percent precision (4.5%) and accuracy (−0.5%) of the VCO2 results compared with the two-point approach (6.0% and −3.0%, respectively). Finally, we demonstrated that utilizing 17O measurements to correct for errors due to background isotope fluctuations resulted in additional but small improvements to the precision (4.2%) and accuracy (0.2%) of the calculated VCO2.
The exponential and weighted exponential isotope elimination methods give median percent error closer to zero than the two-point method, while the linear fit to log method gives a slightly higher median error than the two-point method (Figure 2). For all four elimination calculations the mean VCO2 is not statistically significantly different from that measured by IC. It is important to note that while the weighted exponential method gives the lowest percent error, the precision of the measurement is negatively impacted. This is likely due to the fact that the weighting factors are standard deviations of a small number (2–3) of measurements and therefore not statistically representative of the actual uncertainty in the measurements. We conclude that of the methods tested, the most promising method of isotope elimination determination for an 8 day protocol is an exponential fit to the isotope values including those at 4 and 5 hours post dose, daily for the next 7 days, and on day 8 at the same times as the post dose samples. A potential caveat in this recommendation is that the behavior of subjects in the chamber is more constrained than that of free-living subjects, likely leading to reduced day to day variation in energy demands. In practice if individuals in the real world modulated their behavior in relation to, for example, differences between the work week and weekend, then the assumption of a single underlying exponential would be violated. These potential differences were not mimicked by the activities of individuals in the chamber. It has been noted previously that such temporal deviations from a single exponential may lead to systematic errors when curve fitting of multiple points is employed (2, 9, 10)
Another more theoretical point regarding the difference between the multiple-point, curve-fitting method and the two-point method is whether the improvement with the multi-point approach derives from the distribution and fitting of the measurements, or whether it is a consequence of simply performing a greater number of total analyses. In the multi-point approach, samples are collected twice on the first and last day and every day for the intervening 6 days and analyzed in duplicate, leading to 20 total analyses. In contrast, when using the two point method there are only 4 points in duplicate (2 on each of the first and last days) and therefore fewer than half the total number of analyses. This raises the question of whether increasing the number of analyses in the 2 point method to have the same number of analyses would lead to greater precision in the two-point method. The present work does not resolve this theoretical issue, but it does suggest that multi-point sampling provides improvements over 2 point sampling as it is currently practiced.
A lower susceptibility to analytical errors in any one isotope measurement is difficult to rigorously test, but we do note that the majority (75%) of the percent errors produced by the exponential elimination calculations are lower than those produced by the two-point method, suggesting a more robust calculation. Notably, the error on the subject (S11, outlier in Figure 6) with the poorest agreement with IC falls from 23% error to 13% error with the use of an exponential elimination calculation. The use of additional isotope measurements also increases the chances of including more measurements with analytical errors; it is possible that this phenomenon accounts for the subjects for which the exponential elimination calculation is less accurate than the two-point calculation.
Six different equations for calculating VCO2 from the dilution spaces and elimination rates produced significantly different results. The equations of Schoeller,(4, 20) Racette,(21) and Speakman,(2) (equations c, e, and f respectively in the methods) produced VCO2 values not significantly different from IC while the equations of Lifson and McClintock,(1) Coward,(19) and Speakman et al. (5) (equations a, b, and d respectively), produced VCO2 values significantly different from IC. The main reason why the Lifson and McClintock equation performed poorly is that it is a single pool model. There are theoretical reasons why in smaller animals, for which the Lifson and McClintock equation (equation a) was originally designed, single pool models may be most appropriate, but in larger animals two-pool models are theoretically superior.(23, 24) In addition this model depends on fractionation assumptions at an inappropriate body temperature. Although the Coward equation is a two-pool model it also uses an inappropriate fractionation assumption. The Coward equation also uses individual dilution spaces; the original suggestion was that utilizing the individual dilution spaces should reduce the precision error, but in our data and previous studies that was not the case. This is presumably because most of the variation in the dilution space ratio is analytical. (5, 21, 25) The equation by Speakman et al (5) utilizes the appropriate fractionation factors but has a dilution space ratio that is too high because it was derived from an inter-study average that included studies that were based on zinc reduction of untreated urines for analysis of the hydrogen isotope.(5, 26) The three equations (c, e, and f) that were not significantly different from the IC data all utilize the appropriate fractionation factors for human body temperature and differ only slightly in the exact dilution space ratio that is incorporated into the equation depending on the source of the studies used to derive the average. These results suggest these minor differences in dilution space ratios do not significantly impact the correspondence between DLW and IC results and data derived using any of these three equations is likely to be unbiased and comparable between studies.
To test the hypothesis that 17O could be used to measure and correct for the background isotope fluctuations of 18O and 2H in body water during DLW measurement, (13) the 17O isotope of all urine samples was measured simultaneously with 18O and 2H measurements. Fourteen different methods for modeling the 17O enrichment were tested. Highly-enriched 18O labeled water was used to minimize the concurrent enrichment of 17O, although this is likely to be unnecessary since the 17O enrichment is accounted for by the enrichment modeling. Of the thousands of different combinations, only for a few calculation types does the background fluctuation correction using 17O afford any improvement (Figure 4). Notably, the 17O correction for background fluctuation worsens precision for all analyses using the two-point method for the isotope elimination rate. This is likely due to the fact that the two-point method does not provide sufficient data to accurately model and subtract the 17O enrichment. However, for the most precise methods, the 17O correction for background fluctuation improves precision for several different models of 17O enrichment, indicating that the improvement is not an artifact of the model used. In addition, the models that improve precision include both those that measure the oxygen decay rate using the 17O and the 18O data, lending credence to our assumption that the rates are the same.
We hypothesize that one reason for the small effect of the background fluctuation correction is the short (8 day) duration of this study, necessitated by subjects remaining inside the indirect calorimeter for the entire study period to have a comparison measurement. A short study duration produces end-of-study abundances that are quite high compared with background isotope values and thus are not as susceptible to errors caused by background fluctuations. This would not be the case for longer DLW studies (e.g. 14–21 days).
This study, as is the case for all studies involving validation of the DLW method by IC, is limited by the necessity of keeping participants in the IC for the duration of the study. This limited the duration of the study (8 days), the diversity of food and liquid intake, and the physical activity of the participants. To mitigate the physical activity issue somewhat, participants were instructed to exercise on a treadmill every day in the chamber. Furthermore, some participants varied their exercise over different days. No differences were noted to correlate with exercise differences. We also did not find any evidence for a systematic relationship between BMI and the difference between the DLW and IC estimates (data not shown). Nor was any sex-related bias evident from the comparison (data not shown). This lends confidence that measurements by DLW of expenditure related to sex and adiposity will not be biased.
We conclude that the addition of daily urine and 17O measurements along with optimized sampling protocol and calculations can improve the accuracy and precision of DLW experiments. The greatest improvements in precision (from 6% to 4.5%) and accuracy (from −3% to −0.5%) were found by moving to an exponential-fit determination of the isotope elimination rates based on daily urine collections. Such improvements were found regardless of the final isotope abundancebut may partly reflect the more constant day-to-day variation in EE in calorimetry chambers. A small additional improvement in both precision (to 4.2%) and accuracy (to +0.2%) was gained by utilizing 17O measurements to correct for errors due to background isotope fluctuations. This improvement may become more substantial if final isotope abundances are closer to background levels. Additional experiments will be necessary to fully understand the possibilities for the background fluctuation correction and associated lowering of the necessary isotope dose for DLW experiments.
Acknowledgments
Sources of Support: This work was supported by an NIH Small Business Innovation (SBIR) Research Grant (R44 DK093362), as well as support from the Colorado Nutrition and Obesity Research Center (P30 DK048520) and the Colorado Clinical and Translational Science Institute (UL1 RR025780). Dr. Melanson is also supported by resources from the Geriatric Research, Education, and Clinical Center at the Denver VA Medical Center. Dr Speakman was supported by a 1000 Talents award from the Chinese government and a Wolfson merit award from the UK royal society.
Footnotes
Conflict of Interest (COI) Statement: At the time the research was conducted, Elena Berman was employed by ABB/Los Gatos Research, the company that manufactures the OA-ICOS analyzer used for the analyses in this paper.
Clinical Trial Registry: The study was registered on ClinicalTrials.gov (NCT01938794)
Contributor Information
Elena S.F. Berman, Los Gatos Research/ABB, San Jose, CA
Tracy Swibas, Division of Geriatric Medicine, Department of Medicine, University of Colorado Anschutz Medical Campus, Aurora, CO.
Wendy M. Kohrt, Division of Geriatric Medicine, Department of Medicine, University of Colorado Anschutz Medical Campus, Aurora, CO Geriatric Research, Education, and Clinical Center, VA Eastern Colorado Health Care System, Denver, CO.
Vicki A. Catenacci, Division of Endocrinology, Metabolism, and Diabetes, Department of Medicine, University of Colorado Anschutz Medical Campus, Aurora, CO
Seth A. Creasy, Division of Endocrinology, Metabolism, and Diabetes, Department of Medicine, University of Colorado Anschutz Medical Campus, Aurora, CO
Edward L. Melanson, Division of Endocrinology, Metabolism, and Diabetes, Department of Medicine, University of Colorado Anschutz Medical Campus, Aurora, CO Division of Geriatric Medicine, Department of Medicine, University of Colorado Anschutz Medical Campus, Aurora, CO; Geriatric Research, Education, and Clinical Center, VA Eastern Colorado Health Care System, Denver, CO.
John R. Speakman, Institute of Biological and Environmental Sciences, Aberdeen University, Aberdeen, United Kingdom and State Key Laboratory of Molecular Developmental Biology, Institute of Genetics and Developmental Biology, Chinese Academy of Sciences, Beijing, China
REFERENCES
- 1.lifson N, McClintock R. Theory of the use of the turnover rates of body water for measuring energy expenditure. J Theor Biol. 1966;12:46–74. [DOI] [PubMed] [Google Scholar]
- 2.Speakman JR. Doubly labelled water: Theory and practice. London: Chapman and Hall; 1997. [Google Scholar]
- 3.Weir JB. New methods for calculating metabolic rate with special reference to protein metabolism. The Journal of physiology. 1949;109(1–2):1–9. [DOI] [PMC free article] [PubMed] [Google Scholar]
- 4.Schoeller DA, Ravussin E, Schutz Y, Acheson KJ, Baertschi P, Jequier E. Energy expenditure by doubly labeled water: validation in humans and proposed calculation. The American journal of physiology. 1986;250(5 Pt 2):R823–30. [DOI] [PubMed] [Google Scholar]
- 5.Speakman JR, Nair KS, Goran MI. Revised equations for calculating CO2 production from doubly labeled water in humans. The American journal of physiology. 1993;264(6 Pt 1):E912–7. [DOI] [PubMed] [Google Scholar]
- 6.Pontzer H Method and rationale for recalculating dilution spaces to a single, common time point in doubly labeled water studies. European journal of clinical nutrition. 2018;72(12):1620–4. [DOI] [PubMed] [Google Scholar]
- 7.Roberts SB, Dietz W, Sharp T, Dallal GE, Hill JO. Multiple laboratory comparison of the doubly labeled water technique. Obes Res. 1995;3 Suppl 1:3–13. [DOI] [PubMed] [Google Scholar]
- 8.Klein PD, James WP, Wong WW, Irving CS, Murgatroyd PR, Cabrera M, et al. Calorimetric validation of the doubly-labelled water method for determination of energy expenditure in man. Human nutrition Clinical nutrition. 1984;38(2):95–106. [PubMed] [Google Scholar]
- 9.Speakman JR, Racey PA. Measurement of CO2 production by the doubly labeled water technique. Journal of applied physiology. 1986;61(3):1200–2. [DOI] [PubMed] [Google Scholar]
- 10.Speakman JR, Racey PA. Doubly labelled water: Errors in the evaluation of oxygen isotope turnover due to temporal variation in CO2 production do not always covary with dilution space estimate. J Theor Biol. 1989;141(4):547–56. [Google Scholar]
- 11.Speakman JR, Racey PA. The equilibrium concentration of oxygen-18 in body water: Implications for the accuracy of the doubly-labelled water technique and a potential new method of measuring RQ in free-living animals. J Theor Biol. 1987;127(1):79–95. [Google Scholar]
- 12.Horvitz MA, Schoeller DA. Natural abundance deuterium and 18-oxygen effects on the precision of the doubly labeled water method. American journal of physiology Endocrinology and metabolism. 2001;280(6):E965–72. [DOI] [PubMed] [Google Scholar]
- 13.Berman ES, Melanson EL, Swibas T, Snaith SP, Speakman JR. Inter- and intraindividual correlations of background abundances of (2)H, (18)O and (17)O in human urine and implications for DLW measurements. European journal of clinical nutrition. 2015;69(10):1091–8. [DOI] [PubMed] [Google Scholar]
- 14.Speakman JR. The role of technology in the past and future development of the doubly labelled water method. Isotopes Environ Health Stud. 2005;41(4):335–43. [DOI] [PubMed] [Google Scholar]
- 15.Speakman JR, Krol E. Comparison of different approaches for the calculation of energy expenditure using doubly labeled water in a small mammal. Physiological and biochemical zoology : PBZ. 2005;78(4):650–67. [DOI] [PubMed] [Google Scholar]
- 16.Berman ES, Fortson SL, Snaith SP, Gupta M, Baer DS, Chery I, et al. Direct analysis of delta2H and delta18O in natural and enriched human urine using laser-based, off-axis integrated cavity output spectroscopy. Analytical chemistry. 2012;84(22):9768–73. [DOI] [PMC free article] [PubMed] [Google Scholar]
- 17.Berman ES, Levin NE, Landais A, Li S, Owano T. Measurement of delta18O, delta17O, and 17O-excess in Water by Off-Axis Integrated Cavity Output Spectroscopy and Isotope Ratio Mass Spectrometry. Analytical chemistry. 2013. [DOI] [PMC free article] [PubMed] [Google Scholar]
- 18.Melanson EL, Swibas T, Kohrt WM, Catenacci VA, Creasy SA, Plasqui G, et al. Validation of the doubly labeled water method using off-axis integrated cavity output spectroscopy and isotope ratio mass spectrometry. American journal of physiology Endocrinology and metabolism. 2017:ajpendo 00241 2017. [DOI] [PMC free article] [PubMed] [Google Scholar]
- 19.Coward WA, Prentice AM. Isotope method for the measurement of carbon dioxide production rate in man. The American journal of clinical nutrition. 1985;41(3):659–63. [DOI] [PubMed] [Google Scholar]
- 20.Schoeller DA. Measurement of energy expenditure in free-living humans by using doubly labeled water. The Journal of nutrition. 1988;118(11):1278–89. [DOI] [PubMed] [Google Scholar]
- 21.Racette SB, Schoeller DA, Luke AH, Shay K, Hnilicka J, Kushner RF. Relative dilution spaces of 2H- and 18O-labeled water in humans. The American journal of physiology. 1994;267(4 Pt 1):E585–90. [DOI] [PubMed] [Google Scholar]
- 22.Sagayama H, Yamada Y, Racine NM, Shriver TC, Schoeller DA, Group DLWS. Dilution space ratio of 2H and 18O of doubly labeled water method in humans. Journal of applied physiology. 2016;120(11):1349–54. [DOI] [PMC free article] [PubMed] [Google Scholar]
- 23.Speakman JR. Calculation of CO2 production in doubly-labelled water studies. J Theor Biol. 1987;126(1):101–4. [DOI] [PubMed] [Google Scholar]
- 24.speakman JR. How should we caclulate CO2 production in doubly labeled water studies of animals. Functiona Ecology. 1993;7:746–50. [Google Scholar]
- 25.Krol E, Speakman JR. Isotope dilution spaces of mice injected simultaneously with deuterium, tritium and oxygen-18. J Exp Biol. 1999;202(Pt 20):2839–49. [DOI] [PubMed] [Google Scholar]
- 26.Ritz P, Johnson PG, Coward WA. Measurements of 2H and 18O in body water: analytical considerations and physiological implications. The British journal of nutrition. 1994;72(1):3–12. [DOI] [PubMed] [Google Scholar]


