Abstract
MRI and MRCP play an important role in the diagnosis of chronic pancreatitis (CP) by imaging pancreatic parenchyma and ducts. MRI/MRCP is more widely used than computed tomography (CT) for mild to moderate CP due to its increased sensitivity for pancreatic ductal and gland changes; however, it does not detect the calcifications seen in advanced CP. Quantitative MR imaging offers potential advantages over conventional qualitative imaging, including simplicity of analysis, quantitative and population-based comparisons, and more direct interpretation of detected changes. These techniques may provide quantitative metrics for determining the presence and severity of acinar cell loss and aid in the diagnosis of chronic pancreatitis. Given the fact that the parenchymal changes of CP precede the ductal involvement, there would be a significant benefit from developing an MRI/MRCP based, more robust diagnostic criteria combining ductal and parenchymal findings. Among cross-sectional imaging modalities, multi-detector CT (MDCT) has been a cornerstone for evaluating chronic pancreatitis (CP) since it is ubiquitous, assesses primary disease process, identifies complications like pseudocyst or vascular thrombosis with high sensitivity and specificity, guides therapeutic management decisions, and provides images with isotropic resolution within seconds. Conventional MDCT has certain limitations and is reserved to provide predominantly morphological (e.g. calcifications, organ size) rather than functional information. The emerging applications of radiomics and artificial intelligence is poised to extend the current capabilities of MDCT. In this review article, we will review advanced imaging techniques by MRI, MRCP, CT and ultrasound.
Keywords: Chronic Pancreatitis, MRI, MRCP, T1 Mapping, Extracellular Volume, Diffusion Weighted Imaging, Computerized Tomography, Quantitative Imaging, Virtual Unenhanced Images
Introduction
The histologic hallmarks of chronic pancreatitis (CP) include fibrosis, chronic inflammation, and loss of acinar cells [1]. Characteristic features of CP are often absent on standard diagnostic tests, including imaging studies. Magnetic Resonance Cholangiopancreatography (MRCP) and Endoscopic Retrograde Cholangiopancreatography (ERCP) can be normal in patients during the early stage of this disease, and diagnosis of early CP remains a challenge [2,3]. Histologic diagnosis is rarely pursued, given the potential for complications (i.e., acute pancreatitis). Therefore, it is much desired to have a practical, accessible, highly innovative, reproducible, and non-invasive imaging method to detect and quantify CP. The major role of the MR imaging has been to provide information about ductal findings to the clinicians in a non-invasive fashion. Significant efforts have been made to incorporate parenchymal changes seen with MRI to complement the ductal findings. Currently, there are no widely accepted diagnostic criteria including both MRI and MRCP findings. However, ongoing research may allow MR parenchymal imaging to be more verified and adopted, ultimately leading to new diagnostic criteria for CP based on MR imaging. A consensus guideline has been published to improve standardization of radiologic reporting of imaging findings of CP to allow for improved uniformity of data and communication among specialists for patient care [3,4].
Among cross-sectional imaging modalities, multi-detector CT (MDCT) has been a cornerstone for evaluating CP since it is ubiquitous, assesses primary disease process, identifies complications like pseudocyst or vascular thrombosis with high sensitivity and specificity, guides therapeutic management decisions, and provides images with isotropic resolution within seconds [5]. However, conventional MDCT has certain limitations such as the need to acquire an unenhanced phase for measuring enhancement, radiation dose concerns for longitudinal monitoring, debatable contrast-media associated kidney injury, and limited role in small iso-attenuating lesions and minimal change pancreatitis [6,7]. Moreover, MDCT is reserved to provide predominantly morphological (e.g. calcifications or organ size) rather than functional information such as assessment of parenchymal fibrosis, inflammation and loss of acinar function [8]. Therefore, there is a need to develop and validate clinically translatable imaging-based biomarkers that extends its capabilities to provide functional information due to its potential to be a robust quantitative tool that is readily available and non-invasive. Several technical developments have been made in MDCT technology to address the above-mentioned limitations viz; acquisition parameters, contrast injection protocols and image reconstruction techniques. The emerging applications of radiomics and artificial intelligence (AI) is also poised to extend the current capabilities of imaging.
MRCP Imaging
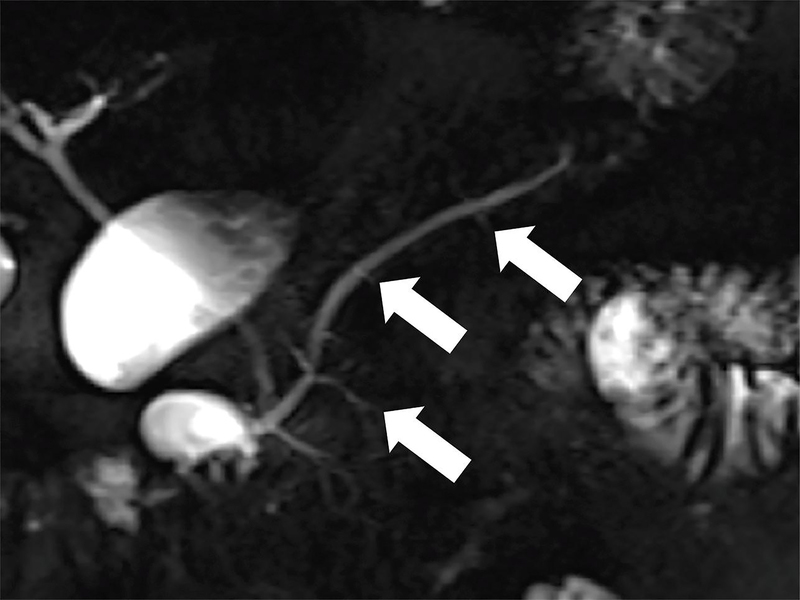
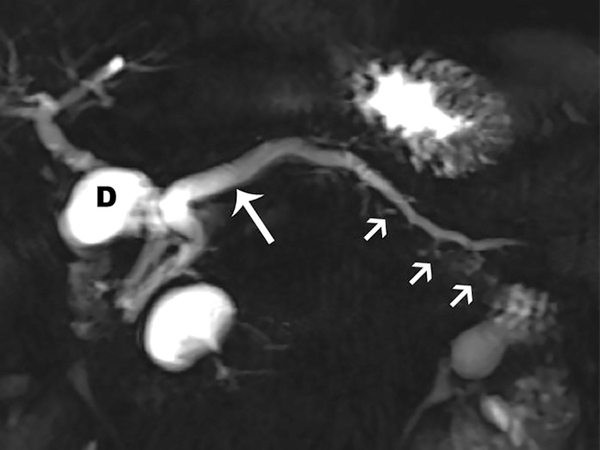
Magnetic resonance cholangiopancreatography (MRCP) is the most effective, safe, non-invasive MR imaging technique for evaluation of the pancreaticobiliary ductal system. MRCP has significantly improved over the past two decades and is mainly based on acquisition of heavily T2-weighted images, with variants of fast turbo spin echo sequences [9]. Since its first clinical application, this technique has undergone several refinements to improve the spatial resolutions, contrast-to-noise ratio, and image acquisition times. Administration of secretin improved the diagnostic yield of MRCP in evaluating the pancreatic duct for structural abnormalities (Figure 1) [9,10]. Secretin (example: ChiRhoStim®, ChiRhoClin Inc, Burtonsville, MD; Secrelux, Sanochemia) is a purified synthetic peptide with an amino acid sequence identical to the naturally occurring hormone and is approved by FDA for stimulation of pancreas during ERCP. Secretin’s physiological effects include secretion of pancreatic fluid from acinar cells into the duodenum and transiently increasing the tone in the sphincter of Oddi, which improves the visualization of the pancreatic duct. The peak effect of intravenous secretin is usually observed after three to five minutes following the injection [11]. After injection of secretin, the pancreaticobiliary ductal system is imaged via a coronal single-shot turbo spin echo image which takes only two seconds, repeated every 30–60 seconds for up to 10 minutes. At this time, the caliber of the main pancreatic duct can increase by 1 mm or more, compared to the baseline. Loss of main pancreatic duct distensibility (a surrogate for reduced compliance) is used as a marker for chronic pancreatitis [12]. Distention of the main pancreatic duct during Secretin-enhanced MRCP (S-MRCP) helps in identifying ductal strictures [13]. Secretin enhances visualization of side branches, which may be helpful in the diagnosis [14] since one of the earliest findings of CP is abnormal side branch dilatation.
Figure 1.
Coronal MRCP images in a 42-year-old patient with CP. (a) Image shows more than 3 ectatic side branches (arrows) compatible with mild CP, Cambridge grade 2. (b) This image was obtained in the same patient following injection of secretin. There is dilatation of the main pancreatic duct (long arrow) as well as an increase in the number and conspicuity of the ectatic side-branches (short arrows). These findings are compatible with moderate CP, Cambridge grade 3. (D= fluid in the duodenal bulb)
S-MRCP can also provide an estimate of the pancreatic excretory reserve. It is important to remember that a normal filling of the duodenum with pancreatic fluid does not exclude impairment of pancreatic exocrine function. The most reliable (although not perfect) method of assessing exocrine dysfunction is by measuring bicarbonate level of the pancreatic fluid [12] which is collected during endoscopic pancreatic function test. S-MRCP assesses pancreatic excretory fluid reserve by grading the excreted fluid according to duodenal anatomy. Grade 1, when pancreatic fluid is confined to the duodenal bulb, grade 2 when fluid is seen up to the second portion, grade 3 when fluid is seen in the third portion of the duodenum and grade 4 fluid reaches the fourth portion of the duodenum and beyond. Diminished pancreatic exocrine function is suspected with grade 1 duodenal filling or in the absence of duodenal fluid accumulation in the duodenal lumen [12]. Duodenal filling grade has been reported to have sensitivity of 72% and specificity of 87% for the detection of exocrine function [12,11]. However, its sensitivity has been found to be as low as 55% for detection of early CP [15].
One of the limitations of the MRCP is that it uses Cambridge classification for diagnosis and severity grading of CP (Table 1). Cambridge classification was designed for endoscopic retrograde cholangiopancreatography [16] and has reported poor sensitivity for the detection of early CP [17]. Other reports indicated that pancreatic exocrine dysfunction precedes the ductal changes in the disease process [15]. A study compared the presence of exocrine dysfunction (verified by endoscopic pancreatic function testing) to MRCP and showed that ductal imaging did not identify early CP in 91% of patients. In other words, the majority of MRCPs were classified as normal/equivocal using the Cambridge classification as the diagnostic criterion, while these patients already had exocrine dysfunction. [15].
Table 1.
Cambridge Classification.
| Cambridge Classification | Main PD | Abnormal side branches |
|---|---|---|
| Grade 0 (Normal) | Normal | None |
| Grade 1 (Equivocal) | Normal | Fewer than 3 |
| Grade 2 (Mild CP) | Normal | 3 or more |
| Grade 3 (Moderate CP) | Abnormal | More than 3 |
| Grade 4 (Severe CP) | Abnormal | One or more of large cavity, obstruction, filling defect, severe dilation or irregularity |
Magnetic Resonance (MR) Imaging
In addition to reporting ductal abnormalities, MR can evaluate the parenchymal changes related to CP. There are MR imaging techniques that can detect loss of proteinaceous water content, restricted water diffusion, increased stiffness, and changes in the enhancement pattern that can be helpful for the detection of fibrosis in the pancreas. In addition to these advanced imaging techniques, quantitative MRI is becoming increasingly common in current radiology research and practice, assisting in the clinical assessment of many patients with a spectrum of diseases.
T1-Weighted Imaging
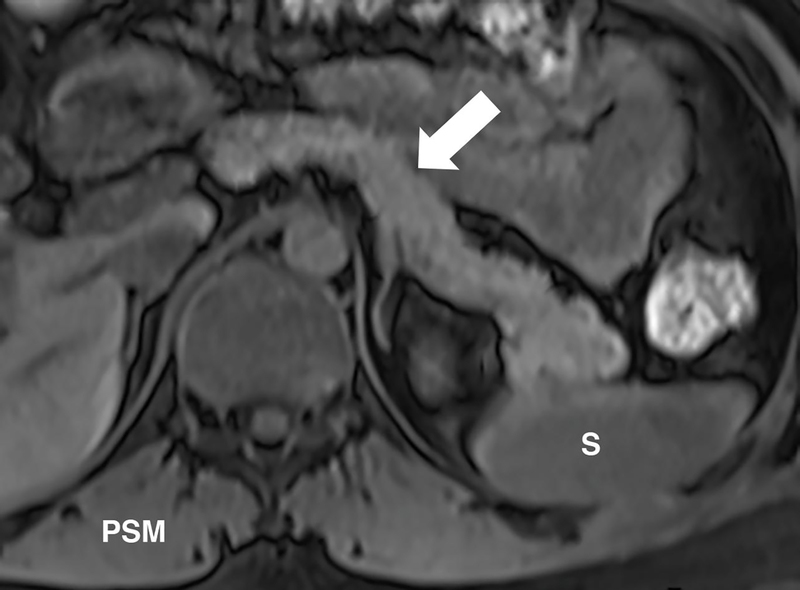
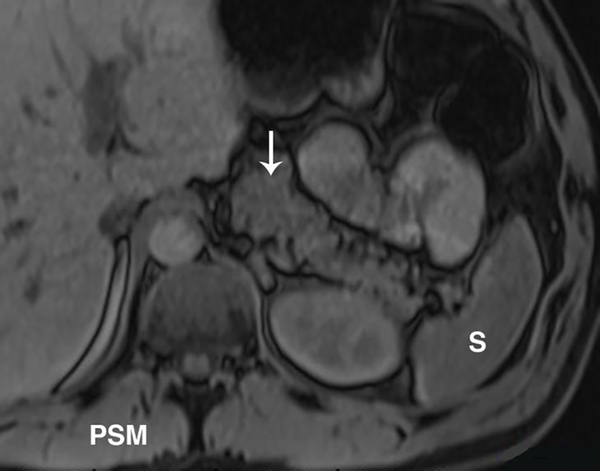
Due to the high protein content of the normal pancreas, pancreas typically appears hyperintense on T1-weighted images [18]. This finding is best appreciated on unenhanced, fat suppressed, T1-weighted images [19–21] (Figure 2). In CP, the normal pancreatic parenchyma rich in protein is reduced, and acinar cells become replaced by fibrosis [22]. T1-weighted signal is assessed by comparing the brightness of the pancreas to a reference organ. The signal intensity ratio (SIR) is calculated by dividing the average signal intensity of pancreas with either spleen or paraspinal muscle; SIR = SI Pancreas / SI Reference. Decreased SIR of the pancreas has been shown to reflect the degree of fibrosis and loss of normal acinar tissue and holds promise for the diagnosis of CP [23,24,15]. A recent study found a significant positive correlation between pancreatic fluid bicarbonate level and SIR of the pancreas to the spleen (p<0.0001). A pancreas to splenic SIR threshold of less than 1.2 had sensitivity of 77% and specificity of 76% for detection of low pancreatic fluid bicarbonate, i.e., pancreatic exocrine dysfunction [15]. These results concurred with the previously reported poor sensitivity of the Cambridge classification for the detection of early CP [17] and suggested that Ti imaging can be a clinically useful and relatively cost-effective test for detection of early chronic pancreatitis even when the ductal imaging is normal. However, limitations exist in conventional T1-weighted imaging in which the tissue contrast depends on multiple factors including acquisition parameters, receiver coil geometry and sensitivity and signal amplifier gains. Variation in signal intensity is commonly observed through the choice of pulse sequence and manipulation of acquisition parameters (e.g., flip angle, echo time, repetition time, inversion time, etc.). These limitations preclude any direct comparisons of intensity values across subjects, time-points or imaging centers.
Figure 2.
T1-weighted signal of the pancreas changes with CP. Unenhanced, fat suppressed, gradient echo image of the abdomen can be used to detect the parenchymal changes secondary to CP. Normally, the signal of the pancreas is brighter than the spleen or paraspinal muscle (PSM). (a) Axial image in a patient with no CP and shows relatively higher signal of the pancreas (arrow) compared to the spleen (S). Signal intensity ratio can be obtained by taking the ratio of the pancreas to the spleen, or the paraspinal muscle. (b) Axial image in a patient with known CP and shows a similar signal to the spleen and paraspinal muscle. A pancreas to splenic SIR threshold of <1.2 was shown to be 77% sensitive and 76% specific for the diagnosis of CP.
T1 mapping
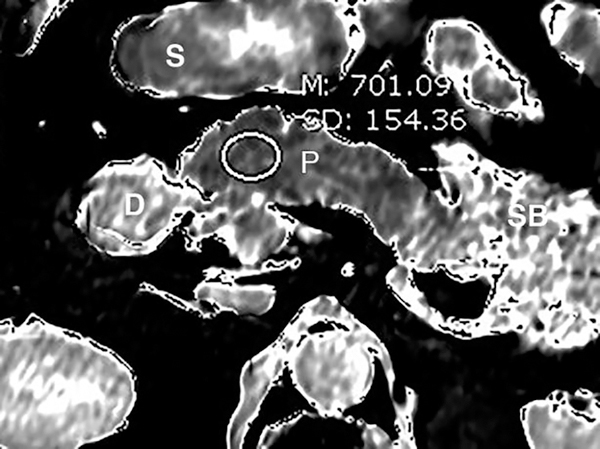
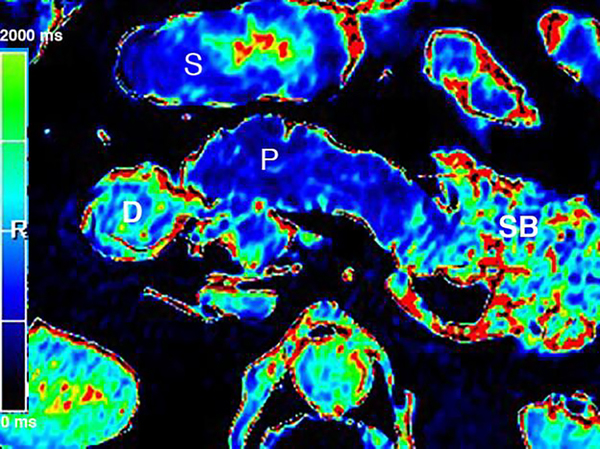
T1 mapping is a quantitative MR imaging technique, which allows us to measure the tissue-specific T1 relaxation time of the tissues. T1 mapping may be a more reliable method compared to traditional T1-weighted images since quantitative nature of the data allows ready comparison across longitudinal time points and against population-derived norms, permitting a more meaningful interpretation of intensity changes. Furthermore, utilizing the recently introduced fast pulse sequences, T1 mapping takes less time to perform compared to other imaging techniques such as DWI or S-MRCP. Multiple T1 mapping pulse sequences are available either as a product version or prototype sequence under development by the manufacturers (Figure 3). Currently, there is no consensus about which T1 mapping pulse sequence is ideal for abdominal imaging. A recent study compared 4 different pulse sequences for the imaging of pancreas; variable flip angle (VFA), modified look-locker inversion recovery (MOLLI), a prototype inversion recovery (IR-SNAPSHOT), and a prototype saturation recovery single-shot acquisition (SASHA) [25]. The principle of variable flip angle (VFA) pulse sequence is to quantify T1 by acquiring voxel signals at steady state using multiple flip angles [26]. Inversion recovery (IR-SNAPSHOT) is based on the relaxation of longitudinal magnetization after an inversion radio frequency (RF) pulse is applied. A series of quick acquisitions are collected at different delay times following the inversion RF pulse and signal at different delays are fitted using the relaxation model [27]. MOLLI is a commercially available sequence developed for myocardial imaging and uses the very similar but modified principle of IR-SNAPSHOT. Series of acquisition following the inversion RF are segmented and synchronized using ECG signal so that the data acquisition only occurs during the diastolic period of a cardiac cycle [28]. SASHA is also similar to IR-SNAPSHOT, except it utilizes a saturation RF pulse instead of an inversion RF pulse [29]. This study reported that MOLLI, SASHA, and IR-SNAPSHOT provided the highest precision, while VFA has relatively less but still substantial precision. MOLLI and SASHA were originally designed for myocardial imaging and provided only one image in one breath hold time while IR-SNAPSHOT can acquire three images. Obtaining 1–3 images per breath hold can be a disadvantage for pancreas, which may shift in location with each breath hold. The advantage of VFA sequence is fast 3D acquisition, generating 64 slices in one breath hold. The disadvantage of VFA is the inherent sensitivity to pulsatile flow within the aortic blood. This study concluded that more refinement of pulse sequences is necessary to provide a large spatial coverage in one breath hold together with high precision in abdominal imaging.
Figure 3.
T1 relaxometry of the pancreas provides quantitative evaluation of the CP. (a) Axial grayscale T1 map of the pancreas (P) obtained at 3T. The mean T1 in the pancreatic head measures 701 ms. Preliminary studies reported that T1 >900–950 ms could be used as the threshold for CP, while the median T1 in general population was around 717 ms. (b) Axial T1 map in a colorscale format. The intensity of the pancreatic signal can be visually assessed by comparing to the scale. (S=stomach, SB=small bowel, D=duodenum)
A potential benefit of quantitative MR imaging is that it can be a biomarker for a spectrum of diseases. In order to transform these potential benefits into the clinical practice, more studies are required to determine normal T1 of abdominal organs and reach a consensus on the amount of change that should be considered as clinically significant pathology.
Extracellular Volume Imaging (ECV)
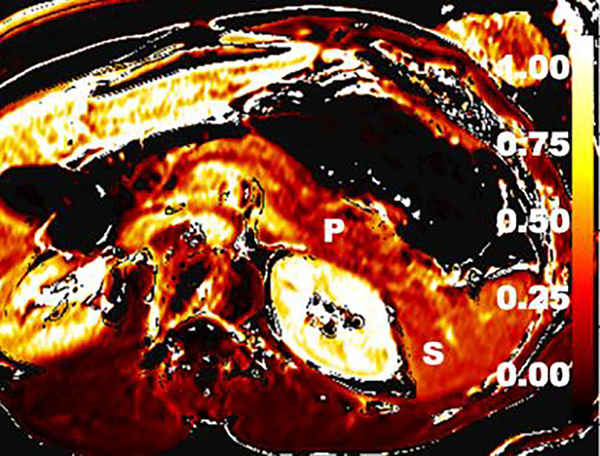
ECV is a quantitative MR imaging method that exploits changes to the extracellular matrix, such as increased collagen [33,34] and proteoglycan [35] concentrations secondary to tissue fibrosis. Utilizing tissue and blood plasma concentration of gadolinium, ECV technique dichotomizes the tissues into intra- and extracellular spaces and reports the extracellular fraction, which can be depicted as pixels on an image (Figure 4). T1 relaxation times obtained from the pancreas and the aortic lumen (blood pool) in unenhanced and post-contrast equilibrium phases are entered into the formula to calculate the ECV fraction;
where ΔR1pancreas and ΔR1blood are defined as the change of 1/T1 relaxation rate in pancreas and blood pool relaxivity before and after contrast administration, T1 is a time constant describing the longitudinal relaxation rate, and its reciprocal (1/T1), is referred to as R1. The change in R1 (ΔR1) is defined as: ΔR1 = (R1post-contrast) – (R1pre-contrast). ΔR1 is proportional to Gadolinium (Gd) concentration when both tissues are in equilibrium; ΔR1pancreas / ΔR1blood = [Gd]pancreas / [Gd]blood. Since the gadolinium chelates are extracellular agents, the ratio of contrast agent concentrations between the pancreas and blood equals the ratio of extracellular volume between the tissues: [Gd]pancreas / [Gd]blood = ECVpancreas / ECVblood. The ECV of the blood is defined as the fraction of the blood volume, which is not composed of blood cells (i.e., the fraction of plasma). The plasma volume is simply calculated as ECVblood = [1 – hematocrit].
Figure 4.
Extracellular volume (ECV) imaging of the CP. ECV imaging technique utilizes T1 maps obtained before and after MR contrast enhancement. This axial color map image depicts calculated ECV fraction. A preliminary study showed that ECV threshold of >0.27 had 92% sensitivity and 77% specificity for CP. (P=pancreas; S=spleen)
A recent study performed on patients with no pancreatic disease reported median T1 on 1.5T as 654 ms; median T1 on 3T as 717 ms; median ECV on 1.5T as 0.28 and median ECV on 3T as 0.25 [30]. There was a mild positive correlation of T1 (r =0.24) with age. ECV was not dependent on magnet strength. T1 and ECV were similar in both genders.
Alterations of tissue T1 have been observed in the presence of a variety of pathologic conditions in the abdomen, including CP [31,32]. A recent study performed using 3T showed that T1 >950 ms had 64% sensitivity and 88% specificity, while ECV >0.27 had 92% sensitivity and 77% specificity [32] for diagnosis of CP. Combining ECV and T1 yielded sensitivity of 85% and specificity of 92% (AUC: 0.94) [32]. Another study performed using 3T showed T1 >900 ms threshold to be 80% sensitive and 69% specific for the diagnosis of mild CP (AUC: 0.81) [31].
Diffusion-Weighted Imaging (DWI)
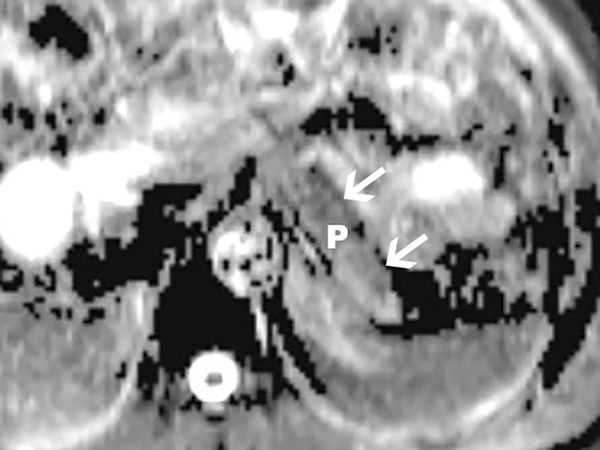
In DWI, the signal intensity reflects the free motion or diffusion of water molecules. The practicality of this technique is challenged by long acquisition times (Figure 5). In fibrotic tissues, as in CP, the apparent diffusion coefficient (ADC) value is expected to be lower. In a study of 89 patients with no CP, mild CP and severe CP (defined by MRCP using Cambridge criteria), ADC of less than 179 × 10−5 mm2/sec at 1.5T was helpful for differentiating normal pancreas from CP groups [36]. This result suggested that there was restricted diffusion in the pancreatic extracellular fluid in subjects with severe CP compared to controls. Another study using a 3T scanner, an ADC cutoff value of 220 × 10−5 mm2/sec was found to be the most accurate threshold level for differentiating healthy subjects from those with any degree of CP [37]. In both studies, differences in ADC could not be used to reliably differentiate between the grades of CP. A more recent study of 29 patients with pancreatobiliary tumors undergoing pancreatectomy found that lower ADC values were associated with pancreatic fibrosis (r2 = 0.66, p<0.001) and correlated with grade of pancreatic fibrosis [24]. However, it should be noted that ADC can vary depending on the imaging parameters used and may not be translatable across different platforms.
Figure 5.
Diffusion-weighted imaging (DWI) of the pancreas obtained using b values of 0 and 500 in a 1.5T scanner. Apparent diffusion coefficients (ADCs) in the pancreas are reduced in patients with CP. Axial ADC map of the pancreatic body and tail (arrows) is shown. Measurements made on the ADC map may reflect tissue fibrosis in patients with suspected CP.
MR Elastography (MRE)
MRE of the liver has been shown to be very helpful in the evaluation of hepatic fibrosis [38]. Hardware and software for MRE of the pancreas is still under development and not yet commercially available. In a pilot study, twenty healthy volunteers underwent MRE exams to determine pancreatic stiffness using an experimental MRE driver emitting lower frequency vibrations than those used in liver MRE [39]. The 3D pancreatic MRE provided promising and reproducible stiffness measurements throughout the pancreas (Figure 6). The mean shear stiffness was (1.15 ±0.17) kPa at 40 Hz, and (2.09 ±0.33) kPa at 60 Hz [39]. Another pilot study performed on healthy volunteers showed pancreatic stiffness measurements to be highly reproducible and increases linearly with age [40]. In these preliminary studies, 3D spin-echo echo planar imaging sequence was employed to obtain 3D wave information along with 3D spatial data. As the pancreas is much further away from the anterior abdominal wall, shear waves at 40 Hz are favored [39]. An ongoing multi-institutional study aims to verify that MRE can produce reproducible stiffness measurements throughout the pancreas using different vendor platforms, potentially allowing for quantitative assessment of CP [41].
Figure 6.
MRE of the pancreas. Images were obtained in a volunteer with the vibrational frequency of 60Hz. A T2 localizer along with snapshots of curl processed waves to remove the longitudinal waves along one of the encoding directions and the stiffness map overlaid on the T2 localizer with a mean stiffness of 1.35kPa in the pancreas. Reprinted by permission from Springer, Abdominal Radiology, Magnetic resonance imaging as a non-invasive method for the assessment of pancreatic fibrosis (MINIMAP): a comprehensive study design from the consortium for the study of chronic pancreatitis, diabetes, and pancreatic cancer, Tirkes et. al., Copyright 2019.
Pancreatic fat fraction
The consequences of pancreatic steatosis require further evaluation, and MR allows for excellent quantitative assessment of fat deposition in the tissues. Chemical shift imaging techniques utilize a concept that water and fat protons have different resonance frequency, that can be measured at certain echo times to obtain water-only and fat-only fractions. Two-point Dixon is a practical technique with excellent image resolution and is routinely used to obtain T1-weighted in-phase (IP), out-of-phase (OP), water-only, and fat-only images. The pancreatic fat signal fraction (FSF = SIfat / SIfat + SIwater) can be calculated by measuring the signal intensity (SI) in localized regions of interest on the fat-only and water-only images. Recently, newer MR software has allowed more complex sequences (multi-echo acquisition) to obtain a quantitative proton density fat fraction (PDFF) map. PDFF is the preferred imaging sequence for the liver steatosis since it has the advantage of detecting liver hemosiderosis. To ensure a reliable assessment of quantitative fat, T1 bias and T2* correction should be utilized [42,43].
It is well known that CP is associated with higher pancreatic fat fraction [44]. Patients with CP show higher pancreatic fat fraction compared to patients with no CP. A study was performed on a large healthy volunteer population in Europe reported the normal pancreatic fat fraction as 4.4% [45]. In the US, fat fraction in the general population is reported to be between 8.3% [31] to 14% [44]. This variation probably depends on several factors, including but not limited to the reported positive correlations with age (r=0.28) [31] and visceral adiposity (r=0.54) [44].
Computerized Tomography
Multi-detector Computerized Tomography
Low kVp (70–110kVp) technique is available on a majority of the current commercially-available scanners by major vendors. These acquisitions are possible due to improvements in x-ray generator and tube hardware in the recent years. New scanners have a higher performance and, depending on the scanner, a power reserve as high as 120kW and maximum tube capacity of up to 1300 milliamperes (mA). These high mA tubes are essential for low kVp acquisitions in order to maintain optimal image quality. Addition of filters at the tube also improves image quality of low kVp acquisitions by removing low-energy photons [46].
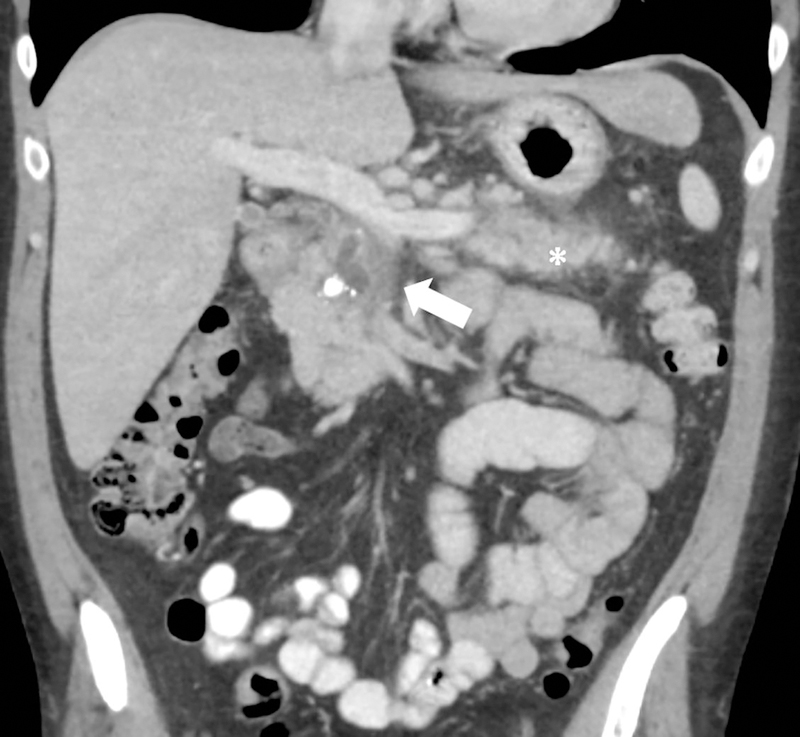
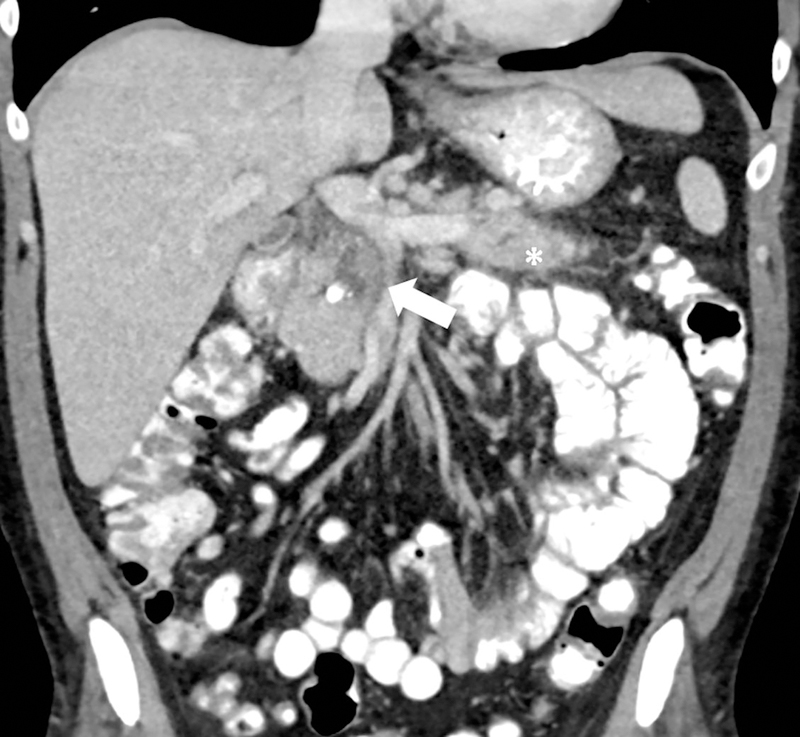
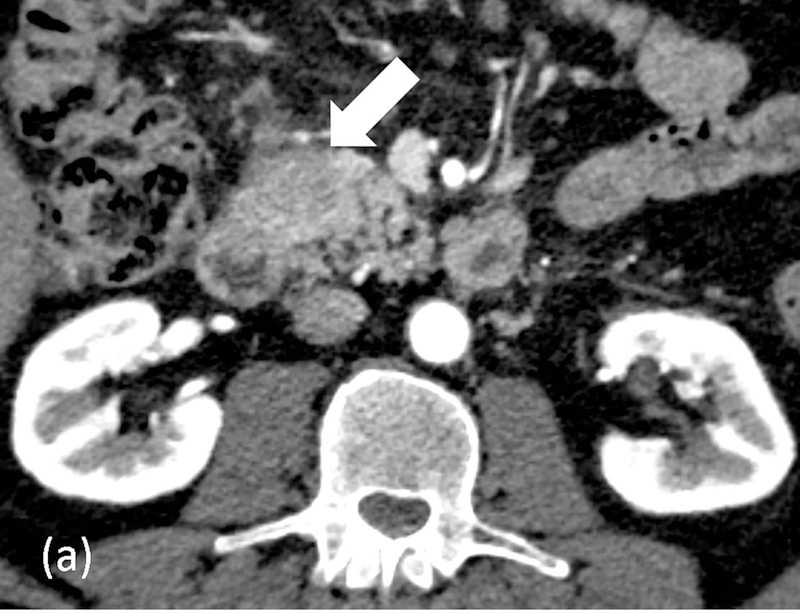
Low kVp acquisitions are a desirable practice endeavor since it results in increased contrast depiction. In general, the attenuation of iodine is two times higher at 80kVp than 140kVp [47]. The increased contrast-to-noise ratio (CNR) on low-energy images improves the conspicuity of hypo- and hyper-enhancing lesions against the background parenchyma and independent investigations have revealed a higher parenchyma-to-tumor CNR at low kVp [48–50]. 80kVp images also accentuate the differences between areas of pancreatic necrosis and normal parenchyma improving qualitative assessment [51]. This technique also enhances vascular delineation which is important for surgical planning and detecting CP-related complications such as thrombosis and pseudoaneurysms. Low kVp can therefore be used to boost iodine distribution when contrast opacification of the structure of interest is suboptimal. Both applications are useful in CP as studies have shown a strong link between the development of pancreatic adenocarcinoma (PDAC) in a setting of CP, especially hereditary pancreatitis; and an incidence of up to 10–20% for pseudoaneurysms in CP [52]. Another advantage of low kVp scan is radiation dose reduction (Figure 7). In the abdomen, a change from 120kVp to 100kVp or 80kVp results in a dose reduction by approximately 26% or 41% respectively [53,50]. Radiation exposure is a concern in CP patients, especially if CT is going to be used for serial monitoring of this chronic disease state as outlined by two ongoing prospective observational cohort studies in adult and pediatric patients [54,55]. Therefore, efforts for using dose-optimized protocols are relevant in CP imaging to prevent high cumulative radiation exposure.
Figure 7.
Low kVp technique. 46-year old male with acute-on-chronic pancreatitis underwent contrast-enhanced CT at (a) 120kVp and (b) 100kVp three days apart. At the same window width and window level, the hypoenhancing area in the pancreatic head (arrow) and ductal margins in the pancreatic body are more conspicuous at 100 kVp than 120 kVp. Volumetric CT-dose index at 120kVp and 100 kVp were 13.8mGy and 9.5mGy respectively. Note the increased attenuation of iodinated oral contrast media at 100kVp. There was an interval improvement in peripancreatic fat stranding around the tail (asterisk).
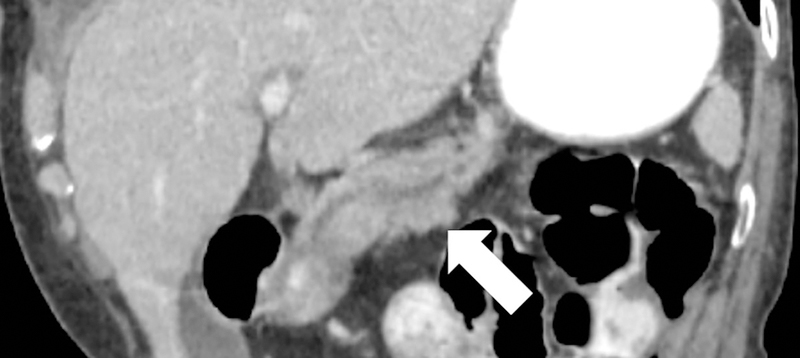
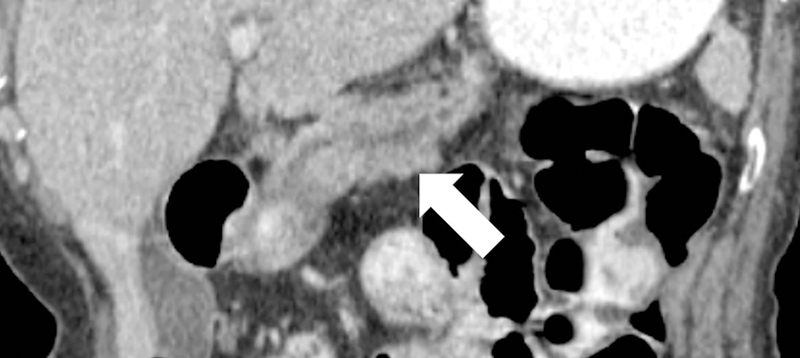
Filtered back projection (FBP) has been the conventional method for CT image reconstruction. Improved computational power led to the introduction of iterative reconstruction (IR) techniques into clinical routine in 2009. IR reduces image noise for the same radiation dose, or alternatively allows for radiation dose reduction for the same image quality [56]. This has been demonstrated in phantom and clinical settings for pancreatic evaluation (36–60% radiation dose saving), even on wide-16cm-detector systems [57–61]. A specific type of IR known as model-based IR can further reduce radiation dose by up to 75% [60]. Lin et al. evaluated 1.25 thin axial pancreatic phase CT images and found that IR-reconstructed images, especially model-based IR, better depicted the pancreatic duct [62]. This improved spatial resolution and sharpness of IR-reconstructed images (Figure 8) may have a potential role in detecting variant ductal anatomy like pancreatic divisum or early ductal changes of CP. Yasaka et al evaluated the detectability of pancreatic calcifications on dose-reduced unenhanced CT with IR [63]. They found that at low-dose IR images had higher performance than FBP and although model-based IR had a high sensitivity at ultra-low dose (mean volumetric CT dose index 0.70mGy), a low specificity was observed.
Figure 8.
Impact of iterative reconstruction. 69-year old female with ductal dilatation underwent contrast-enhanced CT. On 1.25mm image reconstructions, the ductal anatomy and resolution is improved with (a) iterative reconstruction compared to (b) conventional filtered back projection reconstruction.
The use of IR needs familiarization. A gradual adoption into clinical practice is thus advocated for these reconstructions for optimal reader confidence [64]
Dual-energy Computerized Tomography
Since the first commercial dual-energy CT (DECT) scanner was available in 2006, there have been a multitude of advancements [65]. The currently available DECT platforms are either source-based (rapid kV switching, dual-source, split-beam) or detector-based (dual-layer and photon-counting). Among these, photon-counting CT is the latest technology and is not yet approved for routine clinical use. Details on the technical principles and applications of DECT (also known as spectral CT or multi-energy CT) are vastly described in literature and not detailed here.
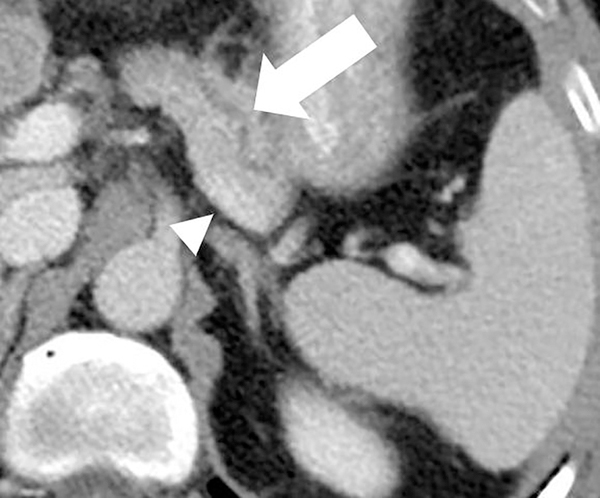
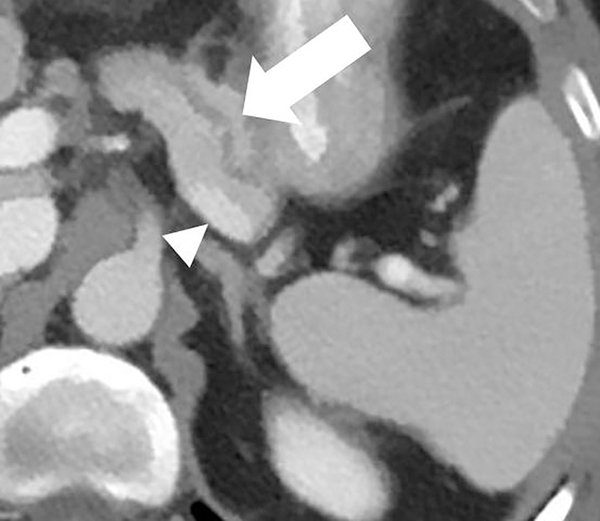
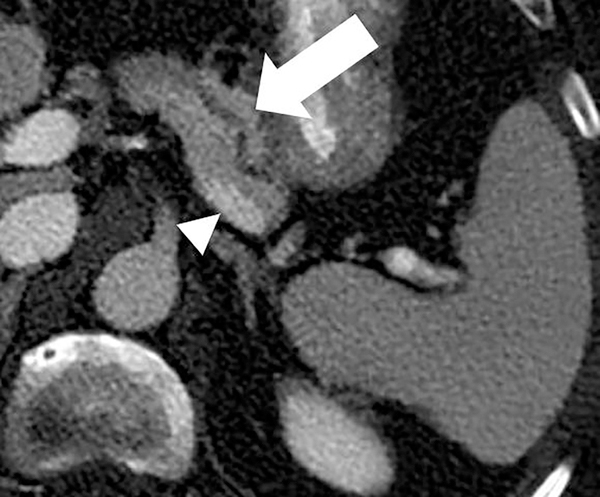
DECT is being used increasingly in clinical routine due to the umpteen applications of the different image reconstructions that can be post-processed from one scan. Virtual monochromatic images can be reconstructed at different kilo-electronvolt (keV) levels, ranging from 40keV to 200keV, depending on the DECT technique. Just like on low kVp images, the attenuation of iodine increases at low keV (40–65keV). A large body of independent authors have shown an objective and subjective preference of low keV images for pancreatic applications [66–69]. Specifically, 50–55keV images show a high CNR between pancreatic tumor to parenchyma compared to conventional 120kVp images, decreasing the amount of contrast media required [66–68,70,71]. Low keV images have also been shown to improve detection of small and isoattenuating PDACs compared to conventional CT [72,71]. Besides improving the visualization of vessels as described earlier, low energy (both keV and kVp) images also improve the visualization of pancreatic duct (Figure 9) [73,74,72]. Ductal abnormalities are a hallmark of CP therefore assessment of caliber, detection of intraluminal stones and pancreatic divisum are important considerations for evaluating CP [75]. On the other hand, high energy keV images (110–140keV) show reduced contrast and noise. High keV images and DECT-based metal artifact reduction algorithms can thus reduce stent- and clip-related artifacts providing an optimal viewing of adjacent pancreatic parenchyma [76]. Majority of the pancreatic calculi in CP are discernable on CT since they are radiopaque. But 5–8% calculi that are either radiolucent or mixed may not be identifiable on conventional single-energy CT [77]. It is important to detect such stones for diagnosing CP as well as guiding therapeutic decisions since they may not be amenable to fluoroscopy-based interventions [78]. Both low and high keV images have been shown to unmask low-attenuating cholesterol gall stones on DECT [79,80]. Though pancreatic stones vary in their composition from gall stones and contain layers of elements like nickel, iron, chromium and calcium carbonate, virtual monochromatic images may have a role in visualizing radiolucent pancreatic calculi [78]. However, formal analysis for this application is needed.
Figure 9.
Dual-energy CT for pancreatic evaluation. 53-year old male underwent contrast-enhanced dual-layer dual-energy CT. The pancreatic ductal (arrow) anatomy and margins are better delineated at (b) low-energy (50keV) and (c) material-density iodine (MD-I) images than conventional (a) 120kVp images. Note the clarity of splenic vein (arrowhead) on 50keV and MD-I images compared to 120kVp.
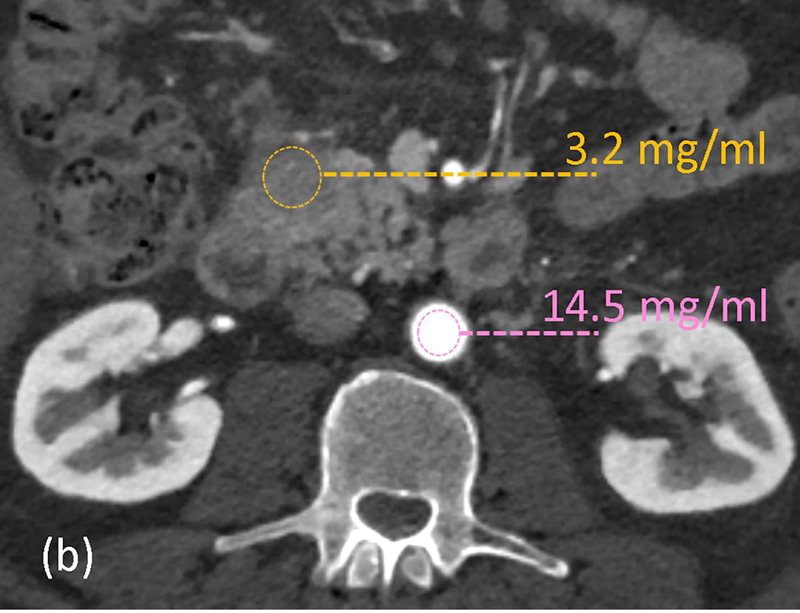
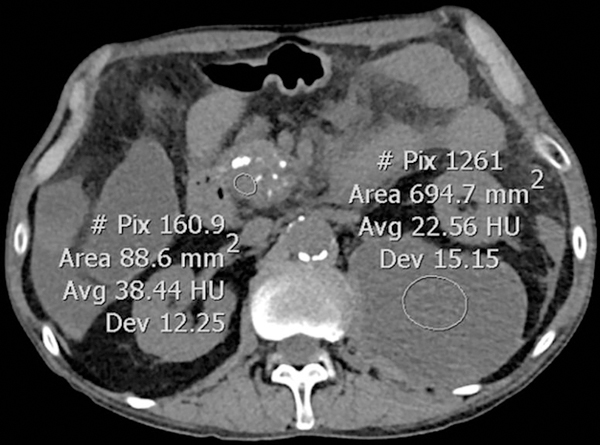
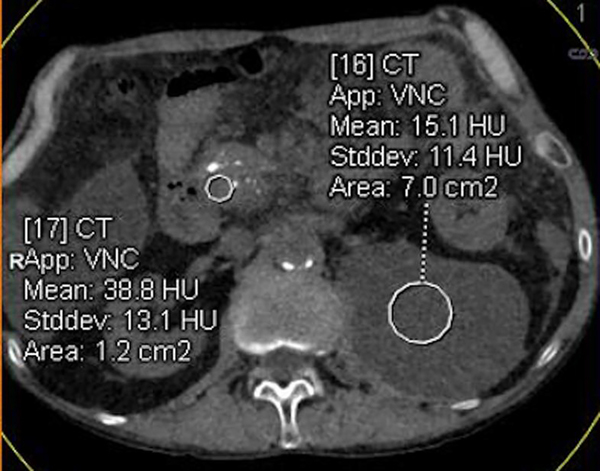
DECT-derived material-density iodine (MD-I) images selectively depict areas of iodine uptake while nulling the attenuation of underlying soft tissue. MD-I images have been shown to improve reader confidence for detecting tumor and vascular involvement since they have a higher signal-to-noise ratio and CNR compared to low keV and conventional 120kVp images [68,81,82]. In a subjective study evaluating pancreatic tumors, Chu et al found that MD-I images added value in 50% cases by improving lesion conspicuity, increasing discernment between cystic and solid areas and evaluating ductal relationship to adjacent vessels [82]. MD-I images are also helpful in problem solving [83], identifying areas of extravasation from bleeding pseudoaneurysms, venous thrombosis, differentiating contrast from other high-density materials like debris or hemorrhage and visualizing pancreatic head parenchyma that may be obscured by metal-related artifacts from biliary stents [73,84]. Another benefit of MD-I image is the availability of a reliable quantitative metric for enhancement (iodine concentration; IC in mg/ml). Absolute values and ratios (e.g., normalized iodine concentration; NIC = region of interest to aorta) have been shown to diagnose and distinguish between different pancreatic pathologies based on histopathology [85,71]. Mean NIC for PDAC is significantly lower than normal pancreas [71]. In a study evaluating 15 patients with chronic mass forming pancreatitis and 20 with PDAC, NIC was found to have the best discriminating capability with a sensitivity of 86.7–93.3 % and specificity of 89.5–94.7%, depending on the phase of acquisition (Figure 10) [85]. Discriminating between the two is important as up to 30% of CP cases can have focal enlargement of pancreas and ductal signs cannot reliably distinguish the two conditions [86]. Another DECT image reconstruction useful in imaging CP is virtual unenhanced image (VUE). VUE are virtually derived from a contrast-enhanced acquisition by suppressing iodine containing voxels. For pancreatic applications, subjective studies report VUE to possess slightly inferior to excellent image quality compared to true unenhanced images (TUE) [87,82,88]. Despite the disparate ratings, >90% VUE images were considered as an acceptable replacement for TUE by all readers [88,82]. Objectively, there is a good correlation of pancreatic attenuation (HU) between TUE and VUE, with a difference ranging between 1–5HU[88,89]. VUE has thus been recommended as a TUE-surrogate for pancreatic imaging by a multi-institutional expert panel [90]. Notably, replacement of TUE with VUE can lead to a minimum radiation dose saving of ~21% [88,65]. VUE can ascertain the presence of enhancement and delineate the presence of hemorrhage within pseudocyst or from a ruptured pseudoaneurysm. While these images can detect calcifications (Figure 11), partial subtraction of calcifications in the liver and gall stones have been reported [91,92]. Further assessment is required for pancreatic calcifications.
Figure 10.
Quantitative imaging with dual-energy CT. 62-year old male with abdominal pain underwent arterial-phase contrast-enhanced rapid kV switching dual-energy CT. (a) 70keV images show a hypoattenuating area in the uncinate process. Iodine concentrations (in mg/ml) measurements were obtained on the (b) material-density iodine images from the lesion (yellow) and aorta (pink). The normalized iodine concentration (lesion-to-aorta) was 0.22 and serology confirmed the diagnosis as autoimmune pancreatitis.
Figure 11.
Virtual unenhanced images for quantitative and qualitative assessment. 63-year old male with chronic pancreatitis underwent dual-source dual-energy CT. (a) True-unenhanced (TUE) acquisition and (b) virtual-enhanced (VUE) reconstruction. The attenuation (HU) measurements between TUE and VUE are comparable and pancreatic head calcifications are adequately visualized on VUE. Note the partial subtraction of small calcific foci within the pancreas and anterior aortic wall on VUE.
Perfusion CT
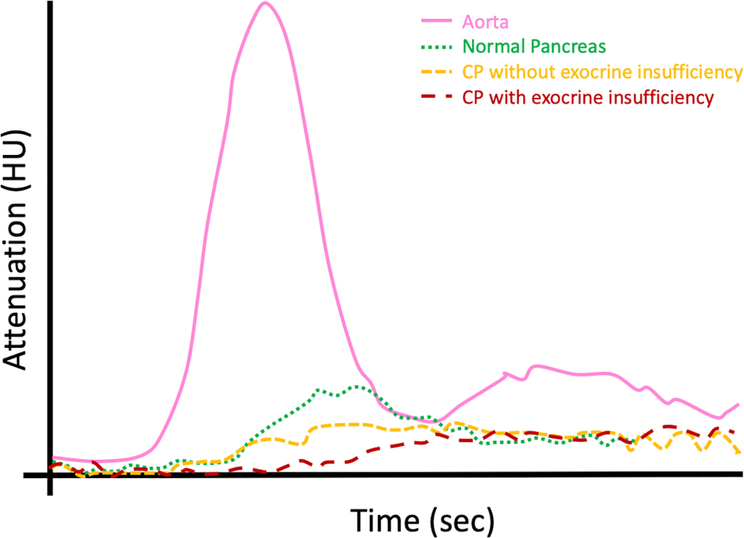
Perfusion CT is a promising technique for assessing tissue viability, biology and detecting small tumors [93–97]. Kinetic modeling of the dynamic acquisition provides quantitative physiological metrics like blood volume (BV), blood flow (BF), time to peak (TTP) and time-attenuation curves (TAC) to detect microvascular changes. Normal parenchyma shows rapid initial enhancement and rapid washout [98]. In contrast, CP without exocrine insufficiency demonstrates lower BF and BV with longer TTP and gradual increase in parenchymal enhancement. CP with exocrine insufficiency has an even lower perfusion and more gradual enhancement than without insufficiency [98]. Perfusion CT may therefore be used to rule out exocrine pancreatic dysfunction (Figure 12). BF and BV have also been shown to differentiate chronic mass forming pancreatitis from PDAC [99,100]. Perfusion CT remains in the research phase for pancreas due to higher radiation dose, and limited field of view. Lower radiation dose can be achieved by reducing tube voltage and using IR [101–103].
Figure 12.
Perfusion CT curves in CP. Graphical plot depicting the time-density curve (attenuation on x-axis; time on y-axis) for normal pancreatic parenchyma and chronic pancreatitis (with and without exocrine insufficiency).
Molecular Imaging
The most common radiotracer used for PET-CT is 18F-fluorodeoxyglucose (FDG). FDG-PET/CT in CP is generally reserved for problem-solving or therapeutic monitoring. Autoimmune pancreatitis (AIP) is a distinct subtype of chronic pancreatitis and a known imaging mimic for PDAC [104]. Pattern of FDG uptake on PET/CT can distinguish ‘ordinary’ CP (no uptake) from AIP (multifocal uptake with/without extra-pancreatic involvement) and PDAC (focal uptake) to prevent unwarranted pancreaticoduodenectomies [105,106]. Nevertheless, serum IgG4, CA19–9, histology and multi-modal imaging evaluations may be warranted for diagnosis [107,108]. False-negatives may be seen with FDG-PET in patients with poor glucose control and hypometabolic tumors, which is often seen in pancreatic diseases and PDAC, therefore new tracers and PET/MR are being evaluated for this indication [104,109].
So far, studies have shown CT and PET/MR are complementary for PDAC evaluation, with CT being preferred for locoregional status and PET/MR for distant metastasis [110]. Though PET/MR improves soft tissue contrast and ductal visualization, and anecdotal cases describe the feasibility to differentiate CP from PDAC, further confirmation and more clinical studies are needed [109,111].
Radiomics
Extraction of high dimensional quantitative features from radiological images (CT, PET/CT or MR) to decode underlying tissue biology, histopathology, local hypoxia and genetics for potentially improving clinical decision is called radiomics. An in-depth explanation of different radiomic parameters is beyond the scope of this article [112].
Radiomic features, including texture analysis, a first order radiomic extraction, from CT and PET/CT images have been shown to determine patient prognosis, predict response to chemotherapy and determine resectability in PDAC [113–119]. Cheng et al. recently demonstrated significantly different radiomic features in autoimmune pancreatitis compared to PDAC on PET/CT images [120]. Another pilot study postulated the feasibility of radiomics to predict DM with an area-under-the curve ranging from 0.613 to 0.689 [121]. Before these techniques are considered for clinical implementation, standardization of technique, impact of image reconstructions and large scale, prospective, multi-institutional validation is needed.
Potential areas of further work include differentiating chronic mass forming pancreatitis from PDAC, quantifying exocrine and/or endocrine dysfunction and predicting likelihood of progression from acute pancreatitis to CP. A meta-analysis found an increased incidence of K-ras mutations in CP with a duration of > 3 years; radiogenomics may also have a role in predicting transformation of CP to PDAC [122].
Artificial Intelligence (AI)
Several machine learning techniques like logistic regression, Bayesian analysis and random forest classifiers are used to crunch radiomic data. Deep learning is class of machine learning wherein layers of neural networks are trained by adjusting parameters and typically tasked in radiology for detection, segmentation or classification [123].
For pancreas, DL has an 80% accuracy for complete automated organ segmentation and 98.5% specificity for PDAC detection on CT[124,125]. Recently, the US Food and Drug Administration has approved the first deep-learning based CT image reconstruction (TrueFidelity, GE). These are theorized to have the look of FBP but retain low-dose capabilities of IR, however formal analysis for this is still needed.
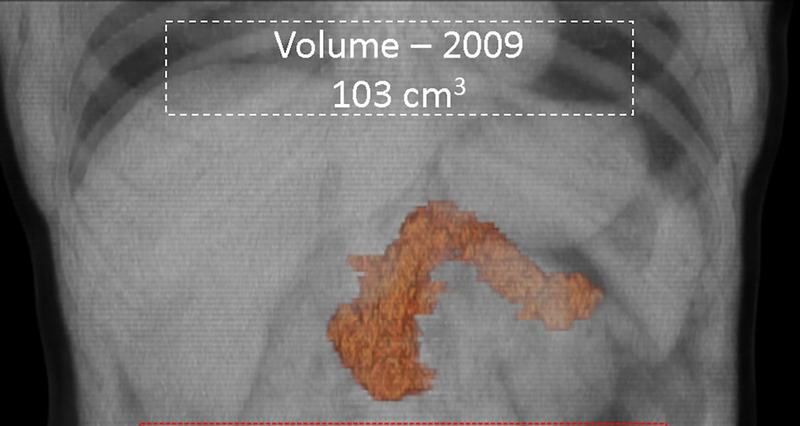
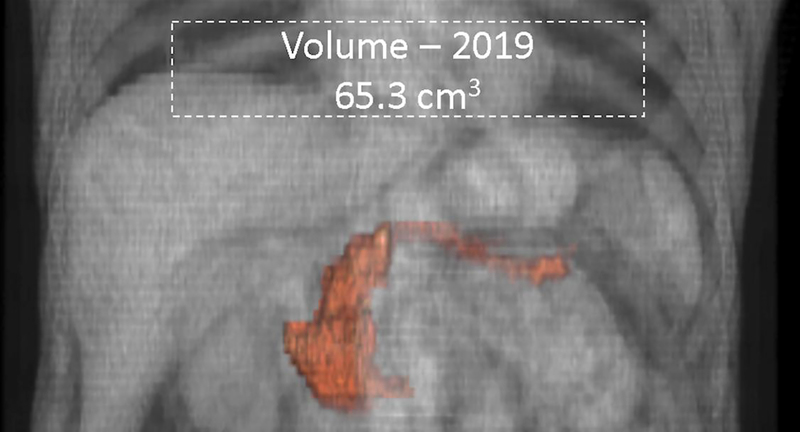
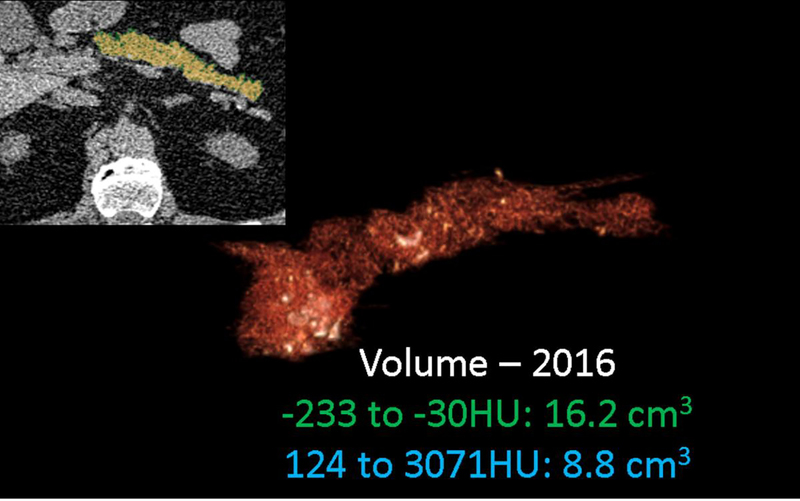
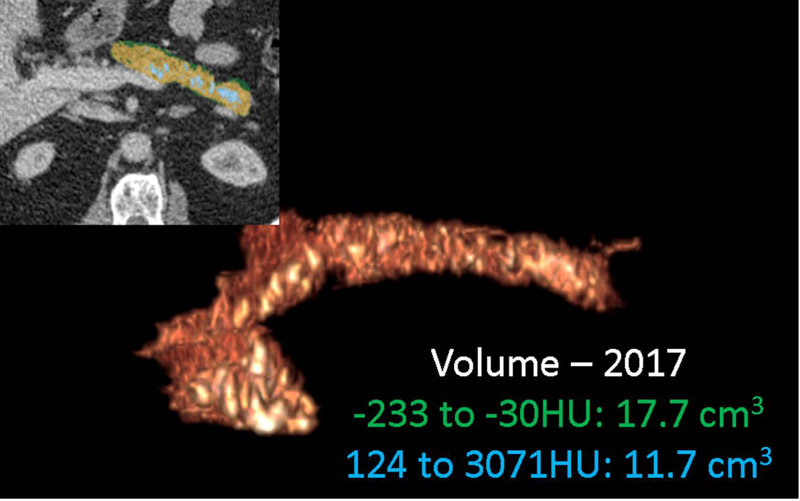
As of now, pancreatic CT volumetric measurements are made manually or through semi-automated techniques. Manual measurements require high radiologist engagement and is calculated using formula [126]. Semi-automated techniques (Figures 13 and 14) require less radiologist engagement and use manual references interpolated with automated estimations [127]. Fully automated pancreatic volumetry is more challenging than automated liver and spleen volumetry as its shape and size can be influenced by adjacent structures [128]. Nevertheless, several computational techniques and deep-learning based techniques are being evaluated for automated pancreatic analysis [128]. Interpretation of pancreatic volume must consider patient age and gender and several authors have established references for normal population [126,129,130]. Future areas of interest for CP-related AI applications would be in screening and serial monitoring with automated (i) pancreatic volumetry, (ii) quantification of calcification burden, (iii) body composition analysis, and prediction of future disease states on ultra-low CTs.
Figure 13.
Serial semi-automated volumetry. 65-year old male with diabetes mellitus diagnosed in 2013 underwent two CT scans 10-years apart. Semi-automated pancreatic volumetry measurements revealed volume reduction from 103cm3 in (a) 2009 to 65cm3 in (b) 2019. The atrophy was most predominant in the body and tail regions.
Figure 14.
Serial CT assessment of fat fraction and calcific burden. 67-year old male with chronic pancreatitis underwent two CT scans 15-months apart. Serial semi-automated quantification for fat (−233 to −30HU) fraction and calcification (124–3071HU) burden using double -thresholding volume histogram technique shows an increase in the fat (from 16.2cm3 to 17.7cm3) and calcific (8.8cm3 to 11.7cm3) volumes between (a) September 2016 and (b) December 2017.
Ultrasound (US)
Conventional gray-scale B-mode US is often the first imaging performed for abdominal assessment. Transabdominal US (TA-US) however may be limited for the pancreas due to retroperitoneal location of the gland. To overcome this, detailed pancreatic evaluation is generally performed with endoscopic ultrasound (EUS). Advances such as harmonic imaging, US-elastography and contrast-enhanced US (CE-US) can be applied to both abdominal and endoscopic approaches. Tissue harmonic US imaging improves the resolution with reduced reverberation artifacts [131].
Conventional trans-abdominal B-mode US has a lower accuracy than MR in determining fatty infiltration and consequently estimating pancreatic exocrine function [132]. US-elastography can be used as a quantitative measure to estimate pancreatic stiffness using either strain or shear wave techniques. Both techniques are available through a transabdominal approach, but only strain technique is available with EUS [133]. In a prospective study of 191 CP patients, strain ratio from EUS-US-elastography showed a positive correlation with Rosemont classification (EUS-based classification) of CP at an accuracy of 91.1% [134]. Another study demonstrated an association between strain ratio and pancreatic exocrine function as determined by 13C-mixed triglyceride breath test [135]. Endocrine function, in particular assessment of diabetic microangiopathy, with shear wave TA-US-elastography has also been evaluated using shear wave technique [136]. However, another recent study showed no significant difference in US-elastography between diabetics and healthy controls [137]. Large-scale studies are therefore warranted to ascertain the feasibility and clinical value.
Despite these advances the retroperitoneal location of pancreas and invasive nature of EUS makes CT and MR the modality of choice for imaging.
Diagnostic Criteria of CP
The Cambridge classification has been the widely used criteria for diagnosis and grading of CP for decades [16]. Although this classification originally based on ERCP findings, it has been adapted to MRCP practice and has remained as the de facto diagnostic standard, mostly due to the relative ease of use and the familiarity of referring physicians. Role of MRI/MRCP in the diagnosis of CP has been acknowledged by recent guidelines of the American Pancreatic Association, and a modified Cambridge classification for MR/MRCP and CT has been proposed [3]. Cambridge classification has been shown to have poor sensitivity for the diagnosis of early CP [3]; however, parenchymal features visualized on MRI have shown promise in establishing the CP at an early stage [31]. There is a need to develop diagnostic criteria that incorporate both parenchymal and ductal features of CP seen by MRI/MRCP. Several MR imaging techniques have been shown to be useful for detection of parenchymal changes seen with CP; however, there has not been widely accepted MR based diagnostic criteria that have emerged from these efforts. As a major step towards achieving this goal, a prospective multi-institutional study investigating well-phenotyped CP patients is in progress [41].
Standardized definitions and reporting of CP on cross-sectional imaging studies will facilitate classification of disease severity and longitudinal assessment in clinical trials. A recently published consensus identifies, defines, and provides metrics for reporting features of CP that will allow a more standardized approach to disease diagnosis and assessment of severity [4]. Table 2 provides an overview of the role of the techniques described in this article for evaluating chronic pancreatitis.
Table 2.
Advanced Imaging Techniques in Chronic Pancreatitis (CP)
| Clinical Question | Specific Question | Useful Imaging techniques |
|---|---|---|
| Diagnosis of Structural/Functional Changes | Parenchymal | • T1 signal changes • Extracellular volume fraction • Contrast enhanced CT • Diffusion weighted imaging • MR Elastography • Pancreatic fat fraction (by MRI) • Dual-energy CT • 3D volumetry using AI • EUS with elastrography |
| Ductal | • MRCP (with/without Secretin) | |
| Functional | • Secretin-enhanced MRCP • Perfusion CT • Radiomics |
|
| Assist in Therapeutic Decision Making | Diagnose obstruction | • MRCP (with/without Secretin) • Dual-energy CT |
| Detect fluid collections | • Dual-energy CT (including material density images and virtual unenhanced images) | |
| Identify vascular complications | • Dual-energy CT (including material density images and virtual unenhanced images) | |
| Differentiate CP from Pancreatic Adenocarcinoma | Determine contrast enhancement pattern and/or metabolic activity | • Dual-energy CT • MRI/MRCP • Perfusion CT • PET-CT • PET-MRI • Radiomics |
Acknowledgments
Funding
Dr. Tirkes is supported by National Cancer Institute and National Institute of Diabetes and Digestive and Kidney Diseases of the National Institutes of Health under award numbers 1R01DK116963 and U01DK108323 (Consortium for the Study of Chronic Pancreatitis, Diabetes, and Pancreatic Cancer). The content is solely the responsibility of the authors and does not necessarily represent the official views of the National Institutes of Health.
ABBREVIATIONS
- ADC
Apparent Diffusion Coefficient
- CP
Chronic Pancreatitis
- DECT
Dual-energy computerized tomography
- DWI
Diffusion Weighted Imaging
- ECV
Extracellular Volume
- MDCT
Multi-detector computerized tomography
- MRCP
Magnetic Resonance Cholangiopancreatography
- MRI
Magnetic Resonance Imaging
- MRE
Magnetic Resonance Elastography
- SI
Signal Intensity
- DECT
Dual-energy CT
- PDAC
Pancreatic adenocarcinoma
Footnotes
Disclosures
None
Review Board:
NA.
Publisher's Disclaimer: This Author Accepted Manuscript is a PDF file of an unedited peer-reviewed manuscript that has been accepted for publication but has not been copyedited or corrected. The official version of record that is published in the journal is kept up to date and so may therefore differ from this version.
Contributor Information
Anushri Parakh, Post-doctoral Research Fellow, Radiology, Massachusetts General Hospital, White 270 | 55 Fruit Street, Boston 02114.
Temel Tirkes, Associate Professor of Radiology and Imaging Sciences, Indiana University School of Medicine, Department of Radiology and Imaging Sciences, 550 N. University Blvd. Suite 0663, Indianapolis, IN, 46202.
REFERENCES
- 1.Kloppel G, Maillet B (1991) Chronic pancreatitis: evolution of the disease. Hepatogastroenterology 38 (5):408–412 [PubMed] [Google Scholar]
- 2.Forsmark CE (2008) The early diagnosis of chronic pancreatitis. Clin Gastroenterol Hepatol 6 (12):1291–1293. doi: 10.1016/j.cgh.2008.08.008 [DOI] [PubMed] [Google Scholar]
- 3.Conwell DL, Lee LS, Yadav D, Longnecker DS, Miller FH, Mortele KJ, Levy MJ, Kwon R, Lieb JG, Stevens T, Toskes PP, Gardner TB, Gelrud A, Wu BU, Forsmark CE, Vege SS (2014) American Pancreatic Association Practice Guidelines in Chronic Pancreatitis: evidence-based report on diagnostic guidelines. Pancreas 43 (8):1143–1162. doi: 10.1097/MPA.0000000000000237 [DOI] [PMC free article] [PubMed] [Google Scholar]
- 4.Tirkes T, Shah ZK, Takahashi N, Grajo JR, Chang ST, Venkatesh SK, Conwell DL, Fogel EL, Park W, Topazian M, Yadav D, Dasyam AK, Consortium for the Study of Chronic Pancreatitis D, Pancreatic C (2019) Reporting Standards for Chronic Pancreatitis by Using CT, MRI, and MR Cholangiopancreatography: The Consortium for the Study of Chronic Pancreatitis, Diabetes, and Pancreatic Cancer. Radiology 290 (1):207–215. doi: 10.1148/radiol.2018181353 [DOI] [PMC free article] [PubMed] [Google Scholar]
- 5.Issa Y, Kempeneers MA, van Santvoort HC, Bollen TL, Bipat S, Boermeester MA (2017) Diagnostic performance of imaging modalities in chronic pancreatitis: a systematic review and meta-analysis. Eur Radiol 27 (9):3820–3844. doi: 10.1007/s00330-016-4720-9 [DOI] [PMC free article] [PubMed] [Google Scholar]
- 6.Duggan SN, Ní Chonchubhair HM, Lawal O, O’Connor DB, Conlon KC (2016) Chronic pancreatitis: A diagnostic dilemma. World J Gastroenterol 22 (7):2304–2313. doi: 10.3748/wjg.v22.i7.2304 [DOI] [PMC free article] [PubMed] [Google Scholar]
- 7.Bakkevold KE, ArnesjØ B, Kambestad B (1992) Carcinoma of the pancreas and papilla of Vater: presenting symptoms, signs, and diagnosis related to stage and tumour site. A prospective multicentre trial in 472 patients. Norwegian Pancreatic Cancer Trial. Scand J Gastroenterol 27 (4):317–325 [DOI] [PubMed] [Google Scholar]
- 8.Tirkes T, Shah ZK, Takahashi N, Grajo JR, Chang ST, Venkatesh SK, Conwell DL, Fogel EL, Park W, Topazian M, Yadav D, Dasyam AK, Consortium for the Study of Chronic Pancreatitis Da, and Pancreatic Cancer (2019) Reporting Standards for Chronic Pancreatitis by Using CT, MRI, and MR Cholangiopancreatography: The Consortium for the Study of Chronic Pancreatitis, Diabetes, and Pancreatic Cancer. Radiology 290 (1):207–215. doi: 10.1148/radiol.2018181353 [DOI] [PMC free article] [PubMed] [Google Scholar]
- 9.Tirkes T, Sandrasegaran K, Sanyal R, Sherman S, Schmidt CM, Cote GA, Akisik F (2013) Secretin-enhanced MR cholangiopancreatography: spectrum of findings. Radiographics 33 (7):1889–1906. doi: 10.1148/rg.337125014 [DOI] [PubMed] [Google Scholar]
- 10.Carbognin G, Pinali L, Girardi V, Casarin A, Mansueto G, Mucelli RP (2007) Collateral branches IPMTs: secretin-enhanced MRCP. Abdom Imaging 32 (3):374–380. doi: 10.1007/s00261-006-9056-5 [DOI] [PubMed] [Google Scholar]
- 11.Matos C, Metens T, Deviere J, Nicaise N, Braude P, Van Yperen G, Cremer M, Struyven J (1997) Pancreatic duct: morphologic and functional evaluation with dynamic MR pancreatography after secretin stimulation. Radiology 203 (2):435–441 [DOI] [PubMed] [Google Scholar]
- 12.Cappeliez O, Delhaye M, Deviere J, Le Moine O, Metens T, Nicaise N, Cremer M, Stryuven J, Matos C (2000) Chronic pancreatitis: evaluation of pancreatic exocrine function with MR pancreatography after secretin stimulation. Radiology 215 (2):358–364 [DOI] [PubMed] [Google Scholar]
- 13.Manfredi R, Costamagna G, Brizi MG, Maresca G, Vecchioli A, Colagrande C, Marano P (2000) Severe chronic pancreatitis versus suspected pancreatic disease: dynamic MR cholangiopancreatography after secretin stimulation. Radiology 214 (3):849–855 [DOI] [PubMed] [Google Scholar]
- 14.Punwani S, Gillams AR, Lees WR (2003) Non-invasive quantification of pancreatic exocrine function using secretin-stimulated MRCP. Eur Radiol 13 (2):273–276. doi: 10.1007/s00330-002-1605-x [DOI] [PubMed] [Google Scholar]
- 15.Tirkes T, Fogel EL, Sherman S, Lin C, Swensson J, Akisik F, Sandrasegaran K (2017) Detection of exocrine dysfunction by MRI in patients with early chronic pancreatitis. Abdom Radiol (NY) 42 (2):544–551. doi: 10.1007/s00261-016-0917-2 [DOI] [PMC free article] [PubMed] [Google Scholar]
- 16.Sarner M, Cotton PB (1984) Classification of pancreatitis. Gut 25 (7):756–759 [DOI] [PMC free article] [PubMed] [Google Scholar]
- 17.Chowdhury RS, Forsmark CE (2003) Review article: Pancreatic function testing. Aliment Pharmacol Ther 17 (6):733–750 [DOI] [PubMed] [Google Scholar]
- 18.Winston CB, Mitchell DG, Outwater EK, Ehrlich SM (1995) Pancreatic signal intensity on T1-weighted fat saturation MR images: clinical correlation. J Magn Reson Imaging 5 (3):267–271 [DOI] [PubMed] [Google Scholar]
- 19.Trikudanathan G, Walker SP, Munigala S, Spilseth B, Malli A, Han Y, Bellin M, Chinnakotla S, Dunn T, Pruett TL, Beilman GJ, Vega Peralta J, Arain MA, Amateau SK, Schwarzenberg SJ, Mallery S, Attam R, Freeman ML (2015) Diagnostic Performance of Contrast-Enhanced MRI With Secretin-Stimulated MRCP for Non-Calcific Chronic Pancreatitis: A Comparison With Histopathology. Am J Gastroenterol 110 (11):1598–1606. doi: 10.1038/ajg.2015.297 [DOI] [PubMed] [Google Scholar]
- 20.Mitchell DG, Winston CB, Outwater EK, Ehrlich SM (1995) Delineation of pancreas with MR imaging: multiobserver comparison of five pulse sequences. J Magn Reson Imaging 5 (2):193–199 [DOI] [PubMed] [Google Scholar]
- 21.Sica GT, Miller FH, Rodriguez G, McTavish J, Banks PA (2002) Magnetic resonance imaging in patients with pancreatitis: evaluation of signal intensity and enhancement changes. J Magn Reson Imaging 15 (3):275–284 [DOI] [PubMed] [Google Scholar]
- 22.Ammann RW, Heitz PU, Kloppel G (1996) Course of alcoholic chronic pancreatitis: a prospective clinicomorphological long-term study. Gastroenterology 111 (1):224–231 [DOI] [PubMed] [Google Scholar]
- 23.Balci NC, Smith A, Momtahen AJ, Alkaade S, Fattahi R, Tariq S, Burton F (2010) MRI and S-MRCP findings in patients with suspected chronic pancreatitis: correlation with endoscopic pancreatic function testing (ePFT). J Magn Reson Imaging 31 (3):601–606. doi: 10.1002/jmri.22085 [DOI] [PubMed] [Google Scholar]
- 24.Watanabe H, Kanematsu M, Tanaka K, Osada S, Tomita H, Hara A, Goshima S, Kondo H, Kawada H, Noda Y, Tanahashi Y, Kawai N, Yoshida K, Moriyama N (2014) Fibrosis and postoperative fistula of the pancreas: correlation with MR imaging findings--preliminary results. Radiology 270 (3):791–799. doi: 10.1148/radiol.13131194 [DOI] [PubMed] [Google Scholar]
- 25.Tirkes T, Zhao X, Lin C, Stuckey AJ, Li L, Giri S, Nickel D (2019) Evaluation of variable flip angle, MOLLI, SASHA, and IR-SNAPSHOT pulse sequences for T1 relaxometry and extracellular volume imaging of the pancreas and liver. MAGMA. doi: 10.1007/s10334-019-00762-2 [DOI] [PMC free article] [PubMed] [Google Scholar]
- 26.Cheng HL, Wright GA (2006) Rapid high-resolution T(1) mapping by variable flip angles: accurate and precise measurements in the presence of radiofrequency field inhomogeneity. Magn Reson Med 55 (3):566–574. doi: 10.1002/mrm.20791 [DOI] [PubMed] [Google Scholar]
- 27.Nekolla S, Gneiting T, Syha J, Deichmann R, Haase A (1992) T1 maps by K-space reduced snapshot-FLASH MRI. J Comput Assist Tomogr 16 (2):327–332 [DOI] [PubMed] [Google Scholar]
- 28.Messroghli DR, Radjenovic A, Kozerke S, Higgins DM, Sivananthan MU, Ridgway JP (2004) Modified Look-Locker inversion recovery (MOLLI) for high-resolution T1 mapping of the heart. Magn Reson Med 52 (1):141–146. doi: 10.1002/mrm.20110 [DOI] [PubMed] [Google Scholar]
- 29.Chow K, Flewitt JA, Green JD, Pagano JJ, Friedrich MG, Thompson RB (2014) Saturation recovery single-shot acquisition (SASHA) for myocardial T(1) mapping. Magn Reson Med 71 (6):2082–2095. doi: 10.1002/mrm.24878 [DOI] [PubMed] [Google Scholar]
- 30.Tirkes T, Mitchell JR, Li L, Zhao X, Lin C (2019) Normal T1 relaxometry and extracellular volume of the pancreas in subjects with no pancreas disease: correlation with age and gender. Abdom Radiol (NY). doi: 10.1007/s00261-019-02071-7 [DOI] [PMC free article] [PubMed] [Google Scholar]
- 31.Tirkes T, Lin C, Fogel EL, Sherman SS, Wang Q, Sandrasegaran K (2017) T1 mapping for diagnosis of mild chronic pancreatitis. J Magn Reson Imaging 45 (4):1171–1176. doi: 10.1002/jmri.25428 [DOI] [PMC free article] [PubMed] [Google Scholar]
- 32.Tirkes T, Lin C, Cui E, Deng Y, Territo PR, Sandrasegaran K, Akisik F (2018) Quantitative MR Evaluation of Chronic Pancreatitis: Extracellular Volume Fraction and MR Relaxometry. AJR Am J Roentgenol 210 (3):533–542. doi: 10.2214/AJR.17.18606 [DOI] [PMC free article] [PubMed] [Google Scholar]
- 33.Haber PS, Keogh GW, Apte MV, Moran CS, Stewart NL, Crawford DH, Pirola RC, McCaughan GW, Ramm GA, Wilson JS (1999) Activation of pancreatic stellate cells in human and experimental pancreatic fibrosis. Am J Pathol 155 (4):1087–1095. doi: 10.1016/S0002-9440(10)65211-X [DOI] [PMC free article] [PubMed] [Google Scholar]
- 34.Charrier AL, Brigstock DR (2010) Connective tissue growth factor production by activated pancreatic stellate cells in mouse alcoholic chronic pancreatitis. Lab Invest 90 (8):1179–1188. doi: 10.1038/labinvest.2010.82 [DOI] [PMC free article] [PubMed] [Google Scholar]
- 35.Pan S, Chen R, Stevens T, Bronner MP, May D, Tamura Y, McIntosh MW, Brentnall TA (2011) Proteomics portrait of archival lesions of chronic pancreatitis. PLoS One 6 (11):e27574. doi: 10.1371/journal.pone.0027574 [DOI] [PMC free article] [PubMed] [Google Scholar]
- 36.Akisik MF, Aisen AM, Sandrasegaran K, Jennings SG, Lin C, Sherman S, Lin JA, Rydberg M (2009) Assessment of chronic pancreatitis: utility of diffusion-weighted MR imaging with secretin enhancement. Radiology 250 (1):103–109. doi: 10.1148/radiol.2493080160 [DOI] [PubMed] [Google Scholar]
- 37.Akisik MF, Sandrasegaran K, Jennings SG, Aisen AM, Lin C, Sherman S, Rydberg MP (2009) Diagnosis of chronic pancreatitis by using apparent diffusion coefficient measurements at 3.0-T MR following secretin stimulation. Radiology 252 (2):418–425. doi: 10.1148/radiol.2522081656 [DOI] [PubMed] [Google Scholar]
- 38.Wang Y, Ganger DR, Levitsky J, Sternick LA, McCarthy RJ, Chen ZE, Fasanati CW, Bolster B, Shah S, Zuehlsdorff S, Omary RA, Ehman RL, Miller FH (2011) Assessment of chronic hepatitis and fibrosis: comparison of MR elastography and diffusion-weighted imaging. Am J Roentgenol 196 (3):553–561. doi: 10.2214/AJR.10.4580 [DOI] [PMC free article] [PubMed] [Google Scholar]
- 39.Shi Y, Glaser KJ, Venkatesh SK, Ben-Abraham EI, Ehman RL (2015) Feasibility of using 3D MR elastography to determine pancreatic stiffness in healthy volunteers. J Magn Reson Imaging 41 (2):369–375. doi: 10.1002/jmri.24572 [DOI] [PMC free article] [PubMed] [Google Scholar]
- 40.Kolipaka A, Schroeder S, Mo X, Shah Z, Hart PA, Conwell DL (2017) Magnetic resonance elastography of the pancreas: Measurement reproducibility and relationship with age. Magn Reson Imaging 42:1–7. doi: 10.1016/j.mri.2017.04.015 [DOI] [PMC free article] [PubMed] [Google Scholar]
- 41.Tirkes T, Yadav D, Conwell DL, Territo PR, Zhao X, Venkatesh SK, Kolipaka A, Li L, Pisegna JR, Pandol SJ, Park WG, Topazian M, Serrano J, Fogel EL, Consortium for the Study of Chronic Pancreatitis D, Pancreatic C (2019) Magnetic resonance imaging as a non-invasive method for the assessment of pancreatic fibrosis (MINIMAP): a comprehensive study design from the consortium for the study of chronic pancreatitis, diabetes, and pancreatic cancer. Abdom Radiol (NY) 44 (8):2809–2821. doi: 10.1007/s00261-019-02049-5 [DOI] [PMC free article] [PubMed] [Google Scholar]
- 42.Kang GH, Cruite I, Shiehmorteza M, Wolfson T, Gamst AC, Hamilton G, Bydder M, Middleton MS, Sirlin CB (2011) Reproducibility of MRI-determined proton density fat fraction across two different MR scanner platforms. J Magn Reson Imaging 34 (4):928–934. doi: 10.1002/jmri.22701 [DOI] [PMC free article] [PubMed] [Google Scholar]
- 43.Schwenzer NF, Machann J, Martirosian P, Stefan N, Schraml C, Fritsche A, Claussen CD, Schick F (2008) Quantification of pancreatic lipomatosis and liver steatosis by MRI: comparison of in/opposed-phase and spectral-spatial excitation techniques. Invest Radiol 43 (5):330–337. doi: 10.1097/RLI.0b013e31816a88c6 [DOI] [PubMed] [Google Scholar]
- 44.Tirkes T, Jeon CY, Li L, Joon AY, Seltman TA, Sankar M, Persohn SA, Territo PR (2019) Association of Pancreatic Steatosis With Chronic Pancreatitis, Obesity, and Type 2 Diabetes Mellitus. Pancreas 48 (3):420–426. doi: 10.1097/MPA.0000000000001252 [DOI] [PMC free article] [PubMed] [Google Scholar]
- 45.Kuhn JP, Berthold F, Mayerle J, Volzke H, Reeder SB, Rathmann W, Lerch MM, Hosten N, Hegenscheid K, Meffert PJ (2015) Pancreatic Steatosis Demonstrated at MR Imaging in the General Population: Clinical Relevance. Radiology 276 (1):129–136. doi: 10.1148/radiol.15140446 [DOI] [PMC free article] [PubMed] [Google Scholar]
- 46.Lell MM, Wildberger JE, Alkadhi H, Damilakis J, Kachelriess M (2015) Evolution in Computed Tomography: The Battle for Speed and Dose. Invest Radiol 50 (9):629–644. doi: 10.1097/RLI.0000000000000172 [DOI] [PubMed] [Google Scholar]
- 47.Yu L, Christner JA, Leng S, Wang J, Fletcher JG, McCollough CH (2011) Virtual monochromatic imaging in dual-source dual-energy CT: radiation dose and image quality. Med Phys 38 (12):6371–6379. doi: 10.1118/1.3658568 [DOI] [PMC free article] [PubMed] [Google Scholar]
- 48.Marin D, Nelson RC, Barnhart H, Schindera ST, Ho LM, Jaffe TA, Yoshizumi TT, Youngblood R, Samei E (2010) Detection of pancreatic tumors, image quality, and radiation dose during the pancreatic parenchymal phase: effect of a low-tube-voltage, high-tube-current CT technique--preliminary results. Radiology 256 (2):450–459. doi: 10.1148/radiol.10091819 [DOI] [PubMed] [Google Scholar]
- 49.Loizou L, Albiin N, Leidner B, Axelsson E, Fischer MA, Grigoriadis A, Del Chiaro M, Segersvard R, Verbeke C, Sundin A, Kartalis N (2016) Multidetector CT of pancreatic ductal adenocarcinoma: Effect of tube voltage and iodine load on tumour conspicuity and image quality. Eur Radiol 26 (11):4021–4029. doi: 10.1007/s00330-016-4273-y [DOI] [PubMed] [Google Scholar]
- 50.Zamboni GA, Ambrosetti MC, Guariglia S, Cavedon C, Pozzi Mucelli R (2014) Single-energy low-voltage arterial phase MDCT scanning increases conspicuity of adenocarcinoma of the pancreas. Eur J Radiol 83 (3):e113–117. doi: 10.1016/j.ejrad.2013.12.022 [DOI] [PubMed] [Google Scholar]
- 51.Yuan Y, Huang ZX, Li ZL, Bin S, Deng LP (2011) [Dual-source dual-energy computed tomography imaging of acute necrotizing pancreatitis--Preliminary study]. Sichuan Da Xue Xue Bao Yi Xue Ban 42 (5):691–694 [PubMed] [Google Scholar]
- 52.Raimondi S, Lowenfels AB, Morselli-Labate AM, Maisonneuve P, Pezzilli R (2010) Pancreatic cancer in chronic pancreatitis; aetiology, incidence, and early detection. Best Pract Res Clin Gastroenterol 24 (3):349–358. doi: 10.1016/j.bpg.2010.02.007 [DOI] [PubMed] [Google Scholar]
- 53.Othman AE, Bongers MN, Zinsser D, Schabel C, Wichmann JL, Arshid R, Notohamiprodjo M, Nikolaou K, Bamberg F (2018) Evaluation of reduced-dose CT for acute non-traumatic abdominal pain: evaluation of diagnostic accuracy in comparison to standard-dose CT. Acta Radiol 59 (1):4–12. doi: 10.1177/0284185117703152 [DOI] [PubMed] [Google Scholar]
- 54.Yadav D, Park WG, Fogel EL, Li L, Chari ST, Feng Z, Fisher WE, Forsmark CE, Jeon CY, Habtezion A, Hart PA, Hughes SJ, Othman MO, Rinaudo JAS, Pandol SJ, Tirkes T, Serrano J, Srivastava S, Van Den Eeden SK, Whitcomb DC, Topazian M, Conwell DL, Consortium for the Study of Chronic Pancreatitis Da, and Pancreatic Cancer (CPDPC) (2018) PROspective Evaluation of Chronic Pancreatitis for EpidEmiologic and Translational StuDies: Rationale and Study Design for PROCEED From the Consortium for the Study of Chronic Pancreatitis, Diabetes, and Pancreatic Cancer. Pancreas 47 (10):1229–1238. doi: 10.1097/MPA.0000000000001170 [DOI] [PMC free article] [PubMed] [Google Scholar]
- 55.Uc A, Perito ER, Pohl JF, Shah U, Abu-El-Haija M, Barth B, Bellin MD, Ellery KM, Fishman DS, Gariepy CE, Giefer MJ, Gonska T, Heyman MB, Himes RW, Husain SZ, Maqbool A, Mascarenhas MR, McFerron BA, Morinville VD, Lin TK, Liu QY, Nathan JD, Rhee SJ, Ooi CY, Sellers ZM, Schwarzenberg SJ, Serrano J, Troendle DM, Werlin SL, Wilschanski M, Zheng Y, Yuan Y, Lowe ME, Consortium for the Study of Chronic Pancreatitis Da, and Pancreatic Cancer (CPDPC) (2018) INternational Study Group of Pediatric Pancreatitis: In Search for a CuRE Cohort Study: Design and Rationale for INSPPIRE 2 From the Consortium for the Study of Chronic Pancreatitis, Diabetes, and Pancreatic Cancer. Pancreas 47 (10):1222–1228. doi: 10.1097/MPA.0000000000001172 [DOI] [PMC free article] [PubMed] [Google Scholar]
- 56.Christe A, Heverhagen J, Ozdoba C, Weisstanner C, Ulzheimer S, Ebner L (2013) CT dose and image quality in the last three scanner generations. World J Radiol 5 (11):421–429. doi: 10.4329/wjr.v5.i11.421 [DOI] [PMC free article] [PubMed] [Google Scholar]
- 57.Choi JW, Lee JM, Yoon JH, Baek JH, Han JK, Choi BI (2013) Iterative reconstruction algorithms of computed tomography for the assessment of small pancreatic lesions: phantom study. J Comput Assist Tomogr 37 (6):911–923. doi: 10.1097/RCT.0b013e3182a2181e [DOI] [PubMed] [Google Scholar]
- 58.Matsuki M, Murakami T, Juri H, Yoshikawa S, Narumi Y (2013) Impact of adaptive iterative dose reduction (AIDR) 3D on low-dose abdominal CT: comparison with routine-dose CT using filtered back projection. Acta Radiol 54 (8):869–875. doi: 10.1177/0284185113488576 [DOI] [PubMed] [Google Scholar]
- 59.Lee NK, Kim S, Hong SB, Kim TU, Ryu H, Lee JW, Kim JY (2019) Low-Dose CT With the Adaptive Statistical Iterative Reconstruction V Technique in Abdominal Organ Injury: Comparison With Routine-Dose CT With Filtered Back Projection. AJR Am J Roentgenol:1–8. doi: 10.2214/AJR.18.20827 [DOI] [PubMed] [Google Scholar]
- 60.Zhang X, Chen J, Yu N, Ren Z, Tian Q, Tian X, He T, Guo C (2018) Improving image quality with model-based iterative reconstruction at quarter of nominal dose in upper abdominal CT. Br J Radiol:20180137. doi: 10.1259/bjr.20180137 [DOI] [PMC free article] [PubMed] [Google Scholar]
- 61.Wang HX, Lü PJ, Yue SW, Chang LY, Li Y, Zhao HP, Li WR, Gao JB (2017) [Combined use of wide-detector and adaptive statistical iterative reconstruction-V technique in abdominal CT with low radiation dose]. Zhonghua Yi Xue Za Zhi 97 (45):3567–3572. doi: 10.3760/cma.j.issn.0376-2491.2017.45.011 [DOI] [PubMed] [Google Scholar]
- 62.Lin XZ, Machida H, Tanaka I, Fukui R, Ueno E, Chen KM, Yan FH (2014) CT of the pancreas: comparison of image quality and pancreatic duct depiction among model-based iterative, adaptive statistical iterative, and filtered back projection reconstruction techniques. Abdom Imaging 39 (3):497–505. doi: 10.1007/s00261-014-0081-5 [DOI] [PubMed] [Google Scholar]
- 63.Yasaka K, Katsura M, Akahane M, Sato J, Matsuda I, Ohtomo K (2016) Model-based iterative reconstruction and adaptive statistical iterative reconstruction: dose-reduced CT for detecting pancreatic calcification. Acta Radiol Open 5 (1):2058460116628340. doi: 10.1177/2058460116628340 [DOI] [PMC free article] [PubMed] [Google Scholar]
- 64.Almeida RR, Lo GC, Patino M, Bizzo B, Canellas R, Sahani DV (2018) Advances in Pancreatic CT Imaging. AJR Am J Roentgenol 211 (1):52–66. doi: 10.2214/AJR.17.18665 [DOI] [PubMed] [Google Scholar]
- 65.Parakh A, Macri F, Sahani D (2018) Dual-Energy Computed Tomography: Dose Reduction, Series Reduction, and Contrast Load Reduction in Dual-Energy Computed Tomography. Radiol Clin North Am 56 (4):601–624. doi: 10.1016/j.rcl.2018.03.002 [DOI] [PubMed] [Google Scholar]
- 66.Patel BN, Thomas JV, Lockhart ME, Berland LL, Morgan DE (2013) Single-source dual-energy spectral multidetector CT of pancreatic adenocarcinoma: optimization of energy level viewing significantly increases lesion contrast. Clin Radiol 68 (2):148–154. doi: 10.1016/j.crad.2012.06.108 [DOI] [PubMed] [Google Scholar]
- 67.Gupta S, Wagner-Bartak N, Jensen CT, Hui A, Wei W, Lertdilok P, Qayyum A, Tamm EP (2016) Dual-energy CT of pancreatic adenocarcinoma: reproducibility of primary tumor measurements and assessment of tumor conspicuity and margin sharpness. Abdom Radiol (NY). doi: 10.1007/s00261-016-0689-8 [DOI] [PubMed] [Google Scholar]
- 68.McNamara MM, Little MD, Alexander LF, Carroll LV, Beasley TM, Morgan DE (2015) Multireader evaluation of lesion conspicuity in small pancreatic adenocarcinomas: complimentary value of iodine material density and low keV simulated monoenergetic images using multiphasic rapid kVp-switching dual energy CT. Abdom Imaging 40 (5):1230–1240. doi: 10.1007/s00261-014-0274-y [DOI] [PubMed] [Google Scholar]
- 69.Di Maso LD, Huang J, Bassetti MF, DeWerd LA, Miller JR (2018) Investigating a novel split-filter dual-energy CT technique for improving pancreas tumor visibility for radiation therapy. J Appl Clin Med Phys 19 (5):676–683. doi: 10.1002/acm2.12435 [DOI] [PMC free article] [PubMed] [Google Scholar]
- 70.Hardie AD, Picard MM, Camp ER, Perry JD, Suranyi P, De Cecco CN, Schoepf UJ, Wichmann JL (2015) Application of an Advanced Image-Based Virtual Monoenergetic Reconstruction of Dual Source Dual-Energy CT Data at Low keV Increases Image Quality for Routine Pancreas Imaging. J Comput Assist Tomogr 39 (5):716–720. doi: 10.1097/RCT.0000000000000276 [DOI] [PubMed] [Google Scholar]
- 71.Aslan S, Camlidag I, Nural MS (2019) Lower energy levels and iodine-based material decomposition images increase pancreatic ductal adenocarcinoma conspicuity on rapid kV-switching dual-energy CT. Abdom Radiol (NY) 44 (2):568–575. doi: 10.1007/s00261-018-1754-2 [DOI] [PubMed] [Google Scholar]
- 72.Macari M, Spieler B, Kim D, Graser A, Megibow AJ, Babb J, Chandarana H (2010) Dual-source dual-energy MDCT of pancreatic adenocarcinoma: initial observations with data generated at 80 kVp and at simulated weighted-average 120 kVp. AJR Am J Roentgenol 194 (1):W27–32. doi: 10.2214/AJR.09.2737 [DOI] [PubMed] [Google Scholar]
- 73.Shaqdan KW, Parakh A, Kambadakone AR, Sahani DV (2019) Role of dual energy CT to improve diagnosis of non-traumatic abdominal vascular emergencies. Abdom Radiol (NY) 44 (2):406–421. doi: 10.1007/s00261-018-1741-7 [DOI] [PubMed] [Google Scholar]
- 74.Albrecht MH, Scholtz JE, Hüsers K, Beeres M, Bucher AM, Kaup M, Martin SS, Fischer S, Bodelle B, Bauer RW, Lehnert T, Vogl TJ, Wichmann JL (2016) Advanced image-based virtual monoenergetic dual-energy CT angiography of the abdomen: optimization of kiloelectron volt settings to improve image contrast. Eur Radiol 26 (6):1863–1870. doi: 10.1007/s00330-015-3970-2 [DOI] [PubMed] [Google Scholar]
- 75.Schlosser W, Rau BM, Poch B, Beger HG (2005) Surgical treatment of pancreas divisum causing chronic pancreatitis: the outcome benefits of duodenum-preserving pancreatic head resection. J Gastrointest Surg 9 (5):710–715. doi: 10.1016/j.gassur.2004.11.009 [DOI] [PubMed] [Google Scholar]
- 76.Morgan DE (2014) Dual-energy CT of the abdomen. Abdom Imaging 39 (1):108–134. doi: 10.1007/s00261-013-0033-5 [DOI] [PubMed] [Google Scholar]
- 77.Tandan M, Reddy DN, Santosh D, Vinod K, Ramchandani M, Rajesh G, Rama K, Lakhtakia S, Banerjee R, Pratap N, Venkat Rao G (2010) Extracorporeal shock wave lithotripsy and endotherapy for pancreatic calculi-a large single center experience. Indian J Gastroenterol 29 (4):143–148. doi: 10.1007/s12664-010-0035-y [DOI] [PubMed] [Google Scholar]
- 78.Tandan M, Talukdar R, Reddy DN (2016) Management of Pancreatic Calculi: An Update. Gut Liver 10 (6):873–880. doi: 10.5009/gnl15555 [DOI] [PMC free article] [PubMed] [Google Scholar]
- 79.Yang CB, Zhang S, Jia YJ, Duan HF, Ma GM, Zhang XR, Yu Y, He TP (2017) Clinical Application of Dual-Energy Spectral Computed Tomography in Detecting Cholesterol Gallstones From Surrounding Bile. Acad Radiol 24 (4):478–482. doi: 10.1016/j.acra.2016.10.006 [DOI] [PubMed] [Google Scholar]
- 80.Uyeda JW, Richardson IJ, Sodickson AD (2017) Making the invisible visible: improving conspicuity of noncalcified gallstones using dual-energy CT. Abdom Radiol (NY) 42 (12):2933–2939. doi: 10.1007/s00261-017-1229-x [DOI] [PubMed] [Google Scholar]
- 81.Bhosale P, Le O, Balachandran A, Fox P, Paulson E, Tamm E (2015) Quantitative and Qualitative Comparison of Single-Source Dual-Energy Computed Tomography and 120-kVp Computed Tomography for the Assessment of Pancreatic Ductal Adenocarcinoma. J Comput Assist Tomogr 39 (6):907–913. doi: 10.1097/RCT.0000000000000295 [DOI] [PMC free article] [PubMed] [Google Scholar]
- 82.Chu AJ, Lee JM, Lee YJ, Moon SK, Han JK, Choi BI (2012) Dual-source, dual-energy multidetector CT for the evaluation of pancreatic tumours. Br J Radiol 85 (1018):e891–898. doi: 10.1259/bjr/26129418 [DOI] [PMC free article] [PubMed] [Google Scholar]
- 83.Agrawal MD, Pinho DF, Kulkarni NM, Hahn PF, Guimaraes AR, Sahani DV (2014) Oncologic applications of dual-energy CT in the abdomen. Radiographics 34 (3):589–612. doi: 10.1148/rg.343135041 [DOI] [PubMed] [Google Scholar]
- 84.Patino M, Prochowski A, Agrawal MD, Simeone FJ, Gupta R, Hahn PF, Sahani DV (2016) Material Separation Using Dual-Energy CT: Current and Emerging Applications. Radiographics 36 (4):1087–1105. doi: 10.1148/rg.2016150220 [DOI] [PubMed] [Google Scholar]
- 85.Yin Q, Zou X, Zai X, Wu Z, Wu Q, Jiang X, Chen H, Miao F (2015) Pancreatic ductal adenocarcinoma and chronic mass-forming pancreatitis: Differentiation with dual-energy MDCT in spectral imaging mode. Eur J Radiol 84 (12):2470–2476. doi: 10.1016/j.ejrad.2015.09.023 [DOI] [PubMed] [Google Scholar]
- 86.Luetmer PH, Stephens DH, Ward EM (1989) Chronic pancreatitis: reassessment with current CT. Radiology 171 (2):353–357. doi: 10.1148/radiology.171.2.2704799 [DOI] [PubMed] [Google Scholar]
- 87.Mileto A, Mazziotti S, Gaeta M, Bottari A, Zimbaro F, Giardina C, Ascenti G (2012) Pancreatic dual-source dual-energy CT: is it time to discard unenhanced imaging? Clin Radiol 67 (4):334–339. doi: 10.1016/j.crad.2011.09.004 [DOI] [PubMed] [Google Scholar]
- 88.De Cecco CN, Darnell A, Macías N, Ayuso JR, Rodríguez S, Rimola J, Pagés M, García-Criado A, Rengo M, Laghi A, Ayuso C (2013) Virtual unenhanced images of the abdomen with second-generation dual-source dual-energy computed tomography: image quality and liver lesion detection. Invest Radiol 48 (1):1–9. doi: 10.1097/RLI.0b013e31826e7902 [DOI] [PubMed] [Google Scholar]
- 89.Borhani AA, Kulzer M, Iranpour N, Ghodadra A, Sparrow M, Furlan A, Tublin ME (2017) Comparison of true unenhanced and virtual unenhanced (VUE) attenuation values in abdominopelvic single-source rapid kilovoltage-switching spectral CT. Abdom Radiol (NY) 42 (3):710–717. doi: 10.1007/s00261-016-0991-5 [DOI] [PubMed] [Google Scholar]
- 90.Patel BN, Alexander L, Allen B, Berland L, Borhani A, Mileto A, Moreno C, Morgan D, Sahani D, Shuman W, Tamm E, Tublin M, Yeh B, Marin D (2017) Dual-energy CT workflow: multi-institutional consensus on standardization of abdominopelvic MDCT protocols. Abdom Radiol (NY) 42 (3):676–687. doi: 10.1007/s00261-016-0966-6 [DOI] [PubMed] [Google Scholar]
- 91.De Cecco CN, Muscogiuri G, Schoepf UJ, Caruso D, Wichmann JL, Cannao PM, Canstein C, Fuller SR, Snider L, Varga-Szemes A, Hardie AD (2016) Virtual unenhanced imaging of the liver with third-generation dual-source dual-energy CT and advanced modeled iterative reconstruction. Eur J Radiol 85 (7):1257–1264. doi: 10.1016/j.ejrad.2016.04.012 [DOI] [PubMed] [Google Scholar]
- 92.Lee HA, Lee YH, Yoon KH, Bang DH, Park DE (2016) Comparison of Virtual Unenhanced Images Derived From Dual-Energy CT With True Unenhanced Images in Evaluation of Gallstone Disease. AJR Am J Roentgenol 206 (1):74–80. doi: 10.2214/AJR.15.14570 [DOI] [PubMed] [Google Scholar]
- 93.d’Assignies G, Couvelard A, Bahrami S, Vullierme MP, Hammel P, Hentic O, Sauvanet A, Bedossa P, Ruszniewski P, Vilgrain V (2009) Pancreatic endocrine tumors: tumor blood flow assessed with perfusion CT reflects angiogenesis and correlates with prognostic factors. Radiology 250 (2):407–416. doi: 10.1148/radiol.2501080291 [DOI] [PubMed] [Google Scholar]
- 94.Garcia TS, Engelholm JL, Vouche M, Hirakata VN, Leitão CB (2019) Intra- and interobserver reproducibility of pancreatic perfusion by computed tomography. Sci Rep 9 (1):6043. doi: 10.1038/s41598-019-42519-w [DOI] [PMC free article] [PubMed] [Google Scholar]
- 95.Kandel S, Kloeters C, Meyer H, Hein P, Hilbig A, Rogalla P (2009) Whole-organ perfusion of the pancreas using dynamic volume CT in patients with primary pancreas carcinoma: acquisition technique, post-processing and initial results. Eur Radiol 19 (11):2641–2646. doi: 10.1007/s00330-009-1453-z [DOI] [PubMed] [Google Scholar]
- 96.Zamboni GA, Bernardin L, Pozzi Mucelli R (2012) Dynamic MDCT of the pancreas: is time-density curve morphology useful for the differential diagnosis of solid lesions? A preliminary report. Eur J Radiol 81 (3):e381–385. doi: 10.1016/j.ejrad.2011.11.055 [DOI] [PubMed] [Google Scholar]
- 97.Pieńkowska J, Gwoździewicz K, Skrobisz-Balandowska K, Marek I, Kostro J, Szurowska E, Studniarek M (2016) Perfusion-CT--Can We Predict Acute Pancreatitis Outcome within the First 24 Hours from the Onset of Symptoms? PLoS One 11 (1):e0146965. doi: 10.1371/journal.pone.0146965 [DOI] [PMC free article] [PubMed] [Google Scholar]
- 98.Arikawa S, Uchida M, Kunou Y, Kaida H, Uozumi J, Hayabuchi N, Okabe Y, Murotani K (2012) Assessment of Chronic Pancreatitis: Use of Whole Pancreas Perfusion With 256-Slice Computed Tomography. Pancreas 41 (4):535–540. doi: 10.1097/MPA.0b013e3182374fe0 [DOI] [PubMed] [Google Scholar]
- 99.Yadav AK, Sharma R, Kandasamy D, Pradhan RK, Garg PK, Bhalla AS, Gamanagatti S, Srivastava DN, Sahni P, Upadhyay AD (2016) Perfusion CT - Can it resolve the pancreatic carcinoma versus mass forming chronic pancreatitis conundrum? Pancreatology 16 (6):979–987. doi: 10.1016/j.pan.2016.08.011 [DOI] [PubMed] [Google Scholar]
- 100.Lu N, Feng XY, Hao SJ, Liang ZH, Jin C, Qiang JW, Guo QY (2011) 64-slice CT perfusion imaging of pancreatic adenocarcinoma and mass-forming chronic pancreatitis. Acad Radiol 18 (1):81–88. doi: 10.1016/j.acra.2010.07.012 [DOI] [PubMed] [Google Scholar]
- 101.Tan Z, Miao Q, Li X, Ren K, Zhao Y, Zhao L, Liu Y, Chai R, Xu K (2015) The primary study of low-dose pancreas perfusion by 640-slice helical CT: a whole-organ perfusion. Springerplus 4:192. doi: 10.1186/s40064-015-0950-6 [DOI] [PMC free article] [PubMed] [Google Scholar]
- 102.Xie Q, Wu J, Tang Y, Dou Y, Hao S, Xu F, Feng X, Liang Z (2013) Whole-organ CT perfusion of the pancreas: impact of iterative reconstruction on image quality, perfusion parameters and radiation dose in 256-slice CT-preliminary findings. PLoS One 8 (11):e80468. doi: 10.1371/journal.pone.0080468 [DOI] [PMC free article] [PubMed] [Google Scholar]
- 103.Li P, Deng W, Xue H, Xu K, Zhu L, Li J, Sun Z, Jin Z (2019) Weight-adapted ultra-low-dose pancreatic perfusion CT: radiation dose, image quality, and perfusion parameters. Abdom Radiol (NY) 44 (6):2196–2204. doi: 10.1007/s00261-019-01938-z [DOI] [PubMed] [Google Scholar]
- 104.Sahani DV, Bonaffini PA, Catalano OA, Guimaraes AR, Blake MA (2012) State-of-the-art PET/CT of the pancreas: current role and emerging indications. Radiographics 32 (4):1133–1158; discussion 1158–1160. doi: 10.1148/rg.324115143 [DOI] [PMC free article] [PubMed] [Google Scholar]
- 105.Abraham SC, Wilentz RE, Yeo CJ, Sohn TA, Cameron JL, Boitnott JK, Hruban RH (2003) Pancreaticoduodenectomy (Whipple resections) in patients without malignancy: are they all ‘chronic pancreatitis’? Am J Surg Pathol 27 (1):110–120 [DOI] [PubMed] [Google Scholar]
- 106.Zhang J, Jia G, Zuo C, Jia N, Wang H (2017) F-FDG PET/CT helps differentiate autoimmune pancreatitis from pancreatic cancer. BMC Cancer 17 (1):695. doi: 10.1186/s12885-017-3665-y [DOI] [PMC free article] [PubMed] [Google Scholar]
- 107.Cao Z, Tian R, Zhang T, Zhao Y (2015) Localized Autoimmune Pancreatitis: Report of a Case Clinically Mimicking Pancreatic Cancer and a Literature Review. Medicine (Baltimore) 94 (42):e1656. doi: 10.1097/MD.0000000000001656 [DOI] [PMC free article] [PubMed] [Google Scholar]
- 108.Ruan Z, Jiao J, Min D, Qu J, Li J, Chen J, Li Q, Wang C (2018) Multimodality imaging features distinguish pancreatic carcinoma from mass-forming chronic pancreatitis of the pancreatic head. Oncol Lett 15 (6):9735–9744. doi: 10.3892/ol.2018.8545 [DOI] [PMC free article] [PubMed] [Google Scholar]
- 109.Nagamachi S, Nishii R, Wakamatsu H, Mizutani Y, Kiyohara S, Fujita S, Futami S, Sakae T, Furukoji E, Tamura S, Arita H, Chijiiwa K, Kawai K (2013) The usefulness of (18)F-FDG PET/MRI fusion image in diagnosing pancreatic tumor: comparison with (18)F-FDG PET/CT. Ann Nucl Med 27 (6):554–563. doi: 10.1007/s12149-013-0719-3 [DOI] [PubMed] [Google Scholar]
- 110.Yeh R, Dercle L, Garg I, Wang ZJ, Hough DM, Goenka AH (2018) The Role of 18F-FDG PET/CT and PET/MRI in Pancreatic Ductal Adenocarcinoma. Abdom Radiol (NY) 43 (2):415–434. doi: 10.1007/s00261-017-1374-2 [DOI] [PubMed] [Google Scholar]
- 111.Malesci A, Balzarini L, Chiti A, Lucignani G (2004) Pancreatic cancer or chronic pancreatitis? An answer from PET/MRI image fusion. Eur J Nucl Med Mol Imaging 31 (9):1352. doi: 10.1007/s00259-004-1583-0 [DOI] [PubMed] [Google Scholar]
- 112.Rizzo S, Botta F, Raimondi S, Origgi D, Fanciullo C, Morganti AG, Bellomi M (2018) Radiomics: the facts and the challenges of image analysis. Eur Radiol Exp 2 (1):36. doi: 10.1186/s41747-018-0068-z [DOI] [PMC free article] [PubMed] [Google Scholar]
- 113.Sandrasegaran K, Lin Y, Asare-Sawiri M, Taiyini T, Tann M (2019) CT texture analysis of pancreatic cancer. Eur Radiol 29 (3):1067–1073. doi: 10.1007/s00330-018-5662-1 [DOI] [PubMed] [Google Scholar]
- 114.Cheng SH, Cheng YJ, Jin ZY, Xue HD (2019) Unresectable pancreatic ductal adenocarcinoma: Role of CT quantitative imaging biomarkers for predicting outcomes of patients treated with chemotherapy. Eur J Radiol 113:188–197. doi: 10.1016/j.ejrad.2019.02.009 [DOI] [PubMed] [Google Scholar]
- 115.Cui Y, Song J, Pollom E, Alagappan M, Shirato H, Chang DT, Koong AC, Li R (2016) Quantitative Analysis of (18)F-Fluorodeoxyglucose Positron Emission Tomography Identifies Novel Prognostic Imaging Biomarkers in Locally Advanced Pancreatic Cancer Patients Treated With Stereotactic Body Radiation Therapy. Int J Radiat Oncol Biol Phys 96 (1):102–109. doi: 10.1016/j.ijrobp.2016.04.034 [DOI] [PubMed] [Google Scholar]
- 116.Eilaghi A, Baig S, Zhang Y, Zhang J, Karanicolas P, Gallinger S, Khalvati F, Haider MA (2017) CT texture features are associated with overall survival in pancreatic ductal adenocarcinoma - a quantitative analysis. BMC Med Imaging 17 (1):38. doi: 10.1186/s12880-017-0209-5 [DOI] [PMC free article] [PubMed] [Google Scholar]
- 117.Attiyeh MA, Chakraborty J, Doussot A, Langdon-Embry L, Mainarich S, Gönen M, Balachandran VP, D’Angelica MI, DeMatteo RP, Jarnagin WR, Kingham TP, Allen PJ, Simpson AL, Do RK (2018) Survival Prediction in Pancreatic Ductal Adenocarcinoma by Quantitative Computed Tomography Image Analysis. Ann Surg Oncol 25 (4):1034–1042. doi: 10.1245/s10434-017-6323-3 [DOI] [PMC free article] [PubMed] [Google Scholar]
- 118.Hyun SH, Kim HS, Choi SH, Choi DW, Lee JK, Lee KH, Park JO, Kim BT, Choi JY (2016) Intratumoral heterogeneity of (18)F-FDG uptake predicts survival in patients with pancreatic ductal adenocarcinoma. Eur J Nucl Med Mol Imaging 43 (8):1461–1468. doi: 10.1007/s00259-016-3316-6 [DOI] [PubMed] [Google Scholar]
- 119.Jvd Putten, Zinger S, Sommen Fvd, de With PH, Prokop M, Harmans J Quantitative CT based radiomics as predictor of resectability of pancreatic adenocarcinoma. In: Proc. SPIE 10575, Medical Imaging 2018: Computer-Aided Diagnosis, 105753O (27 February 2018, 2018. doi: 10.1117/12.2291746 [DOI] [Google Scholar]
- 120.Cheng MF, Guo YL, Yen RF, Chen YC, Ko CL, Tien YW, Liao WC, Liu CJ, Wu YW, Wang HP (2018) Clinical Utility of FDG PET/CT in Patients with Autoimmune Pancreatitis: a Case-Control Study. Sci Rep 8 (1):3651. doi: 10.1038/s41598-018-21996-5 [DOI] [PMC free article] [PubMed] [Google Scholar]
- 121.Jang S KJ CS, Park S, Jan H (2019) Diagnostic Performance of Computerized 3D CT Texture Analysis of Pancreas for the Assessment of Patients with Diabetes. Paper presented at the European Congress of Radiology Vienna, Austria, [Google Scholar]
- 122.Löhr M, Klöppel G, Maisonneuve P, Lowenfels AB, Lüttges J (2005) Frequency of K-ras mutations in pancreatic intraductal neoplasias associated with pancreatic ductal adenocarcinoma and chronic pancreatitis: a meta-analysis. Neoplasia 7 (1):17–23. doi: 10.1593/neo.04445 [DOI] [PMC free article] [PubMed] [Google Scholar]
- 123.Chartrand G, Cheng PM, Vorontsov E, Drozdzal M, Turcotte S, Pal CJ, Kadoury S, Tang A (2017) Deep Learning: A Primer for Radiologists. Radiographics 37 (7):2113–2131. doi: 10.1148/rg.2017170077 [DOI] [PubMed] [Google Scholar]
- 124.Zhu Z XY, Xie L, Fishman EK, Yuille AL (2018) Multi-Scale Coarse-to-Fine Segmentation for Screening Pancreatic Ductal Adenocarcinoma. doi:arXiv:1807.02941[cs.CV] [Google Scholar]
- 125.Roth H LL, Farag A, Shin H, Liu J, Turkbey E, Summers R (2015) DeepOrgan: Multi-level Deep Convolutional Networks for Automated Pancreas Segmentation. Paper presented at the International Conference on Medical Computing and Computer Assisted Interventions, Munich, Germany, [Google Scholar]
- 126.Djuric-Stefanovic A, Masulovic D, Kostic J, Randjic K, Saranovic D (2012) CT volumetry of normal pancreas: correlation with the pancreatic diameters measurable by the cross-sectional imaging, and relationship with the gender, age, and body constitution. Surg Radiol Anat 34 (9):811–817. doi: 10.1007/s00276-012-0962-7 [DOI] [PubMed] [Google Scholar]
- 127.Phillip V, Zahel T, Danninger A, Erkan M, Dobritz M, Steiner JM, Kleeff J, Schmid RM, Algül H (2015) Volumetric gain of the human pancreas after left partial pancreatic resection: A CT-scan based retrospective study. Pancreatology 15 (5):542–547. doi: 10.1016/j.pan.2015.06.007 [DOI] [PubMed] [Google Scholar]
- 128.Summers RM (2016) Progress in Fully Automated Abdominal CT Interpretation. AJR Am J Roentgenol 207 (1):67–79. doi: 10.2214/AJR.15.15996 [DOI] [PMC free article] [PubMed] [Google Scholar]
- 129.Caglar V, Songur A, Yagmurca M, Acar M, Toktas M, Gonul Y (2012) Age-related volumetric changes in pancreas: a stereological study on computed tomography. Surg Radiol Anat 34 (10):935–941. doi: 10.1007/s00276-012-0988-x [DOI] [PubMed] [Google Scholar]
- 130.Syed AB, Mahal RS, Schumm LP, Dachman AH (2012) Pancreas size and volume on computed tomography in normal adults. Pancreas 41 (4):589–595. doi: 10.1097/MPA.0b013e318237457f [DOI] [PubMed] [Google Scholar]
- 131.Dimcevski G, Erchinger FG, Havre R, Gilja OH (2013) Ultrasonography in diagnosing chronic pancreatitis: new aspects. World J Gastroenterol 19 (42):7247–7257. doi: 10.3748/wjg.v19.i42.7247 [DOI] [PMC free article] [PubMed] [Google Scholar]
- 132.Engjom T, Kavaliauskiene G, Tjora E, Erchinger F, Wathle G, Lærum BN, Njølstad PR, Frøkjær JB, Gilja OH, Dimcevski G, Haldorsen IS (2018) Sonographic pancreas echogenicity in cystic fibrosis compared to exocrine pancreatic function and pancreas fat content at Dixon-MRI. PLoS One 13 (7):e0201019. doi: 10.1371/journal.pone.0201019 [DOI] [PMC free article] [PubMed] [Google Scholar]
- 133.Kawada N, Tanaka S (2016) Elastography for the pancreas: Current status and future perspective. World J Gastroenterol 22 (14):3712–3724. doi: 10.3748/wjg.v22.i14.3712 [DOI] [PMC free article] [PubMed] [Google Scholar]
- 134.Iglesias-Garcia J, Domínguez-Muñoz JE, Castineira-Alvariño M, Luaces-Regueira M, Lariño-Noia J (2013) Quantitative elastography associated with endoscopic ultrasound for the diagnosis of chronic pancreatitis. Endoscopy 45 (10):781–788. doi: 10.1055/s-0033-1344614 [DOI] [PubMed] [Google Scholar]
- 135.Dominguez-Muñoz JE, Iglesias-Garcia J, Castiñeira Alvariño M, Luaces Regueira M, Lariño-Noia J (2015) EUS elastography to predict pancreatic exocrine insufficiency in patients with chronic pancreatitis. Gastrointest Endosc 81 (1):136–142. doi: 10.1016/j.gie.2014.06.040 [DOI] [PubMed] [Google Scholar]
- 136.He Y, Wang H, Li XP, Zheng JJ, Jin CX (2017) Pancreatic Elastography From Acoustic Radiation Force Impulse Imaging for Evaluation of Diabetic Microangiopathy. AJR Am J Roentgenol 209 (4):775–780. doi: 10.2214/AJR.16.17626 [DOI] [PubMed] [Google Scholar]
- 137.Püttmann S, Koch J, Steinacker JP, Schmidt SA, Seufferlein T, Kratzer W, Schmidberger J, Manfras B (2018) Ultrasound point shear wave elastography of the pancreas: comparison of patients with type 1 diabetes and healthy volunteers - results from a pilot study. BMC Med Imaging 18 (1):52. doi: 10.1186/s12880-018-0295-z [DOI] [PMC free article] [PubMed] [Google Scholar]


