

SUMMARY:
MR imaging of high-altitude cerebral edema shows reversible WM edema, especially in the corpus callosum and subcortical WM. Recent studies have revealed hemosiderin deposition in WM long after high-altitude cerebral edema has resolved, providing a high-altitude cerebral edema “footprint.” We wished to determine whether these microbleeds are present acutely and also describe the evolution of all MR imaging findings. In 8 patients with severe high-altitude cerebral edema, we obtained 26 studies: 18 with 3T and 8 with 1.5T scanners, during the acute stage, recovery, and follow-up in 7 patients and acutely in 1 patient. Imaging confirmed reversible cytotoxic and vasogenic WM edema that unexpectedly worsened the first week during clinical improvement before resolving. The 3T SWI, but not 1.5T imaging, showed extensive microbleeds extending beyond areas of edema seen acutely, which persisted and with time coalesced. These findings support cytotoxic and vasogenic edema leading to capillary failure/leakage in the pathophysiology of high-altitude cerebral edema and provide imaging correlation to the clinical course.
The original MR imaging studies of acute high-altitude cerebral edema (HACE) with 1.5T magnets found FLAIR and T2 abnormalities in the corpus callosum, particularly the splenium.1,2 These findings were transient, attributed to vasogenic edema, and were subsequently confirmed, though descriptions of the time course and resolution of edema were incomplete.3,4 More recent reports using 3T SWI found microbleeds (MBs) in the corpus callosum in patients with a history of HACE 1–35 months previously, but none were studied acutely.5,6 When microbleeds appear in HACE, whether they change with time, how they correlate with edema, and whether their distribution in this illness is specific for HACE are all unknown.
In this study, we describe the evolution of both edema and microbleeds in 8 patients with severe HACE. These MR imaging data contribute to our understanding of HACE pathophysiology and provide clinical imaging correlations that may aid in diagnosis and management.
Materials and Methods
We performed a retrospective study of all patients admitted to our hospital with HACE from 2011 through 2017. We examined MRIs obtained during acute illness and after discharge in all but 1 patient. In addition, we obtained a 10-year follow-up in 1 patient with HACE from 2006. Repeat MRIs were performed at the discretion of clinicians and hence at irregular intervals. Of the 26 MR imaging studies, magnet strength depended on availability: Eighteen were 3T and 8 were 1.5T.
Results
Patients
All patients were evacuated from Colorado mountain communities between 2500 and 3000 m (8200–9840 feet) to the Denver area. Table 1 shows the demographics and clinical course. Seven of 8 had traveled to high altitude within 1 day from a sea level residence; 1 resided at high altitude (patient 5) and returned home after 1 week at low altitude. All patients had typical clinical and imaging findings of high-altitude pulmonary edema (HAPE, Fig 1), and all met the criteria for HACE diagnosis: altered mental status and/or ataxia in a person recently arriving at a high altitude and with acute mountain sickness or HAPE. Other diagnoses were excluded by clinical, laboratory, and imaging evaluations. All patients were treated for HAPE at mountain clinics with supplemental oxygen. Four were intubated, and 6 patients received dexamethasone. Pulmonary edema cleared in all patients during 1–3 days. Bedside callosal (disconnection syndrome) testing findings were normal in the 3 patients who were tested. At hospital discharge, patients were recovering well and returned to their demanding professions.
Table 1:
Patient demographics and clinical course
| Pt ID | Age (yr), Sex | Altitude of Onset | Days to Carea | SpO2 | HACE Symptoms, Findings | Days in Hospital |
|---|---|---|---|---|---|---|
| 1 | 35, M | 2800 m | 4 | 24% | Headache, anorexia, dyspraxia, coma | 13 |
| 2 | 41, M | 2970 m | 5 | 41% | Headache, fatigue, confusion, ataxia | 3 |
| 3 | 32, M | 2740 m | 4 | 50% | Headache, confusion, ataxia | 12 |
| 4 | 23, F | 2930 m | 4 | 48% | Confusion, agitation | 9 |
| 5 | 48, F | 2530 m | 4 | 74% | Crawling, incontinent, confused | 5 |
| 6 | 47, M | 2970 m | 6 | 60% | Confusion, dysarthria, ataxia | 12 |
| 7 | 29, M | 2930 m | 4 | 55% | Progressive confusion | 12 |
| 8 | 34, M | 2750 m | 6 | 39% | Somnolence, confusion, ataxia | 4 |
Note:—Pt ID indicates patient identification; SpO2, peripheral oxygen saturation.
Days from onset of symptoms to presentation to clinic and immediate transfer to hospital.
Fig 1.
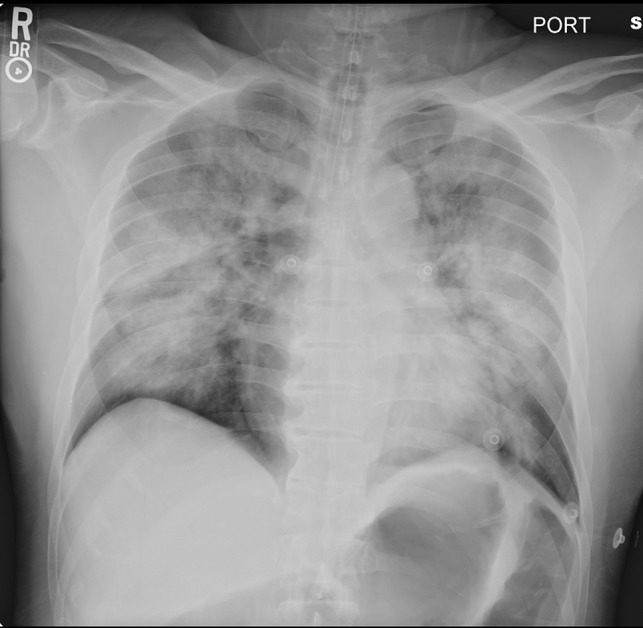
Supine portable chest radiograph of patient 3 on admission to the hospital showing marked pulmonary edema.
MR Imaging Studies
The On-line Table summarizes the timing of MR imaging studies and findings.
FLAIR and T2
All 8 patients on their first scan showed increased FLAIR and T2 signal: 5 patients in the corpus callosum and subcortical WM (Fig 2, On-line Figures 1–8), 2 in subcortical WM only (patients 6 and 8, On-line Figures 9–11), and 1 (patient 5) in the periventricular WM (On-line Figure 12). In the 5 patients with repeat MR imaging within 10 days of the first, WM edema increased before completely resolving (Fig 3, On-line Figures 1–2, 4–7, 10), except for patient 5.
Fig 2.

Patient 7, day 5, 1.5T. Axial FLAIR, diffusion, and ADC map images demonstrate hyperintensity and restricted diffusion in the entire corpus callosum and patchy areas of bilateral subcortical WM.
Fig 3.

Patient 7, 1.5T on days 5 and 10, 3T at 10 years. Axial FLAIR, diffusion, and ADC images. FLAIR hyperintensity in the corpus callosum slightly increases at day 10 and then resolves at 10 years. Restricted diffusion in the corpus callosum decreases at day 10 and resolves at 10 years. Low signal in the genu and splenium of corpus callosum on the FLAIR images at 10 years is due to hemosiderin.
DWI
All 8 patients showed restricted diffusion indicating cytotoxic edema, 7 in the splenium and subcortical WM, mostly corresponding to FLAIR abnormalities (On-line Table and Fig 2, On-line Figures 1–4, 6–8, 11, 13). Patient 6 had small foci of restricted diffusion only in left cerebellar WM and medial right frontoparietal cortex (On-line Figures 9, 10). In 6 patients, restricted diffusion was present on the initial scan, but in 2 patients, it developed or became worse between the initial and second scans. Restricted diffusion resolved in all with follow-up imaging, more quickly than FLAIR and T2 abnormalities. Patient 2 had small lacunar infarcts in the globus pallidi that persisted at follow-up (On-line Figure 3), while patient 4 had a tiny lacunar infarct in left frontal subcortical WM (On-line Figure 7).
Hemosiderin/Microbleeds
All 6 patients imaged with 3T SWI demonstrated extensive microbleeds on the first MR imaging, with a “black pepper-like” appearance, which persisted in those with follow-up imaging (Figs 4 and 5, On-line Figures 14–18). Microbleeds were present throughout the WM, including the deep tracts and middle cerebellar peduncles, but were more numerous in the corpus callosum and subcortical WM, where edema predominated. The number and extent of microbleeds (by visual inspection) did not increase during the first week, in contrast to WM edema. No microbleeds were detected in 2 patients initially scanned at 1.5T using gradient-echo T2* imaging (Fig 6), but they were identified in both patients on follow-up with 3T SWI (Fig 5, On-line Figure 14). The morphology of microbleeds changed with time, coalescing on follow-up images between 2.5 months and 10 years (Fig 6, On-line Figures 16, 18). Two patients had normal DTI tractography findings (On-line Figure 19).
Fig 4.

Patient 2. SWI. Diffuse microbleeds with a predilection for WM tracts, including the corpus callosum and middle cerebellar peduncles and subcortical WM.
Fig 5.

Patient 5, 3T. Hemosiderin-sensitive sequences at 3 days, 8 months, and 2 years. Note uniformly distributed petechial hemorrhages that persist and become more confluent with time.
Fig 6.
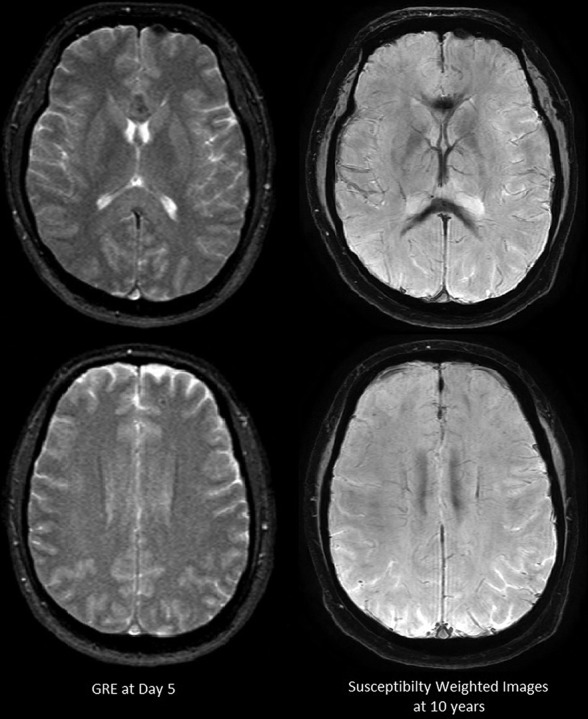
Patient 7. Hemosiderin-sensitive gradient echo with 1.5T on day 5 and SWI on 3T at 10 years. Microbleeds are not apparent on 1.5T. Confluent hemosiderin staining is seen in the corpus callosum at 10-year follow-up.
Discussion
This series of cases demonstrated important new findings regarding MR imaging of HACE. First, we found that extensive WM microbleeds were already present on the initial MR imaging of acutely ill patients. Second, we noted that WM vasogenic edema and, to a lesser extent, restricted diffusion both increased in the first week, even though patients were clinically improving. Both were reversible, consistent with complete recovery. In contrast, microbleeds did not worsen in the first week of hospitalization but did remain detectable for years, though they were missed with T2* gradient-echo sequences obtained at 1.5T. Across time, the microbleeds coalesced. These findings indicate that both cytotoxic and vasogenic edema are present in severe HACE and that capillary leakage is sufficient to produce microbleeds. Furthermore, this work provides a description of the evolution of MR images in HACE that may aid in diagnosis and management.
Microbleeds
All 6 patients on the first MR imaging with SWI showed microbleeds; we thus do not know at what stage of illness these developed. Microbleeds did not appear to correlate with the degree of edema or restricted diffusion on the initial scan or with clinical severity, though all patients were severely ill. Whether these MBs in nonfatal HACE relate to microhemorrhages reported in postmortem examinations7 is unknown, though similar-sized microhemorrhages in other conditions were clearly seen on gross pathology.8 As expected, MBs were more easily detected with higher magnetic strength and SWI.9
The distribution and extent of microbleeds we describe may be distinct for severe HACE. Microbleeds reported in other conditions are usually far fewer in number, in different distributions, and lack the fine black pepper appearance.9 Previous studies using SWI in subjects after high altitude exposure support this view. Eleven of 13 climbers with a history of HACE demonstrated residual MBs, with only severe cases or those with HAPE showing the extensive distribution similar to that in our patients.5,6 Schommer et al6 demonstrated that HAPE, acute mountain sickness, and extreme high altitude exposure by themselves do not cause MBs; Eight climbers with a history of HAPE but without HACE had no MBs, only a few microbleeds were present in 1 of 11 climbers with a history of severe acute mountain sickness, and none were found in the 8 climbers who went to 7000 m without oxygen without altitude illness.6 Kottke et al10 compared microbleeds before and after a Himalayan expedition and found new ones in 3 of 15 climbers who went to >7000 m and did not have HACE or HAPE. These microbleeds were in the splenium but only 1 in 1 climber, and a few in the other 2, in marked contrast to our patients with HACE. Taken together, these studies suggest that WM microbleeds due to high altitude exposure occur infrequently, only becoming extensive as HACE develops, especially with concomitant HAPE.
Vasogenic and Cytotoxic Edema
We confirmed our previous findings of WM vasogenic edema on FLAIR and T2 MR imaging in severe HACE.1 Most interesting, all 5 patients with repeat MR imaging within 10 days of the first one showed greater edema, though they were clinically improving. The imaging findings thus not only lag behind clinical improvement but could be misleading. A possible explanation is delayed vasogenic edema mediated by hemoglobin degradation products, a process known to take several days for maximal accumulation of edema-triggering moieties.11 The decrease in cerebral blood volume and CBF with restoration of normoxia may well have allowed an increase in edema without increasing intracranial pressure.
Seven patients showed reversible restricted diffusion in the corpus callosum with a predilection for the splenium. Such cytotoxic lesions have been reported with various CNS insults, including trauma, infection, drug toxicity, and metabolic abnormalities; they are often confused with ischemia.12 The common pathway for deranged ion transport in these entities may be cytokines, which increase extracellular glutamate, resulting in intracellular swelling and restricted water diffusivity. The corpus callosum, particularly the splenium, may be more susceptible because of more glutamate and cytokine receptors.12 Most interesting, restricted diffusion was delayed in 2 patients, consistent with a mechanism requiring time for accumulation of agents such as inflammatory mediators.
While cytotoxic edema is due to maladaptive ion transport, WM vasogenic edema is driven primarily by hydrostatic forces.11 Both seem to be in play in HACE. Mild vasogenic edema (plasma ultrafiltrate) occurs in most individuals ascending to a moderate altitude (>3–4000 m), regardless of the presence of acute mountain sickness, and is related to increased cerebral perfusion.13 However, as HACE develops, vasogenic edema undergoes “hemorrhagic conversion,”11 with extravasation of red cells and increased edema leading to increased ICP. Exactly what triggers this conversion and what precipitates the restricted diffusion are unclear. Investigators have proposed both mechanical factors, such as impaired autoregulation and excessive capillary hypertension, and permeability factors, such as vascular endothelial growth factor, reactive oxygen species, and other hypoxia-induced factors.13,14 The end result is loss of WM microvascular integrity.
There are analogous findings in HAPE, a frequent precipitant of HACE, which was present in our patients. In fact, HAPE with its severe gas-exchange derangements may be necessary at the modest altitudes in Colorado to trigger HACE, which is more commonly reported above 4000 m. HAPE is a hydrostatic edema due to capillary hypertension, capillary failure, and leakage of red cells, triggered by uneven hypoxic pulmonary vasoconstriction.15 Retinal hemorrhages are common in HACE, present in up to 60% of patients, but are also present in asymptomatic individuals at high altitude.16 The single pathologic study from an individual who died of HACE,17 found retinal capillary leakage. We consider that vascular leak triggered by overperfusion, capillary hypertension, and other factors influencing microvascular integrity may be similar in retinal, cerebral, and pulmonary circulations subjected to extreme hypoxemia.
Some of our findings may be incidental or questionably related to HACE. Patient 5 demonstrated mild T2/FLAIR hyperintensity in periventricular WM in an atypical distribution, which persisted at follow-up imaging, suggesting an alternative cause such as small-vessel ischemic disease. One patient lacked restricted diffusion in the corpus callosum or subcortical WM but did have small reversible foci in the left cerebellar WM and medial right frontoparietal cortex. While possibly due to the same mechanism as in the more typical lesions, ischemia could not be ruled out. Two patients had small lacunar infarcts in the basal ganglia and subcortical WM that persisted at follow-up. Similar lesions have been reported previously, consequent to altitude illness, but how these are related to HACE is unclear.18 One subject, patient 7, had clear corpus callosum atrophy on the MR imaging examination at 10 years (On-line Figure 20) but had no symptoms and normal neurologic examination.
In conclusion, HACE is a potentially fatal neurologic condition, characterized with MR imaging in severe nonfatal cases by extensive fine black pepper microbleeds that leave a permanent imprint. HACE pathophysiology appears to involve reversible vasogenic and cytotoxic edema that progresses to microvascular disruption and thus microbleeds. MR imaging, notably 3T with SWI, detects both edema and microbleeds and may provide an aid in diagnosis, staging, and management of this serious condition.
ABBREVIATIONS:
- HACE
high-altitude cerebral edema
- HAPE
high-altitude pulmonary edema
- MB
microbleed
References
- 1. Hackett PH, Yarnell PR, Hill R, et al. . High-altitude cerebral edema evaluated with magnetic resonance imaging: clinical correlation and pathophysiology. JAMA 1998;280:1920–25 10.1001/jama.280.22.1920 [DOI] [PubMed] [Google Scholar]
- 2. Yarnell PR, Heit J, Hackett PH. High-altitude cerebral edema (HACE): the Denver/Front Range experience. Semin Neurol 2000;20:209–17 10.1055/s-2000-9830 [DOI] [PubMed] [Google Scholar]
- 3. Wong SH, Turner N, Birchall D, et al. . Reversible abnormalities of DWI in high-altitude cerebral edema. Neurology 2004;62:335–36 10.1212/01.WNL.0000103440.64964.86 [DOI] [PubMed] [Google Scholar]
- 4. Venkata Nagesh I, Manoj G, Gurdarshdeep M. High-altitude cerebral edema-serial MRI findings. Wilderness Environ Med 2015;26:278–80 10.1016/j.wem.2014.12.011 [DOI] [PubMed] [Google Scholar]
- 5. Kallenberg K, Dehnert C, Dörfler A, et al. . Microhemorrhages in nonfatal high-altitude cerebral edema. J Cereb Blood Flow Metab 2008;28:1635–42 10.1038/jcbfm.2008.55 [DOI] [PubMed] [Google Scholar]
- 6. Schommer K, Kallenberg K, Lutz K, et al. . Hemosiderin deposition in the brain as footprint of high-altitude cerebral edema. Neurology 2013;81:1776–79 10.1212/01.wnl.0000435563.84986.78 [DOI] [PubMed] [Google Scholar]
- 7. Dickinson J. High altitude cerebral edema: cerebral acute mountain sickness. Seminars in Respiratory and Critical Care Medicine 1983;5:151–58 10.1055/s-2007-1011445 [DOI] [Google Scholar]
- 8. Gibbs WN, Opatowsky MJ, Burton EC. AIRP best cases in radiologic-pathologic correlation: cerebral fat embolism syndrome in sickle cell β-thalassemia. Radiographics 2012;32:1301–06 10.1148/rg.325115055 [DOI] [PubMed] [Google Scholar]
- 9. Haller S, Vernooij MW, Kuijer JPA, et al. . Cerebral microbleeds: imaging and clinical significance. Radiology 2018;287:11–28 10.1148/radiol.2018170803 [DOI] [PubMed] [Google Scholar]
- 10. Kottke R, Pichler Hefti J, Rummel C, et al. . Morphological brain changes after climbing to extreme altitudes: a prospective cohort study. PLoS One 201510:e0141097 10.1371/journal.pone.0141097 [DOI] [PMC free article] [PubMed] [Google Scholar]
- 11. Stokum JA, Gerzanich V, Simard JM. Molecular pathophysiology of cerebral edema. J Cereb Blood Flow Metab 2016;36 513–15 10.1177/0271678X15617172 [DOI] [PMC free article] [PubMed] [Google Scholar]
- 12. Starkey J, Kobayashi N, Numaguchi Y, et al. . Cytotoxic lesions of the corpus callosum that show restricted diffusion: mechanisms, causes, and manifestations. Radiographics 2017;37:562–76 10.1148/rg.2017160085 [DOI] [PubMed] [Google Scholar]
- 13. Wilson MH, Newman S, Imray CH. The cerebral effects of ascent to high altitudes. Lancet Neurol 2009;8:175–91 10.1016/S1474-4422(09)70014-6 [DOI] [PubMed] [Google Scholar]
- 14. Hackett P, Roach R. High altitude cerebral edema. High Alt Med Biol 2004;5:136–46 10.1089/1527029041352054 [DOI] [PubMed] [Google Scholar]
- 15. Maggiorini M, Melot M, Pierre S, et al. . High-altitude pulmonary edema is initially caused by an increase in capillary pressure. Circulation 2001;103:2078–83 10.1161/01.CIR.103.16.2078 [DOI] [PubMed] [Google Scholar]
- 16. Arora R, Jha KN, Sathian B. Retinal changes in various altitude illnesses. Singapore Med J 2011;52:685–88 [PubMed] [Google Scholar]
- 17. Lubin JR, Rennie D, Hackett P, et al. . High altitude retinal hemorrhage: a clinical and pathological case report. Ann Ophthomol 1982;11:1071–76 [PubMed] [Google Scholar]
- 18. Usui C, Inoue Y, Kimura M, et al. . Irreversible subcortical dementia following high altitude illness. High Alt Med Biol 2004;5:77–81 10.1089/152702904322963717 [DOI] [PubMed] [Google Scholar]