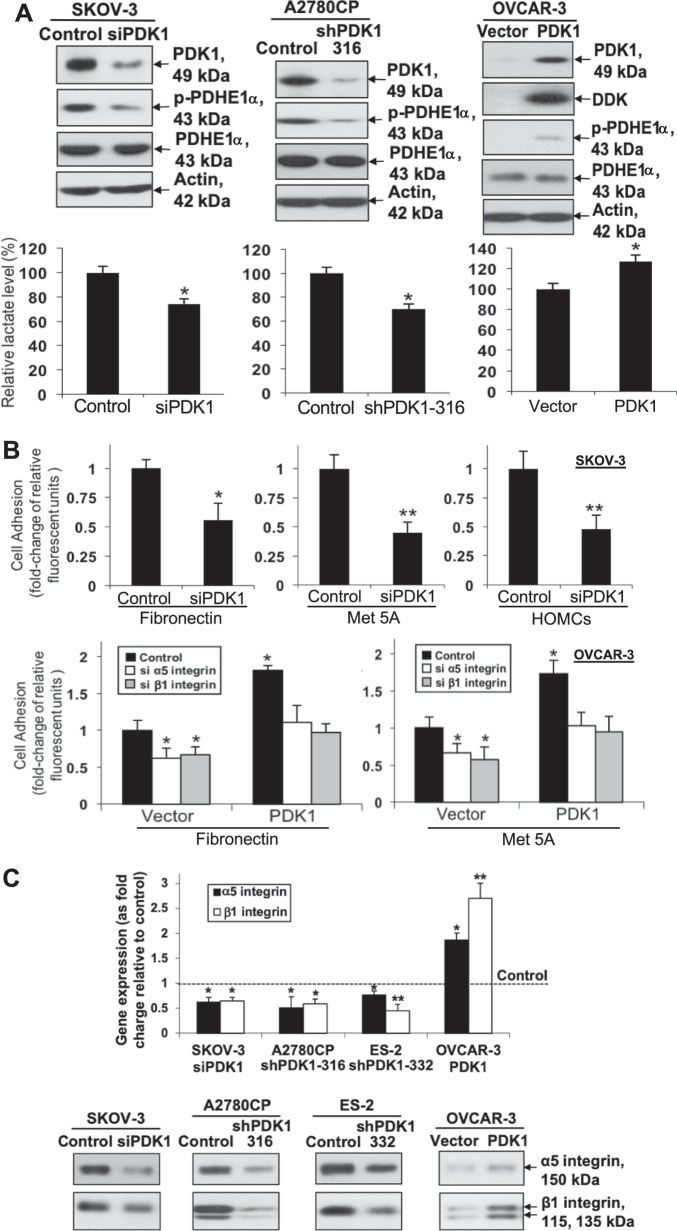
Fig. 2. Knockdown of PDK1 impedes while overexpression of PDK1 promotes lactate production.
PDK1 regulates cell adhesion via α5 and β1 integrin expression. a Upper left: Transient knockdown of PDK1 (via siPDK1) protein expression in SKOV-3, assessed using immunoblot. Upper middle: Stable knockdown of PDK1 protein expression in A2780CP (shPDK1-316), assessed using western blot. Left and middle: p-PDHE1α and PDHE1α protein, and fold change of lactate levels in PDK1-silenced and control SKOV-3 and A2780CP cells determined via immunoblot analysis and lactate colorimetric assay, respectively; Bars: mean ± SD of three experiments; *P < 0.05; Mann–Whitney test. Media from cultured cells were collected and used for measuring lactate levels. Upper right: Immunoblot analysis of exogenous DDK-tagged PDK1 and p-PDHE1α expression in OVCAR-3 cells stably transfected with control vector pCMV6-DDK or DDK-tagged PDK1. Lower right: fold change in lactate levels, compared with control OVCAR-3 cells expressing PDK1; Bars: mean ± SD of three experiments; *P < 0.05; Mann–Whitney test. Media from cultured cells were collected and used for measuring lactate levels. b Upper: Adhesion assay with control SKOV-3 and PDK1-depleted cells. Ovarian cancer cells labeled with 5 μM calcein-AM were added on top of 96-well plates coated with fibronectin, mesothelial MeT-5A cells, or primary human adult omentum-derived mesothelial cells. After 45 min, total fluorescence and fluorescence after washing off were measured. The percentage of bound cells was calculated based on fluorescence after washing, compared with total fluorescence. Cell adhesion to fibronectin, mesothelial Met-5A cells, or primary human adult omentum-derived mesothelial cells presented as fold change, compared with control; Bars: mean ± SD of three experiments; *P < 0.05; **P < 0.005, Mann–Whitney test. Lower: Adhesion assay with control and PDK1-overexpressing OVCAR-3 cells transfected with siRNAs specific for α5 or β1 integrin. Cell adhesion presented as fold change, compared with control; Bars: mean ± SD of three experiments; **P < 0.005; Mann–Whitney test. c qPCR (upper) and immunoblot (lower) analysis of α5 and β1 integrin protein expression in control, siPDK1 SKOV-3, shPDK1-316 A2780CP, shPDK1-332 ES-2, and OVCAR-3 cells expressing PDK1.

