Correction to: Scientific Reports 10.1038/s41598-019-56212-5, published online 23 December 2019
This Article contains an error in the order of the Figures.
Figure 1 was incorrectly published as Figure 3.
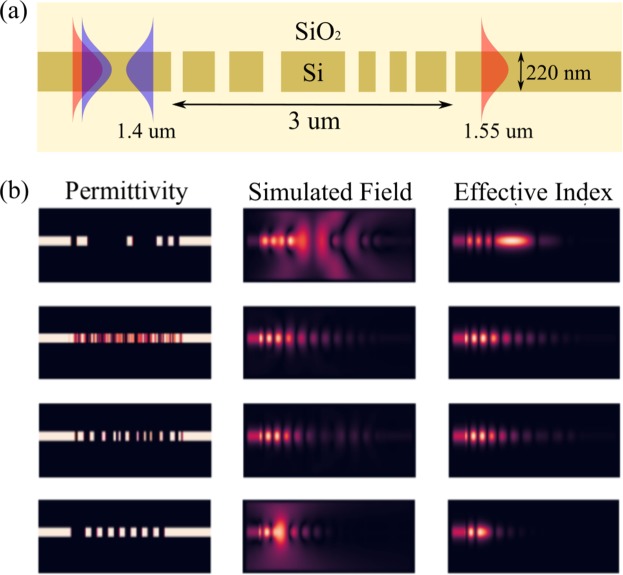
Figure 1.
(a) Schematic of the grating splitter device that comprises the dataset. All the gratings in the dataset are 3 μm long and are designed for a 220 nm silicon-on-insulator (SOI) platform with oxide cladding. We use a uniform spatial discretization of 20 nm while representing Eq. 1 as a system of linear equations. The resulting system of linear equations has 229 × 90 = 20,610 unknown complex numbers. (b) Visualizing samples from the dataset — shown are permittivity distribution, simulated electric fields and effective index fields for 4 randomly chosen samples. All fields are shown at a wavelength of 1.4 μm.
Figure 2 was incorrectly published as Figure 1.
Figure 2.
(a) First five principal components of the electric fields in the grating splitter dataset. (b) Performance of data-driven GMRES on the evaluation dataset when supplied with different number of principal components (~200 samples from the training set were used for computing the principal components) — the dotted line shows the mean residual, and the solid colored background indicates the region within one standard deviation around the mean residual. (c) Histogram of the residual after 100 data-driven GMRES iterations for different N computed over 100 randomly chosen samples from the evaluation dataset. The black vertical dashed line indicates the mean residual after 100 iterations of GMRES over the evaluation dataset.
Figure 3 was incorrectly published as Figure 2.
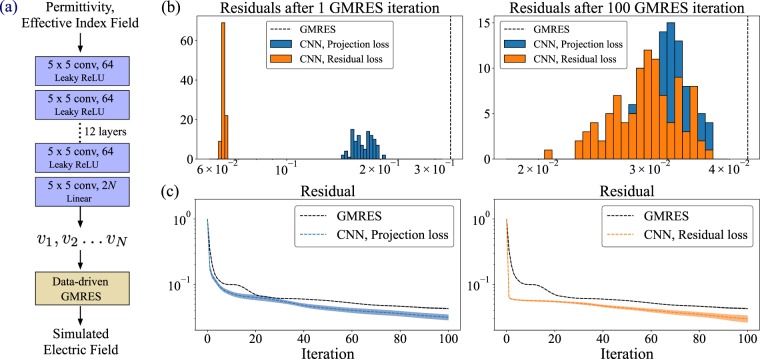
Figure 3.
(a) Schematic of the CNN based data-driven GMRES — a convolutional neural network takes as input the permittivity and effective index field and produces as an output the vectors v1, v2 … vN. These vectors are then supplied to the data-driven GMRES algorithm, which produces the full simulated field. (b) Histogram of the residual after 1 and 100 data-driven GMRES iterations evaluated over the evaluation dataset. We consider neural networks trained with both the projection loss function lproj and residual loss function lres. The vertical dashed lines indicate the mean residual after 1 and 100 iterations of GMRES over the evaluation dataset. (c) Performance of the data-driven GMRES on the evaluation dataset when supplied with the vectors at the output of the convolutional neural networks trained with the projection loss function lproj and the residual loss function lres. The dotted line shows the mean residual, and the solid colored background indicates the region within ± standard deviation around the mean residual.
The correct Figures are reproduced below with their corresponding legends.


