

Necrotizing myositis caused by Streptococcus pyogenes has high morbidity and mortality rates and relatively few successful therapeutic options. In addition, there is no licensed human S. pyogenes vaccine. To gain enhanced understanding of the molecular basis of this infection, we employed a multidimensional analysis strategy that included dual RNA-seq and other data derived from experimental infection of nonhuman primates. The data were used to target five streptococcal genes for pathogenesis research, resulting in the unambiguous demonstration that these genes contribute to pathogen-host molecular interactions in necrotizing infections. We exploited fitness data derived from a recently conducted genome-wide transposon mutagenesis study to discover significant correlation between the magnitude of bacterial virulence gene expression in vivo and pathogen fitness. Collectively, our findings have significant implications for translational research, potentially including vaccine efforts.
KEYWORDS: bacterial pathogenesis, bacterial virulence, dual RNA-seq, necrotizing fasciitis, pathogen-host interaction, Streptococcus pyogenes
ABSTRACT
A fundamental goal of contemporary biomedical research is to understand the molecular basis of disease pathogenesis and exploit this information to develop targeted and more-effective therapies. Necrotizing myositis caused by the bacterial pathogen Streptococcus pyogenes is a devastating human infection with a high mortality rate and few successful therapeutic options. We used dual transcriptome sequencing (RNA-seq) to analyze the transcriptomes of S. pyogenes and host skeletal muscle recovered contemporaneously from infected nonhuman primates. The in vivo bacterial transcriptome was strikingly remodeled compared to organisms grown in vitro, with significant upregulation of genes contributing to virulence and altered regulation of metabolic genes. The transcriptome of muscle tissue from infected nonhuman primates (NHPs) differed significantly from that of mock-infected animals, due in part to substantial changes in genes contributing to inflammation and host defense processes. We discovered significant positive correlations between group A streptococcus (GAS) virulence factor transcripts and genes involved in the host immune response and inflammation. We also discovered significant correlations between the magnitude of bacterial virulence gene expression in vivo and pathogen fitness, as assessed by previously conducted genome-wide transposon-directed insertion site sequencing (TraDIS). By integrating the bacterial RNA-seq data with the fitness data generated by TraDIS, we discovered five new pathogen genes, namely, S. pyogenes 0281 (Spy0281 [dahA]), ihk-irr, slr, isp, and ciaH, that contribute to necrotizing myositis and confirmed these findings using isogenic deletion-mutant strains. Taken together, our study results provide rich new information about the molecular events occurring in severe invasive infection of primate skeletal muscle that has extensive translational research implications.
INTRODUCTION
Molecular interaction between a pathogen and its host can result in asymptomatic carriage and disease and, sometimes, death. Regardless of the ultimate outcome, an important aspect of pathogen and host interaction is that changes in gene transcription shape complex phenotypes such as site of infection, pathogen dissemination, and disease severity. Thus, a fuller understanding of the infection cycle and disease mechanisms requires analysis of molecular events occurring contemporaneously in a pathogen and host.
Streptococcus pyogenes, also known as group A streptococcus (GAS), is a strict human pathogen responsible for >700 million infections and ∼517,000 deaths annually worldwide (1). This organism causes diverse infections that range in severity from relatively mild conditions such as pharyngitis to life-threatening septicemia and necrotizing fasciitis/myositis (2). GAS has been classified historically based on sequence variation in the emm gene encoding M protein, a cell-surface molecule that is antiphagocytic and an important virulence factor (3). Whereas the majority of invasive infections in North America and Europe are caused by a relatively small number of emm types, for example, emm1, emm3, emm12, and emm28 (4–11), strains of these serotypes are relatively rare in high-disease-burden, low-income regions. Despite a century of effort by many investigators, there is no licensed vaccine available to protect humans against GAS disease.
GAS is a primary cause of bacterial necrotizing fasciitis/myositis, an infection that is associated with remarkably high rates of morbidity and mortality. Many different M protein types of GAS can cause deep-tissue necrotizing infections, but strains of M1 are especially prominent. As with many GAS infections, the molecular pathogenesis of necrotizing myositis is complex, with many bacterial molecules implicated. Research over many years has shown that a broad array of secreted and surface-displayed virulence molecules contribute to infection pathogenesis, including but not limited to M protein, cytolytic toxins such as streptolysin O and streptolysin S, degradative enzymes (e.g., streptococcal pyrogenic toxin B cysteine protease, C5a peptidase, and an IgG-cleaving enzyme), and a hyaluronic acid capsule. Although progress has been made in understanding mechanisms contributing to necrotizing infections, much remains to be learned.
To further vaccine and other translational research efforts, several studies have been conducted to elucidate virulence determinants expressed in vivo during different types of infections (12–16). Initial studies measuring gene expression during the interaction of GAS with its host were performed with hybridization approaches that involved custom-made Affymetrix gene chips (17–20). For example, Graham et al. (17) studied GAS genes expressed during experimental soft tissue infection in mice. In addition, in a large study involving 20 nonhuman primates (NHPs), Virtaneva et al. (20) described GAS gene transcript changes that occurred over a 84-day infection cycle that involved initial colonization of the upper respiratory tract (URT), clinical pharyngitis, and subsequent asymptomatic carriage. Similarly, Shea et al. (18) analyzed the complicated relationship between changes in GAS and host NHP transcripts over the URT infection cycle. These and other studies have provided much new data about GAS interactions with the host during invasive and URT infection, but knowledge gaps remain.
Dual transcriptome sequencing (RNA-seq) (21) has afforded the ability to determine transcriptome changes using deep-sequencing technologies, and this technique has been exploited using wild-type strains of multiple GAS serotypes and mutant strains in which different virulence regulators have been inactivated (22–28). Recent development of dual RNA-seq analysis has assisted studies designed to measure transcripts of both pathogen and host during infection (29–32). Most dual RNA-seq studies have used host cell lines to analyze pathogen-host interactions (33–40), resulting in new information about the interplay between the two. However, these experiments share the inherent limitation that cell culture infection models exclude the influence of many host factors and thus are limited compared to the intact-animal milieu. A few studies have used mouse infection models of human pathogens, including work done with Pseudomonas aeruginosa (41), Staphylococcus aureus (42), Clostridium perfringens (43), and Yersinia pseudotuberculosis (44). However, dual RNA-seq work has not been conducted with an NHP experimental infection model and a human-restricted pathogen.
In the present study, we used a well-described NHP model of necrotizing myositis (27, 45, 46) and dual RNA-seq to study the relationship between pathogen and host transcripts. Until now, a limited number of studies have been conducted using dual RNA-seq under in vivo conditions (41, 42, 47–53). In a very recent study, dual RNA-seq was performed on human tissue biopsiy samples obtained from necrotizing soft tissue infections (54). Here, the GAS RNA-seq data were integrated with fitness data generated previously by a genome-wide transposon mutagenesis screen in necrotizing myositis (46) to select genes for further study. We subsequently created isogenic mutant strains and confirmed the pathogenesis role of five genes not previously known to contribute to necrotizing myositis. In the aggregate, use of this multidimensional investigative strategy resulted in discovery of new genes with important roles in virulence during necrotizing myositis in primates.
RESULTS
Altered transcript regulation of GAS during deep skeletal muscle infection in NHPs.
We first examined the relationship between the transcript profiles of GAS strains grown in rich Todd-Hewitt broth supplemented with yeast extract (THY) (classified as grown in vitro) and organisms isolated from infected skeletal muscle tissue from NHPs (classified as grown in vivo). We hypothesized that the transcript pattern of GAS recovered from infected NHP skeletal muscle tissue is significantly different from the transcript pattern of bacteria grown in vitro. This matter is important because the data could be exploited to identify previously undefined genes and mechanisms used by GAS during deep-muscle necrotizing invasive disease.
To address this issue, we infected NHPs with serotype M1 strain MGAS2221, an organism genetically representative of strains causing a recent global pandemic of invasive infections (27). This strain had been used previously in NHP necrotizing myositis studies (46, 55). Sections from infected skeletal muscle tissue and uninfected controls were processed 24 h postinoculation following a standard procedure required by our approved NHP infection protocol (46, 55), and GAS transcript data were obtained by RNA-seq. Between 5 × 10⁸ and 2.1 × 10⁹ total transcript reads were obtained from each animal (Fig. 1A). Reads mapping to both GAS and NHP genomes constituted a negligible proportion and were excluded from further analysis. The distribution of reads mapping either to the GAS genome or to the genome of mock-infected or infected NHPs is shown in Fig. 1B and C. Importantly, there was very high correlation (R2 range, 0.87 to 0.99) between the biological replicates, comparing either the in vitro GAS samples analyzed in triplicate or the pooled in vivo GAS samples for each NHP (see Table S1A in the supplemental material). Similarly, the correlation was very high (R2 range, 0.94 to 0.96) for the infected and mock-infected NHP samples (Table S1A).
FIG 1.
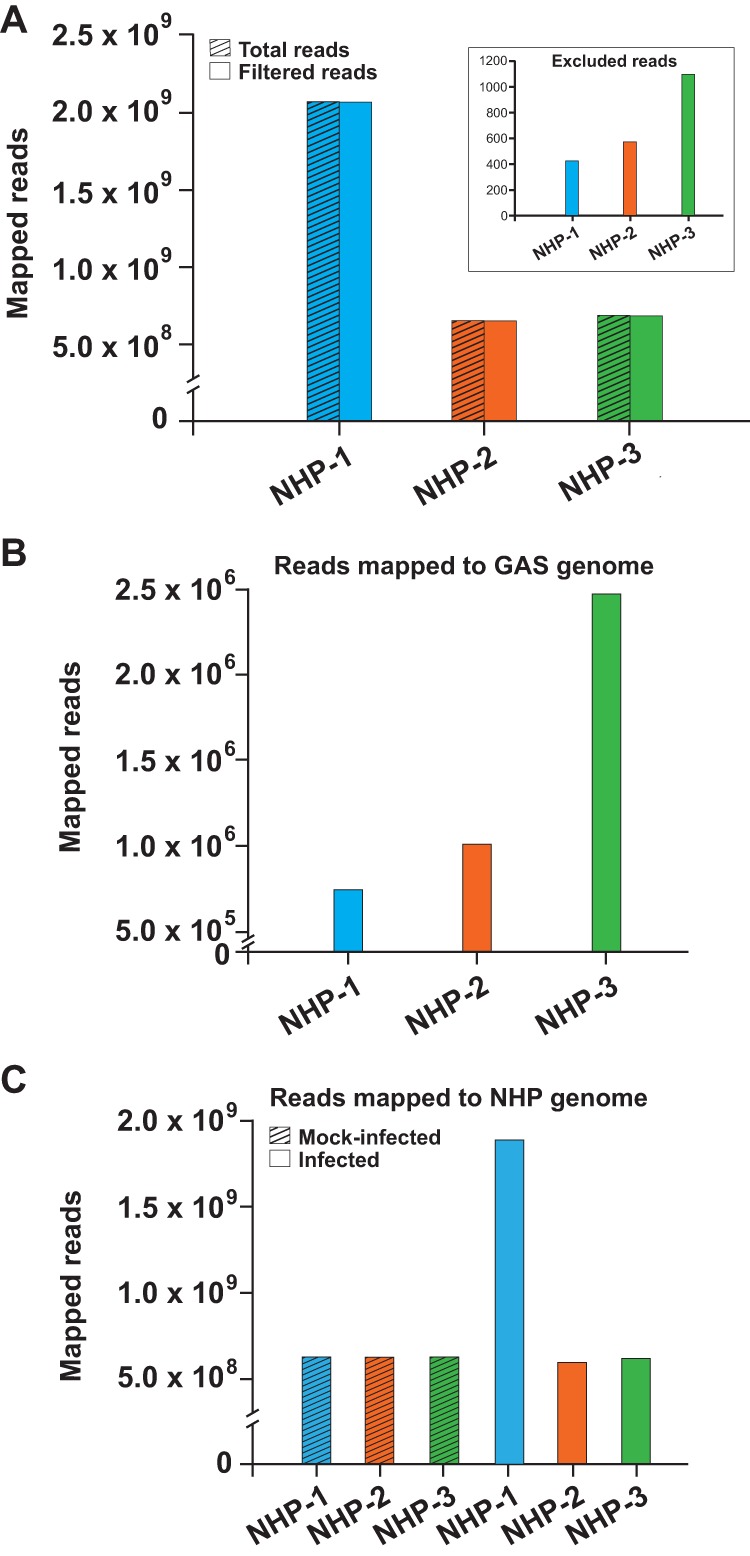
Mapping of transcript reads from in vivo samples to GAS and NHP genomes. Numbers of transcript reads per sample are shown. (A) Total number of sequence reads corresponding to each of the three NHPs (hatched columns). Reads simultaneously mapping to both NHP and GAS genomes were excluded (inset). Solid columns represent filtered reads, calculated by subtracting excluded reads from the total number of transcript reads. (B) Number of transcript reads mapping to the reference GAS genome (strain MGAS2221) corresponding to each of the three NHPs. (C) Number of transcript reads corresponding to each of the three NHPs mapping to the NHP genome (http://useast.ensembl.org/Macaca_fascicularis/Info/Annotation). The number of reads mapping to either the GAS genome (panel B) or the genome of mock-infected or infected NHPs (panel C), respectively, was 7.0 × 10⁵ (GAS) or 5.8 × 10⁸/1.9 × 109 for NHP-1, 1.0 × 10⁶ (GAS) or 6.2 × 10⁸/5.8 × 108 for NHP-2, and 2.5 × 10⁶ (GAS) or 6.3 × 10⁸/6.1 × 108 for NHP-3.
Differentially expressed GAS genes comparing in vivo and in vitro samples. (A) Correlation coefficients for transcript data for in vivo and in vitro replicates. (B) Differentially expressed genes comparing in vivo versus in vitro ME and ES samples combined. (C) Differentially expressed genes comparing in vivo versus in vitro ME samples. (D) Differentially expressed genes comparing in vivo versus in vitro ES samples. (E) Differentially expressed genes encoding transcriptional regulators. (F) Virulence, metal homeostasis, and stress genes differentially expressed in vivo compared to both ME and ES phases in vitro. (G) Differentially expressed GAS genes comparing pooled sections 1 and 2 to pooled sections 3, 4, and 5. (H) Differentially expressed virulence genes comparing MGAS2221 and MGAS2221 ΔSpy0281. (I) Upregulated genes comparing MGAS2221 to MGAS2221 ΔdahA and to MGAS2221 ΔcovR. (J) Locus tag equivalence between MGAS2221 and MGAS5005. Download Table S1, XLSX file, 0.2 MB (227.3KB, xlsx) .
Copyright © 2020 Kachroo et al.
This content is distributed under the terms of the Creative Commons Attribution 4.0 International license.
Consistent with our hypothesis that the transcriptome of GAS grown in vivo in skeletal muscle is substantially different from that of GAS grown in vitro, three distinct clusters were identified by principal component analysis (PCA), corresponding to GAS samples from strains grown in vitro collected at either the mid-exponential (ME) or the early stationary (ES) growth phase and strains obtained from the infected NHPs (in vivo) (see Fig. S1A in the supplemental material). We collected tissue sections in a concentric fashion with respect to the central inoculation site for the purpose of analyzing transcript changes based on spatial distribution (Fig. S2A). The central inoculation site had higher levels of edema, necrosis, and neutrophils and a higher bacterial load than the more distal sections with fewer GAS bacteria, as shown by CFU counts and consistent with previous data (46). When the in vivo samples taken from each section were not pooled prior to PCA, tighter clustering was evident only for section 1, corresponding to the central inoculation site (Fig. S1B and C). The NHP samples clustered into two separate groups, corresponding to the infected and mock-infected samples (Fig. S1D). Furthermore, analyzing pooled sections from the three NHPs, the infected and mock-infected sections clustered separately and, as seen in the PCA, there was a higher level of transcriptional variation among the infected sections than among the mock-infected sections (Fig. S1E).
Transcriptome analysis of GAS grown in vitro and in vivo and NHP samples. Principal-component analyses of transcriptome data were performed. The fold change value cutoff and adjusted P value cutoff were 1.5 and ≤0.05, respectively. (A) In vitro-grown GAS strains in triplicate at the mid-exponential (ME) and early stationary (ES) phases of growth and in vivo-grown GAS strains collected from three nonhuman primates (NHP). Five samples (sections 1 through 5) collected from each NHP were pooled for analysis. The in vitro ME replicates clustered together and grouped distinctly apart from the in vitro ES samples, and both the ME and ES replicates grouped apart from the in vivo samples. These three distinct clusters are highlighted within ovals. (B) In vivo-grown GAS samples are depicted as separate sections. Five sections corresponding to each NHP are highlighted. The sections are color coded, whereas NHPs are indicated by geometric shapes as follows: NHP-1, circles; NHP-2, triangles; NHP-3, squares. (C) In vivo grown samples from panel B shown at a larger scale. Phages and mobile genetic elements were excluded from the analysis. (D) Infected and mock-infected samples from three NHPs (NHP-1, blue; NHP-2, red; NHP-3, green). Data from mock-infected samples (hatched squares) and infected animals (nonhatched circles) clustered distantly from each other. (E) Infected (red) and mock-infected (blue) samples separated by sections. Each section was pooled from three NHPs. All sections corresponding to the mock-infected tissue clustered distinctly together, away from sections corresponding to infected tissue. Download FIG S1, EPS file, 0.5 MB (541.2KB, eps) .
Copyright © 2020 Kachroo et al.
This content is distributed under the terms of the Creative Commons Attribution 4.0 International license.
Sample collection for dual RNA-seq analysis and GAS genes differentially expressed during infection, grouped by functional categories. (A) The samples were processed in concentric sections. Section 1, at the center, corresponds to the inoculation site, and section 5 is the most distal section. The section-to-section borders are idealized and are less discrete than portrayed. Sections from infected tissue are color coded. Section 1 from the uninfected arm muscle corresponds to the inoculation site, where only PBS was injected. (B) Genes differentially expressed (DE) in vivo versus in vitro in the ME and ES growth phases combined. (C) Genes DE in vivo versus in vitro in the ME growth phase (nonhatched) and in vivo versus in vitro in the ES growth phase (hatched). The plots represent the percentage of up- and downregulated genes in each category. Functional categories were obtained from PATRIC (https://www.patricbrc.org/) for serotype M1 reference strain MGAS5005. Upregulated genes are represented in red and downregulated genes in blue. The fold change value cutoff and adjusted P value cutoff were 1.5 and ≤0.05, respectively. Download FIG S2, EPS file, 0.5 MB (559.8KB, eps) .
Copyright © 2020 Kachroo et al.
This content is distributed under the terms of the Creative Commons Attribution 4.0 International license.
Inasmuch as the transcriptome groups were separated by PCA, we next used linear discriminant analysis to identify genes that would enable effective differentiation among the groups. We found that essentially every differentially expressed gene was suitable for discriminating among the groups (data not shown). This result is consistent with the clear separation of the groups identified by PCA.
Distinct GAS transcriptome landscape in NHP necrotizing myositis.
The PCA data indicated that the transcriptome of GAS recovered from the infected NHP skeletal muscle differed markedly from that of GAS grown in vitro, regardless of whether the comparator was ME-phase or ES-phase in vitro-grown organisms (Fig. 2A) (Table 1; see also Table S1B, C, and D). Although transcript profile differences were identified between each of the two growth phases and in vivo GAS, to conserve space, we have concentrated on the description of common themes identified in the two data sets considered in the aggregate (that is, ME and ES in vitro versus in vivo). Overall, 472 genes (29.8% of 1,584 coding genes, after excluding rRNA, tRNA, and phage genes) were differentially expressed during in vivo infection (Fig. 2A), and 92.8% of those 472 genes had concordant differential expression, that is, were regulated in the same direction in the ME and ES phases. Relative to GAS grown in vitro, we observed upregulation of genes that encode stress genes, transcriptional regulators, virulence factors, and membrane transporters, among others (Fig. 2B) (Fig. S2B; see also Table S1B, C, and D). In addition, there was substantial alteration of transcripts from genes encoding proteins that would reshape GAS energy metabolism. Highly expressed genes encoding virulence factors and transcriptional regulators during in vivo infection are shown in Fig. 3A and C. Genes encoding 52 transcriptional regulators were significantly differentially expressed during in vivo compared to in vitro infection (Fig. 3D; see also Table S1E). Several known transcriptional regulators that include two-component regulatory systems were highly upregulated, including adcR (8-fold), ciaH and ciaR (11-fold), and ihk-irr (11-fold). In addition, the transcript abundances of genes encoding many virulence factors were increased (Fig. 3B; see also Table S1F). For example, 14 genes and/or operons involved in capsule synthesis, cytotoxicity, surface-associated proteins/adhesins, and immune evasion were highly (≥5-fold) upregulated in vivo, including the sagA-I operon (streptolysin S), slr (Listeria internalin A homolog), lmb (encoding laminin binding protein), htpA (encoding a histidine triad protein), hasABC (capsule synthesis genes), speA2, nga/ifs/slo, sclA, sic, spd3, spyA, mac, isp, speJ, the streptin locus, and spnA (Fig. 3B). Similarly, genes that are involved in metal ion homeostasis and which have a documented role in pathogenesis, including regulation of iron (siaABC, shr, shp, and hupYZ) (56, 57), zinc (adcRBCA) (58, 59), and manganese (mtsAB) (60), were upregulated (see Table S1F). Genes encoding enzymes in the glycolytic pathway were downregulated, whereas genes encoding enzymes required for the use of alternative carbon sources (Fig. S3A) and for mixed-acid fermentation (Fig. S3B) were upregulated. Finally, genes likely involved in extracellular oxidative stress defense were significantly upregulated (Fig. S3C).
FIG 2.

Transcriptome signatures corresponding to GAS strains grown in vitro and in vivo. The heat map presents log-transformed normalized transcript counts obtained under the following two experimental conditions: (i) GAS grown in rich medium (in vitro) and harvested at two phases of growth (ME, mid-exponential; ES, early stationary) and (ii) GAS harvested from infected nonhuman primate (NHP) tissue (in vivo). The fold change value cutoff and adjusted P value cutoff were 1.5 and ≤0.05, respectively. (A) Heat map showing expression patterns of genes (n = 472) found to be significantly differentially expressed between in vitro and in vivo samples. Color coding is based on log-transformed normalized count values; blue indicates lower transcript expression, and red indicates higher transcript expression. Also indicated is hierarchical clustering of genes (dendrogram along the y axis) and of in vitro and in vivo GAS samples (dendrogram along the x axis). (B) Heat map highlighting expression profile of genes (n = 110) involved in GAS pathogenesis. Genes are assigned to three broad categories: genes involved in virulence factors, genes encoding transcriptional regulators, and genes involved in responses to stress. Gene names shown in red designate genes subsequently studied in more detail by constructing isogenic deletion-mutant strains.
TABLE 1.
Virulence genes upregulated in vivo
| MGAS5005 gene designationa |
Gene | Function | MGAS2221 gene designationb |
Fold MEc | Fold ESd |
|---|---|---|---|---|---|
| Capsule | |||||
| Spy1851 | hasA | Hyaluronan synthase | Spy1825 | 11.3 | 31.3 |
| Spy1852 | hasB | UDP-glucose 6-dehydrogenase | Spy1826 | 12.0 | 29.2 |
| Spy1853 | hasC | UTP–glucose-1-phosphate uridylyltransferase | Spy1827 | 5.9 | 10.5 |
| Cytolysin/exotoxin | |||||
| Spy0139 | nga | NAD glycohydrolase | Spy0183 | 5.2 | 35.1 |
| Spy0140 | ifs | Immunity factor for SPN | Spy0184 | 6.1 | 30.1 |
| Spy0141 | slo | Streptolysin O | Spy0185 | 5.7 | 27.8 |
| Spy0351 | spyA | c3 family ADP-ribosyltransferase | Spy0403 | 7.4 | 11.5 |
| Spy0562 | sagA | Streptolysin S precursor | Spy0598 | 121.0 | 35.1 |
| Spy0563 | sagB | Streptolysin S biosynthesis protein | Spy0599 | 30.8 | 14.1 |
| Spy0564 | sagC | Streptolysin S biosynthesis protein | Spy0600 | 25.6 | 13.8 |
| Spy0565 | sagD | Streptolysin S biosynthesis protein | Spy0601 | 27.3 | 16.9 |
| Spy0566 | sagE | Streptolysin S putative self-immunity protein | Spy0602 | 26.2 | 17.0 |
| Spy0567 | sagF | Streptolysin S biosynthesis protein | Spy0603 | 21.2 | 13.7 |
| Spy0568 | sagG | Streptolysin S export ATP-binding protein | Spy0604 | 25.7 | 16.1 |
| Spy0569 | sagH | Streptolysin S export transmembrane protein | Spy0605 | 32.5 | 19.1 |
| Spy0570 | sagI | Streptolysin S export transmembrane protein | Spy0606 | 27.2 | 16.2 |
| Secreted/immune evasion | |||||
| Spy0668 | mac | IgG-degrading protease | Spy0700 | 4.6 | 8.4 |
| Spy0981 | cfa | CAMP factor | Spy0993 | 5.2 | NSf |
| Spy1169 | spd3 | Streptodornase | Spy1179 | 5.3 | 19.4 |
| Spy1415 | sdaD2 | Phage-encoded streptodornase | Spy1430 | 2.9 | 4.6 |
| Spy1684 | ska | Streptokinase | Spy0254 | NS | 6.3 |
| Spy1715 | scpA | C5A peptidase precursor | Spy1697 | NS | 3.8 |
| Spy1718 | sic | Streptococcal inhibitor of complement | Spy1699 | 7.6 | 18.5 |
| Spy1723 | ispe | Immunogenic secreted protein | Spy1703 | 8.4 | 3.5 |
| Spy1734 | spi | Streptopain protease inhibitor | Spy1713 | 1,080.7 | NS |
| Spy1735 | speB | Streptococcal pyrogenic exotoxin B | Spy1714 | 912.3 | NS |
| Spy1738 | spd | Phage-associated deoxyribonuclease | Spy1717 | 70.5 | NS |
| Superantigens | |||||
| Spy0182 | speG | Exotoxin type G precursor | Spy0222 | 2.1 | 3.8 |
| Spy1702 | smeZ | Mitogenic exotoxin Z | Spy0238 | NS | 2.6 |
| Spy0356 | speJ | Exotoxin type J precursor | Spy0408 | 4.1 | 5.9 |
| Spy0996 | speA2 | Phage-encoded exotoxin | Spy1009 | 20.4 | 21.8 |
| Surface-associated/adhesins | |||||
| Spy1711 | lmb | Laminin binding protein | Spy0229 | 84.1 | 8.6 |
| Spy1710 | htp | Streptococcal histidine triad protein | Spy0230 | 80.5 | 8.5 |
| Spy1687 | sclA | Collagen-like surface protein A | Spy0251 | NS | 26.2 |
| Spy0561 | epf | Putative extracellular matrix binding protein | Spy0597 | 2.4 | 2.6 |
| Spy0740 | fbp | Fibronectin-binding protein | Spy0771 | NS | 2.1 |
| Spy1109 | slr | Internalin protein | Spy1122 | 54.1 | 48.6 |
| Spy1719 | emm1 | M protein | Spy1700 | NS | 2.1 |
| Transcriptional regulators | |||||
| Spy0947 | ciaH | TCSg histidine kinase | Spy0962 | 10.2 | 8.4 |
| Spy0948 | ciaR | TCS response regulator | Spy0963 | 14.0 | 12.7 |
| Spy1318 | rocA | TCS accessory protein | Spy1324 | 2.3 | 2.3 |
| Spy1720 | mga | Standalone regulator | Spy1701 | 1.5 | 2.3 |
| Spy1724 | ihk | TCS histidine kinase | Spy1704 | 10.5 | 6.5 |
| Spy1725 | irr | TCS response regulator | Spy1705 | 16.1 | 10.2 |
| Other | |||||
| Spy0281 | dahA | Putative role in defense against stress | Spy0340 | NS | 5.0 |
Gene designation for MGAS5005.
Gene designation for MGAS2221.
Fold differential expression comparing in vivo to in vitro ME samples.
Fold differential expression comparing in vivo to in vitro ES samples.
Genes highlighted in bold were chosen for isogenic deletion-mutant strain generation.
NS, not significant.
TCS, two-component system.
FIG 3.

GAS virulence genes highly transcribed during in vivo infection and upregulated in vivo compared to in vitro. (A) Virulence factor genes that are highly transcribed during in vivo infection are shown. Log-transformed mean expression (normalized) counts are plotted. Genes are considered highly transcribed if their normalized expression values are in the top 75th percentile. (B) The y-axis values represent the mean fold change values determined from combined data from the ME and ES in vitro growth phases. Both genes and operons are represented. The horizontal red line corresponds to 5-fold change, an arbitrarily chosen level designed to highlight the magnitude of change. Virulence genes upregulated ≥5-fold are considered to be substantially upregulated. (C) Transcriptional regulators highly transcribed during in vivo infection. Log-transformed mean expression (normalized) counts are plotted. (D) Transcriptional factors upregulated during in vivo infection compared to in vitro growth. Fold change data from in vivo versus in vitro ME and ES comparisons were averaged, and log-transformed mean log-fold changes are shown (y axis). Gene names shown in red designate genes subsequently studied in more detail by constructing isogenic deletion-mutant strains. The fold change value cutoff and adjusted P value cutoff were 1.5 and ≤0.05, respectively.
Differentially expressed GAS genes implicated in carbon metabolism and extracellular oxidative stress defense in GAS. “Spy” numbers correspond to the annotation for serotype M1 reference strain MGAS5005. The fold change value cutoff and adjusted P value cutoff were 1.5 and ≤0.05, respectively. (A) Genes encoding glycolytic enzymes are downregulated, and genes involved in transport and utilization of ascorbate, malate, maltose, and glycerol are upregulated. Genes differentially expressed in vivo, compared to in vitro, at ME and/or ES growth phases are color coded. Upregulated genes are shown in red and downregulated genes in blue. Fold change values are represented in parentheses, with the first value corresponding to in vivo versus in vitro ME and the second value to in vivo versus in vitro ES. –, no differential expression. (B) Shift from homolactic fermentation to mixed-acid fermentation inferred from downregulation of ldh, encoding lactate dehydrogenase, and upregulation of lctO, encoding lactate oxidase, formate transport and assimilation, and mixed-acid fermentation. A reduction in lactate production is likely to result in decreased autoacidification. (C) (Top panel) Schematic of the ccdA, tlpA, and msrA operon in serotype M1 GAS. The transcriptional start site (i) (red arrow) was described previously by Rosinski-Chupin et al. (https://doi.org/10.1186/s12864-019-5613-5). The inferred enzymatic functions of the encoded proteins are indicated. The fold upregulation values in vivo, compared to both in vitro growth conditions, are depicted in parentheses (ME/ES). –, no differential expression. (Bottom panel) Proposed mechanism for GAS extracellular oxidative stress defense during invasive infections (ii) based on data for Streptococcus pneumoniae. Reducing equivalents (e-) from NADPH are channeled through the thioredoxin system in the cytoplasm and transferred to the outer side of the cell across CcdA. In turn, CcdA transfers the reducing equivalents to the thiol-disulfide oxidoreductase TlpA and through to the bifunctional methionine sulfoxide reductase MsrA. The result is increased protection from oxidation of cysteine residues in secreted proteins and reduction of methionine sulfoxides (iii to v), both likely occurring as a consequence of PMN oxidative burst. This system might also contribute to GAS extracellular protein folding (vi). Download FIG S3, PDF file, 1.0 MB (1,001.3KB, pdf) .
Copyright © 2020 Kachroo et al.
This content is distributed under the terms of the Creative Commons Attribution 4.0 International license.
Analysis of changes in the NHP transcriptome during GAS invasive infection.
We found that the transcriptomes from the skeletal muscle of NHPs infected with GAS differed substantially from the transcriptomes from mock-infected NHP skeletal muscle (Fig. S1D and E). Compared to mock-infected animals, 1,218 host genes were significantly upregulated and 305 genes were downregulated (Table S2A). Genes encoding proteins involved in the immune response, inflammation, and host defense were significantly upregulated in tissue from infected NHPs (Table S2B). For example, genes encoding cytokines (interleukin-1A [IL-1A], IL-1B, IL-6, IL-7, IL-10, IL-24, and IL-33) and chemokines (CCL11, CCL20, CCL7, CXCL1, CXCL2, CXCL5, CXCL6, CXCL8, and CXCL16) and matrix metalloproteases (MMP1, MMP8, MMP9, and MMP25) were upregulated. We also observed upregulation of genes associated with polymorphonuclear leukocytes (PMNs) or neutrophils, cells that are important components of the early innate immune response. For example, genes encoding proteins involved in recognition of bacterial pathogens, such as pattern recognition receptors (e.g., CD14 and Toll-like receptors [TLRs]); in recruitment of PMNs to the infection site (the gene encoding IL-8 was upregulated by 1,000-fold); and in PMN degranulation and induction of the bactericidal cascade (myeloperoxidase) and inflammatory cascade (IL-1α, IL-1β, IL-1RN, IL-6, IL-7, IL-10, IL-24, IL-33, CCL11, CCL20, CCL7, CXCL1, CXCL2, CXCL5, CXCL6, CXCL8/IL-8, CXCL16, and tumor necrosis factor alpha [TNF-α]), were upregulated, perhaps as a consequence of upregulation of TREM1 signaling (upregulated 287-fold, P = 1.03E–15) and additional pathogen receptors (Table S2A; see also Fig. S4A).
Pathway analysis of differentially expressed genes in infected NHP tissue and heat map depicting relationship between gene coexpression modules. (A) Top 50 pathways associated with differentially expressed genes in the infected NHP tissue compared to mock-infected tissue. y axis data depict –log (P value). Pathways with P values of ≤0.05 were considered significant. Host pathways containing genes that were upregulated (top panel) or downregulated (bottom panel) during infection are indicated. (B) Heat map depicting similarity of gene coexpression modules (based on eigengene adjacency) among and between the 15-pathogen modules (PM) and 10-host modules (HM) identified by WGCNA (7). Eigengenes are module representatives, and eigengene adjacency is computed based on their correlation. The heat map is colored based on adjacency score as follows: red represents high adjacency (positive correlation), and blue represents low adjacency (negative correlation). GAS gene modules 5 and 6 (marked with an asterisk [*]) were positively correlated with host gene modules 7, 8, and 9 (highlighted in red) and negatively correlated with host gene modules 1 to 4 (highlighted in blue). Download FIG S4, PDF file, 0.4 MB (430KB, pdf) .
Copyright © 2020 Kachroo et al.
This content is distributed under the terms of the Creative Commons Attribution 4.0 International license.
DE genes and significantly enriched biological processes associated with upregulated and downregulated genes comparing infected versus mock-infected NHPs. (A) Differentially expressed genes. (B) Significantly enriched biological processes. Download Table S2, XLSX file, 0.2 MB (254.5KB, xlsx) .
Copyright © 2020 Kachroo et al.
This content is distributed under the terms of the Creative Commons Attribution 4.0 International license.
A prominent finding observed in the downregulated category was the identification of genes encoding skeletal muscle and connective tissue proteins (Table S2B) such as actin, myosin, tropomyosin, dystrophin, and troponin (Fig. S4A; see also Table S2A). Together, these data are consistent with the substantial degree of tissue destruction and necrotic muscle observed by detailed gross pathological examination of the sections in GAS-infected animals (data not shown).
In addition to protein-coding genes, RNA transcripts for various long intergenic noncoding RNAs (lincRNAs) and microRNAs (miRNAs) were differentially regulated in the infected NHP tissue compared to mock-infected samples (Table S2A). Seven lincRNAs and 12 microRNAs were significantly upregulated (9-fold to 500-fold and 4-fold to 60-fold, respectively), and five (1 lincRNA and 4 miRNA) were downregulated. MicroRNAs such as miR-221, miR-222, and miR-223 were significantly upregulated in the infected host. Although their role in serious invasive GAS infection remains unexplored, they have been reported to be involved in host immune response and inflammation (61–63). Interestingly, microRNAs downregulated in infected host tissue, including miR-30A, miR-133A1, and miR-1 and miR-2, participate in skeletal muscle development and function (64, 65).
We compared the normalized read counts obtained from infected NHPs to the normalized counts of human patient samples from monomicrobial infections caused by S. pyogenes (n = 12) recently published by Thänert et al. (54). We found that 87% of the top 100 of the most highly transcribed genes from the infected NHPs were also highly transcribed in the human patient samples. Moreover, among the highly transcribed NHP genes (top 100), 50%, including S100A8, S100A9, CXCL8, HLA-A, NFKBIA, UBC, FPR2, PTX3, and THBS1, were involved in stress response and inflammation. However, a comparison of differential expression results from our study (NHP infected versus mock infected) to their monomicrobial (S. pyogenes) patient data could not be performed due to the unavailability of control samples (i.e., uninfected/healthy tissue) samples in the study by Thänert et al. (54).
To test for a GAS-specific immune response in the host, we analyzed serum biomarkers in infected and uninfected hosts. Of 17 serum biomarkers (cytokines, chemokines, and other immune-related host molecules) tested by immunoassays (see Text S1 in the supplemental material), we found 9 whose levels were significantly increased in GAS-infected NHPs at 24 h postinoculation compared to preinfection values (Fig. S5A). Importantly, the levels of 11 of these biomarkers were significantly increased in serum from humans infected with GAS compared to healthy, uninfected controls (Fig. S5B). Seven serum biomarkers were significantly increased in both NHP and human cohorts. Taken together, these results are consistent with the NHP host transcriptome data and suggest that the NHP model closely mimics the human immune response to invasive GAS infection.
List of supplemental tables, study design, additional methods, and supplemental materials references. Download Text S1, DOCX file, 0.1 MB (84.4KB, docx) .
Copyright © 2020 Kachroo et al.
This content is distributed under the terms of the Creative Commons Attribution 4.0 International license.
Biomarker analysis of serum samples from humans and NHPs. The biomarkers selected for the custom panel were as follows: (i) BAFF/BLyS/TNFSF13B; (ii) CTSS/cathepsin S; (iii) CCL7/monocyte chemoattractant protein-3 (MCP-3)/MARC; (iv) CD30/TNFRSF8; (v) CD44; (vi) CD163; (vii) CXCL2/GRO beta/MIP-2/CINC-3; (viii) Fas/TNFRSF6/CD95; (ix) interferon (IFN) gamma; (x) IL-1 RII; (xi) IL-2; (xii) IL-8/CXCL8; (xiii) MMP-1; (xiv) S100A9; (xv) TNF-α; (xvi) TNF RII/TNFRSF1B; and (xii) TRAIL R3/TNFRSF10C. Red dots/bars, infected NHPs/patients. Blue dots/bars, uninfected NHP/control human serum. (A) Serum samples collected from 17 NHPs prior to inoculation with GAS and at the time of necropsy. The Wilcoxon matched-pair signed rank test was used to compute the P values. (B) Serum samples collected from three infected human patients and from nine healthy, uninfected donors. Statistical significance was computed using the Mann-Whitney U test. The y-axis data in both panels are represented on a log10 scale. Download FIG S5, EPS file, 0.5 MB (560KB, eps) .
Copyright © 2020 Kachroo et al.
This content is distributed under the terms of the Creative Commons Attribution 4.0 International license.
Pathogen-host gene correlation networks.
To investigate possible pathogen-host interactions based on our dual RNA-seq data, we used weighted gene coexpression network analysis (WGCNA) (66) to cluster positively correlated genes into pathogen- and host-specific network modules. On the basis of the normalized transcript counts of the pathogen and the host genes, WGCNA grouped highly correlated genes into clusters/modules. The GAS genes clustered into 15 pathogen modules and the NHP genes into 10 host modules (Table S3A; see also Fig. S4B). A COG enrichment analysis showed that GAS modules 5 and 6 were significantly enriched in genes involved in carbohydrate transport/metabolism (COG category G; P value = 0.000) and virulence (COG category V; P value = 0.006) and in posttranslation modification (COG category O; P value = 0.006) and virulence (COG category V; P value = 0.000), respectively (Table S3B). Moreover, an examination of the eigengene network showed that GAS modules 5 and 6 were strongly positively correlated with three host gene modules (modules 7, 8, and 9) involved in immune response, inflammation, and response to stress (Table S3A), a result suggesting that upregulation of GAS virulence genes triggers an immune response in the host. Conversely, GAS modules 5 and 6 were negatively correlated with NHP modules involved in muscle development, contraction, maintenance, and integrity (modules 1 to 4; see Table S3).
(A) Functional categories associated with the host gene modules (HM) identified by WGCNA. (B) COG enrichment analysis for pathogen modules (PM). Download Table S3, PDF file, 0.3 MB (327.2KB, pdf) .
Copyright © 2020 Kachroo et al.
This content is distributed under the terms of the Creative Commons Attribution 4.0 International license.
Dual RNA-seq identifies significant differences in spatially distinct transcriptomes.
Our experimental design permitted us to test the hypothesis that the GAS and host transcriptomes differ as a function of distance from the inoculation site. To test this hypothesis, we compared the GAS transcriptomes as a function of anatomic relationship to the primary inoculation site. For this spatial (section-to-section) transcriptome analysis, GAS read counts were pooled for each section from the three NHPs. Consistent with the hypothesis, we found that the transcriptomes for sections 1 and 2 differed substantially compared to the transcriptomes for sections 3 through 5 (Fig. 4A). Combining the expression data from sections 1 and 2 (inoculation site) and comparing it to that from pooled sections 3, 4, and 5 (distal site), we found 146 genes to be differentially expressed, with a higher fraction of genes upregulated (∼62%) than downregulated (∼38%) in the inoculation site than in the distal site (Table S1G). Various virulence genes, including genes involved in immune evasion (htpA, lmb, sag operon, sdaB, spd3, and spnA), metal ion homeostasis (htpA and lmb), tissue destruction (speB), and cytotoxicity (sag operon), were upregulated, whereas grab, scfA, and scfB were expressed at higher levels at the distal site than at the inoculation site (Fig. 4D). Genes involved in DNA replication, recombination and repair (polA, exoA, topA, uvrA, mutY, and ruvA), cell wall biogenesis (dacA and murA.2), and metabolic adaptation (malate, citrate, and maltose utilization genes) were also differentially expressed. The data suggest that, depending on location relative to a primary infection nidus, there is likely to be a heterogeneous array of GAS transcriptomes in naturally occurring deep-tissue infection in humans. We thus hypothesized that similar spatial trends might be observed in the NHP transcriptome data.
FIG 4.

Spatial analysis of GAS and NHP sections. (A) Hierarchical clustering of GAS transcript profiles from individual tissue sections based on Euclidean distance. Data obtained from tissue sections 1 and 2 (closest to the inoculation site) are closely related and cluster into one group, and data from sections 3, 4, and 5 cluster into a second distinct group. (B) NHP transcripts from infected tissue. Data from sections 1, 2, 3, and 4 are closely related and cluster into one group. (C) NHP transcripts from infected and mock-infected tissue. Data from all five sections from the mock-infected tissue, denoted by asterisks, are closely related and cluster into one group. In each case, S1 through S5 correspond to data from analogous sections for the three NHPs pooled and analyzed together as individual units. Each cluster is demarcated by a red perimeter. (D) Differentially expressed GAS virulence genes comparing pooled sections 1 and 2 to sections 3, 4, and 5. Twenty virulence genes were differentially expressed. The fold change value cutoff and adjusted P value cutoff were 1.5 and ≤0.05, respectively. (E) Selected significantly upregulated immune response genes are depicted on the left, and selected downregulated extracellular matrix organization and skeletal muscle development genes are shown on the right. (Top panel) Comparison of pooled sections 1 through 4 to section 5. Bottom, comparison of pooled sections 1 and 2 to sections 3 through 5. The fold change value cutoff and adjusted P value cutoff were 1.5 and ≤0.05, respectively.
On the basis of the overall expression profile of the NHP transcriptome, sections 1 to 4 clustered together compared to section 5 (most distal section from the inoculation site) (Fig. 4B). Hence, we combined the expression data from sections 1 to 4, compared the combined data to the data from section 5, and found 1,710 genes to be differentially expressed. Pooled sections 1 to 4 showed significant upregulation of immune response factors and of genes involved in defense and neutrophil activation and degranulation and downregulation of genes involved in extracellular structure organization, indicative of reduced tissue integrity (Fig. 4E, top panel). In a different comparison, NHP sections 1 and 2 (proximal to the inoculation site) were compared to sections 3, 4, and 5, and 899 genes were found to be differentially expressed. Interestingly, those same genes alluded to above were also differentially expressed, although at a lower fold change magnitude (Fig. 4E, bottom panel).
Genes contributing to GAS fitness in necrotizing myositis: integration of RNA-seq and TraDIS data.
A recent study using the same parental (wild-type) serotype M1 GAS strain (MGAS2221), experimental infection conditions, and transposon-directed insertion site sequencing (TraDIS) method determined a fitness scale for all nonessential genes in NHP necrotizing myositis (46). The availability of these fitness data permitted us to test the hypothesis that a significant relationship exists between the magnitude of in vivo fitness (as assessed by TraDIS) and gene transcript remodeling. This relationship has been studied to only a very limited extent in other pathogen-host models, generally with somewhat ambiguous findings (67–69). Our analysis identified a significant relationship between in vivo fitness and the in vitro RNA-seq data. Comparison of GAS RNA-seq data obtained under in vivo conditions to those obtained under in vitro conditions (ME and ES phases) found that 43% and 49.6%, respectively, of fitness-related genes identified by TraDIS were significantly differentially expressed (differential fold expression of ≥1.5). These results suggest that a sizeable proportion of genes required for sustaining in vivo infection were responding to cues present in host skeletal muscle, resulting in an altered transcript profile.
Of the fitness-conferring genes (i.e., genes that result in significantly decreased fitness when insertionally inactivated) that are also upregulated in vivo compared to the ME phase (n = 43) or ES phase (n = 51), we identified a significant correlation between transcript fold change (log2; in vivo versus ME or ES phase, dual RNA-seq) and mutant abundance fold change (log2; mutant frequency, TraDIS). The significant P values computed using a 2-tailed test (Spearman rank correlation) were rs = 1 and P = 0 for the TraDIS versus ES comparison and rs = 0.99 and P = 0 for the TraDIS versus ME comparison (Fig. 5). Taken together, the data suggest that, on average, GAS genes that are significantly upregulated in vivo are likely to be important to pathogen fitness. This idea was tested using isogenic mutant strains and animal infection models as described below.
FIG 5.
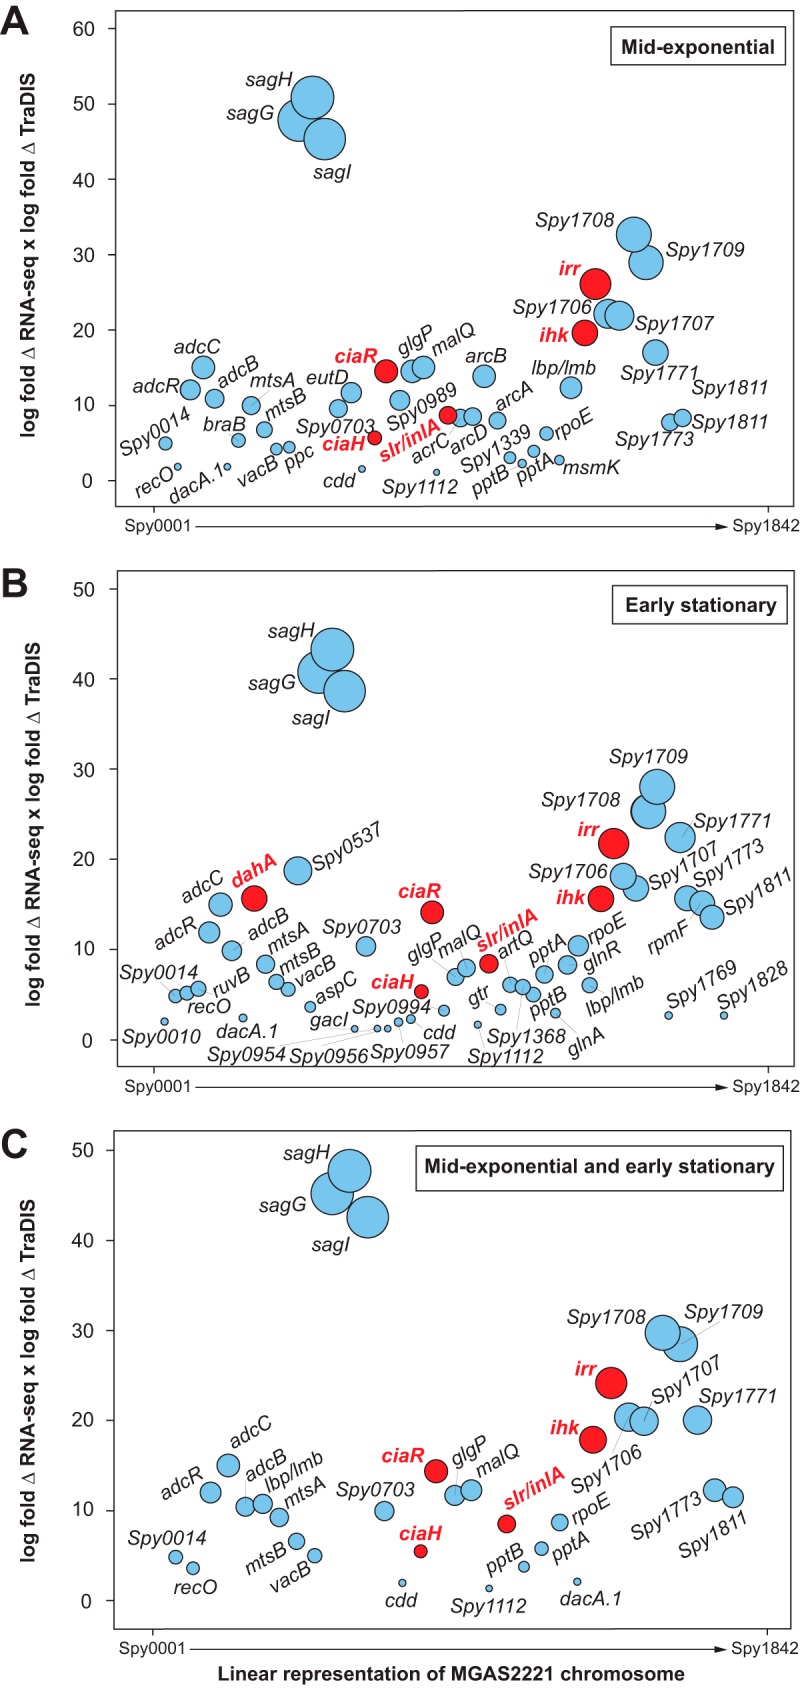
Upregulated GAS genes that contribute to fitness during infection. The y axis represents the product of the log-fold change (log-fold Δ) calculated as the product of in vivo fold change/in vitro fold change, multiplied by the log-fold change calculated in a previous study using the same NHP experimental methods and infecting GAS strain (46). The x axis is a linear representation of the GAS chromosome. The size of the circles is proportionate to the product of the 2-fold changes. Red circles represent genes chosen for further study. Gene names shown in red designate genes subsequently studied in more detail by constructing isogenic deletion-mutant strains. The fold change value cutoff and adjusted P value cutoff were 1.5 and ≤0.05, respectively. (A) Genes upregulated in vivo compared to in vitro ME growth phase. (B) Genes upregulated in vivo compared to in vitro in ES growth phase. (C) Genes upregulated in vivo compared to in vitro in both ME and ES growth phases.
Contribution of five new genes to necrotizing myositis virulence: analysis of Spy0281, ihk-irr, slr, isp, and ciaH.
In principle, the availability of the differential expression data coupled with the TraDIS fitness data affords an enhanced opportunity to exploit this combined information to gain greater understanding of the role of specific genes in pathogen-host interactions, including virulence. There has been little research of this type performed for microbial pathogens. In this context, we elected to study five GAS genes that may participate in necrotizing myositis on the basis of our results here (Table 1; see also Fig. 2, 3, and 5) by constructing isogenic deletion-mutant strains. These five genes were selected based on four criteria: (i) each of the five genes was substantially upregulated in vivo in the animal host compared to growth in vitro; (ii) we had evidence from a previous genome-wide transposon mutagenesis study (46) suggesting that these genes are important in pathogen-host interactions; (iii) the five genes are all highly conserved among GAS strains; and (iv) no previous study had tested the hypothesis that these genes contribute to necrotizing myositis. Due to cost and other limitations, additional virulence factors were not tested in the present study.
First, we studied Spy0281 (here designated dahA, for defense against host protein A), a gene that is differentially upregulated in infected NHPs relative to in vitro-grown organisms, at the ME phase of growth. We selected dahA for analysis because (i) it is located immediately upstream of genes encoding CovR and CovS, an intensively studied gene regulatory two-component system (TCS) that directly or indirectly influences approximately 15% of the GAS transcriptome (70) (Fig. 6A); (ii) in a previous TraDIS fitness screen, dahA was identified as being potentially important during NHP necrotizing myositis (log2 fold change = −6.7) (46), and (iii) DahA is homologous to general stress proteins from several bacterial species, but its function in GAS is not known. To test the hypothesis that dahA contributes to virulence, we created isogenic deletion-mutant strain MGAS2221 ΔdahA and used it in a mouse model of necrotizing myositis. The mutant and wild-type strains had similar growth curves in THY broth (Fig. 6B). However, the mutant strain was significantly less virulent in this infection model (Fig. 6C). Similarly, significantly fewer CFU of the mutant strain than of the wild-type parental strain were cultured from the hindlimbs of infected mice (Fig. 6D), and the resultant lesions were smaller (Fig. 6E). Consistent with the mouse infection data, the isogenic mutant strain was significantly less able to survive exposure to human blood and purified human polymorphonuclear leukocytes (PMNs) than the wild-type parental strain (Fig. 6F). To gain additional information about the role of dahA, we conducted RNA-seq analysis of the isogenic strains grown to the ME or ES phase. We discovered that mutant strain MGAS2221 ΔdahA had a significantly altered transcriptome compared with the wild-type parental strain (Fig. 6G). Importantly, 17 known virulence genes were significantly downregulated in the isogenic deletion-mutant strain, consistent with the decreased virulence phenotype in the mouse model (Table S1H). Thus, deletion of dahA significantly altered the transcriptome, including transcript levels of many virulence genes, strain virulence in mice, and survival when exposed to human PMNs (Fig. 6).
FIG 6.

Assessment of virulence of GAS isogenic mutant strains. (A) Schematic showing the Spy0281 (dahA) chromosomal region. dahA encodes a putative stress-related protein, and covRS encode a two-component system (TCS) involved in virulence. The red arrow marks the transcriptional start site for covRS (97). (B) Strains were grown at 37°C in THY medium. (C) Virulence of wild-type MGAS2221 and isogenic mutant MGAS2221 ΔdahA in a mouse model of necrotizing myositis (n = 20 mice per strain). (D) CFU recovered from the inoculation site of mice. Replicate data (n = 35) are expressed as means ± SEM. P < 0.001, Mann-Whitney U test. (E) Representative gross images of mouse hindlimbs infected with the strain MGAS2221 (left) and isogenic MGAS2221 ΔdahA strain (right). Lesion areas are boxed in white. Scale bar, 1 cm. (F) MGAS2221 and isogenic mutant strain MGAS2221 ΔdahA exposed to purified human PMNs. Percent bacterial survival was assessed at 1 and 3 h as indicated. Means ± SEM of the data from 7 separate experiments are shown. (G) Total number of differentially expressed genes comparing wild-type parental strain MGAS2221 and isogenic mutant strain MGAS2221 ΔdahA calculated using a fold cutoff value of ≥1.5 and a P value of ≤0.05. (H) Virulence of wild-type MGAS2221 and isogenic mutant MGAS2221 Δihk-irr in a mouse model of necrotizing myositis (n = 20 mice per strain). (I) Virulence of wild-type MGAS2221 and isogenic mutant MGAS2221 Δslr, MGAS2221 Δisp, and MGAS2221 ΔciaH in a mouse model of necrotizing myositis (n = 20 mice per strain). (J) Virulence of wild-type and isogenic mutant strains (all derived from parental strain MGAS2221) in an NHP model of necrotizing myositis (n = 4 animals per strain). Lesion volume data are expressed as means ± SEM. P < 0.05, Kruskal-Wallis test. (K) Counts of CFU recovered from the inoculation site of NHPs are expressed as means ± SEM. P < 0.05, Kruskal-Wallis test. All isogenic mutant strains were derived from parental strain MGAS2221.
We next examined the role of the ihk-irr TCS (71) in necrotizing myositis. This TCS was studied because (i) it was strikingly upregulated in vivo (Table S1); (ii) it is important for GAS survival during infection (15, 72–74); (iii) it has been shown previously to be involved in evasion of host innate immune responses, including PMN-mediated killing (75); and (iv) it was identified as contributing to fitness in the TraDIS fitness screen in NHP necrotizing myositis (46). However, the role of ihk-irr in necrotizing myositis has not been addressed. To test the hypothesis that ihk-irr is involved in necrotizing infection, isogenic mutant strain MGAS2221 Δihk-irr was used in the mouse model of this disease. Consistent with the hypothesis, the results show that the deletion-mutant strain was significantly less virulent than the wild-type parental strain (Fig. 6H).
We studied a third gene in the context of experimental NHP necrotizing myositis. slr (Spy1109) encodes an extracellular protein with leucine-rich repeats that is homologous to InlA in the Listeria monocytogenes internalin family of proteins (76). L. monocytogenes InlA anchors the pathogen to the host cell surface by binding E-cadherin and may have a role in bacterial internalization (77, 78). Slr has a domain with histidine triad motifs that is predicted to bind divalent metal cations. Of note, slr was shown previously to be significantly upregulated when GAS was grown under conditions of zinc starvation (59). These observations suggest that slr is involved in zinc acquisition, a process known to affect GAS virulence (58). We studied the GAS slr gene because (i) it was highly upregulated in vivo in our dual RNA-seq data (Fig. 3B), (ii) it was identified as contributing to fitness by TraDIS analysis of NHP necrotizing myositis (46), (iii) serologic analysis showed that Slr is expressed in vivo in humans with various types of GAS infection (76), and (iv) its role in necrotizing myositis had not been addressed. To test the hypothesis that Slr is involved in necrotizing infection, isogenic mutant strain MGAS2221 Δslr was used in the mouse model of this disease. Consistent with the hypothesis, results show that the deletion-mutant strain was significantly less virulent than the wild-type parental strain (Fig. 6I).
We examined the potential contribution of the isp gene to necrotizing myositis. The isp gene (encoding an immunogenic secreted protein, or Isp) is located immediately downstream of the ihk-irr TCS and encodes a conserved 59-kDa GAS surface protein that induces antibody responses in humans (79). Isp has a CHAP domain located at the carboxy terminus, suggesting that it may be a peptidoglycan hydrolase with a potential role in cell wall metabolism. However, the biological function of Isp is not known, nor is it known if this protein contributes to necrotizing myositis. To test the hypothesis that Isp is involved in necrotizing infection, isogenic mutant strain MGAS2221 Δisp was used in the mouse model. Consistent with the hypothesis, results show that the deletion-mutant strain was significantly less virulent than the wild-type parental strain (Fig. 6I).
The ciaH gene encodes the histidine kinase sensor protein of the CiaHR regulator two-component system (TCS). ciaH has been reported to be involved in GAS responses to acid and oxidative stresses (80). Interestingly, a previous virulence study found that the ciaH deletion mutant was not attenuated in a mouse model of infection, but the route of inoculation was not specified (80). We used the mouse model of necrotizing myositis to test the hypothesis that deletion of ciaH significantly decreases virulence. The results demonstrate that the ciaH isogenic deletion-mutant strain was significantly attenuated in mice (Fig. 6I).
Inasmuch as GAS is a human-specific pathogen and the dahA, ihk-irr, slr, isp, and ciaH virulence genes were identified in TraDIS and dual RNA-seq studies performed in NHPs, we sought to confirm the role of each gene in necrotizing myositis using the NHP model. The results showed that each isogenic deletion-mutant strain caused significantly smaller lesions than the MGAS2221 parental wild-type parental strain (Fig. 6J), with significantly lower CFU levels recovered from the infection site (Fig. 6K). These results confirm a role of each of the five GAS genes in experimental necrotizing myositis in primates.
DISCUSSION
Our understanding of the molecular mechanisms used by GAS to initiate and sustain a severe invasive infection, especially during devastating cases of necrotizing myositis, is limited. To address this knowledge deficit, we used a multidimensional investigative strategy employing dual RNA-seq analysis of an extensively documented NHP model of necrotizing myositis (27, 45, 46, 55), coupled with integration of TraDIS fitness data (46) and analysis of isogenic deletion-mutant strains of GAS. Because GAS is a human-specific pathogen, because NHPs are phylogenetically closely related to humans, and because some GAS virulence factors are specific for human or NHP molecules, this animal model best approximates human disease. Our studies identified five new GAS genes encoding virulence factors that significantly contribute to necrotizing myositis. The changes in the NHP transcriptome observed in infected compared to mock-infected animals are consistent with the substantial degree of damaged tissue observed in the animals. In the aggregate, our results significantly enhance understanding of the complex molecular processes transpiring during pathogen-host interactions in necrotizing myositis, knowledge that can be exploited for subsequent basic and translational research activities. A model summarizing the new pathogen and host data presented in this work, together with selected previously reported findings bearing on the molecular mechanisms at work in necrotizing myositis, is presented in Fig. 7.
FIG 7.

Model of interaction of pathogen- and host-encoded factors to drive GAS-mediated necrotizing myositis pathology. GAS is well adapted to evade host innate immune responses in NHPs and humans. The model is based on new data presented here and includes selected other GAS and host factors crucial for various stages of invasive infection described in the literature, as detailed below. Note that not all pertinent genes and proteins could be included due to space constraints. (A) GAS initiates an acute inflammatory response caused by host recognition of streptococcal components such as lipoteichoic acid and peptidoglycan via extracellular (TLR1, TLR2, TLR4, TLR5, CR, TREM1, and FcR) and intracellular (TLR8) pattern recognition receptors. GAS subverts PMN activation and recruitment by expressing many factors such as hyaluronic acid capsule and M protein and degrading host inflammatory mediators involved in PMN recruitment. (B) GAS evades phagocytosis by producing many antiphagocytic factors (e.g., capsule, M protein). Phagocytosed GAS evade killing by PMNs by secreting cytotoxins (SLO and SPN) and destroying PMNs migrating to the infection site (SLS). GAS-encoded secreted DNases attenuate antimicrobial activity by degrading neutrophil extracellular traps (NETs). Other secreted factors such as streptococcal inhibitor of complement (SIC) and SpeB provide resistance to host antimicrobial peptides (AMPs). In addition, GAS resists host-induced trace metal starvation by upregulating genes involved in acquisition of zinc, iron, copper, and manganese. (C) Host cell destruction and tissue necrosis. GAS factors such as SLO, SLS, and SpeB directly damage cells and induce apoptosis and necrosis via accelerating cell death by triggering activation of proapoptotic host genes. PMN lysis and GAS virulence factors such as SpeB cause skeletal muscle destruction and necrosis as seen by the downregulation of genes involved in skeletal muscle maintenance and integrity. Proteins encoded by upregulated NHP genes are shown in red and downregulated genes in green. Proteins encoded by significantly upregulated GAS genes are shown in blue. AMP, antimicrobial peptide; PRR, pattern recognition receptor; GAS, group A streptococcus; NLRP, NOD-like receptor; CR, complement receptor; FcR, immunoglobulin receptor; TREM-1, triggering receptor expressed on myeloid cells; PGLYRP, peptidoglycan recognition protein; MPO, myeloperoxidase; BPI, bactericidal/permeability-increasing protein; MYLK3, myosin light chain kinase; MYH6, myosin heavy chain; ACTN2, actinin, alpha; ACTA1, actin, alpha; TCAP, titin cap; GSN, gelsolin; DMD, dystrophin; SGCB, sarcoglycan beta; EGF, epidermal growth factor; CTNNA3, catenin alpha; LAMA2, laminin subunit alpha; ADCY6, adenylate cyclase.
Dual RNA-seq has been performed on a limited number of pathogens infecting intact hosts (48, 49, 53). In general, previous studies have focused predominantly on descriptive analyses of the resulting data. That is, relatively little new proven gene-specific mechanistic understanding has resulted. As a consequence, we opted to exploit the pathogen transcript data integrated with our previous transposon mutagenesis data to select genes for further analysis using isogenic deletion-mutant strains in subsequent necrotizing myositis pathogenesis studies. Using this integrative and iterative multidimensional strategy, we unambiguously demonstrated that five GAS genes participate in this frequently fatal infection. For example, we showed that dahA contributes to adaptation, fitness, and disease in this host environment (Fig. 6). The dahA gene is located immediately upstream of covR and covS, an extensively studied TCS (Fig. 6A) that regulates expression of approximately 15% of the GAS transcriptome when grown in vitro (70). Consistent with CovRS being predominantly a negative gene regulator, inactivation of covRS increases expression of many genes encoding key virulence factors and enhances disease severity (19, 81). dahA is negatively regulated (directly or indirectly) by covR, at both the ME and ES phases of growth (82). In addition, dahA was identified as contributing to fitness in vivo during TraDIS analysis in an NHP model of necrotizing myositis (46). Importantly, 39 genes encoding known virulence factors were differentially expressed in vitro in the ΔdahA strain compared to the wild-type parental strain (see Table S1H in the supplemental material). Additionally, we found an overlap in upregulated genes between the MGAS2221 ΔdahA and MGAS2221 ΔcovR mutant strains (Table S1I), described in a previous study (82). Seventeen of these genes were downregulated, including some with well-known critical roles in virulence, including sic, emm, ropB, speB, hasABC, and mga. Thus, dahA has a complex role in pathogen-host interaction, as many virulence genes are upregulated and many are downregulated. The net effect of the differential in vivo gene regulation in a dahA mutant is significantly decreased virulence in two animal models of necrotizing myositis. Additional research is under way to further investigate the role of dahA in GAS molecular pathogenesis. Similarly, we demonstrated that the ihk-irr TCS (71) contributes to necrotizing myositis. Our finding adds to previous work showing that this TCS is important for GAS survival during infection, likely as a consequence of altering the expression of multiple genes contributing to innate host defense (15, 72–74). In addition, our data show that the slr gene encoding a GAS surface-displayed protein with leucine-rich repeats participates in necrotizing myositis. We previously reported that convalescence-phase serum samples from patients with GAS invasive infections, soft tissue infections, pharyngitis, and rheumatic fever react with Slr (76), indicating that this protein is expressed in vivo in infected humans. In the future, it will be important to test the hypothesis that vaccination with one or more of these virulence factors can elicit protective immunity in animal disease models. As stated previously, there is no licensed human S. pyogenes vaccine. As a corollary to these studies, we will test whether one or more of these five virulence factors are potential vaccine candidates via protection studies in mouse or NHP models of infection.
Consistent with the likely situation in humans, we observed some variability in differentially expressed GAS genes between the three NHPs (see Fig. S1D and E in the supplemental material). However, importantly, the animal-to-animal variability was largely due to variation in the magnitude of fold change in individual gene transcripts, rather than to the spectrum of differentially expressed genes. Thus, for all NHPs, the in vivo GAS transcriptome is very distinct from that in in vitro-grown cells, regardless of growth phase.
With respect to metabolic adaptation, GAS genes encoding enzymes in the Embden-Meyerhof-Parnas (glycolysis) pathway were downregulated in vivo whereas genes encoding enzymes involved in transport and use of alternative carbon sources, such as malate and ascorbate (which are abundant in host tissues) and maltose and glycerol, were upregulated (Fig. S3A). Malate utilization is GAS is upregulated in vitro under acidic stress conditions and in vivo in murine soft tissues (83, 84). This is consistent with data from two recent studies reporting carbohydrate metabolism adaptation and upregulation of production of certain virulence factors during GAS infection (54, 85). Our data are also consistent with GAS undergoing a metabolic switch from homolactic fermentation to mixed-acid fermentation (Fig. S3B).
We observed upregulation of an extracellular oxidative stress defense pathway that uses cytoplasmic thioredoxin as a source of reducing power (Fig. S3C). Broadly similar to a pathway reported for Streptococcus pneumoniae (86), this system is formed by the thiol-disulfide oxidoreductases CcdA and TlpA and the bifunctional methionine sulfoxide reductase MsrA/B, which would protect GAS from the consequences of PMN oxidative burst (87–89). This system may also contribute to GAS extracellular protein folding (90). Importantly, proteins encoded by genes found to be upregulated during infection in our study, including SpeB, SIC (streptococcal inhibitor of complement), and HtpA, are detected in proteomic analyses from human patient samples (91). Taken together, metabolic adjustments made by GAS to the host environment may assist the organism to survive during infection of NHP skeletal muscle.
Our study also addressed a topic germane to many pathogenic microbes. Namely, does a significant relationship exist between the magnitude of in vivo fitness and differential regulation of pathogen genes? Previous studies addressing this matter have yielded mixed results (67–69). For example, Turner et al. (68) compared RNA-seq and Tn-seq data sets for P. aeruginosa and reported poor correlation between the two. Comparison of the GAS RNA-seq data generated here with results obtained from a previous genome-wide transposon mutagenesis screen in NHP necrotizing myositis discovered a significant relationship between these two parameters. Our results contrast with (for example) those reported by Powell et al. (92), who studied the relationship between Tn-seq and RNA-seq data for Snodgrassella alvi, a bacterial gut symbiont in honey bees. The investigators found that there was a general lack (6% overlap) of a significant relationship between the RNA-seq and Tn-seq data. One practical implication from our findings is that our multidimensional integrative strategy could be a fruitful way to triage genes for future pathogenesis and translational research. That is, selection of genes for analysis that are highly expressed and display significantly decreased fitness when inactivated and studied in the environment of interest may provide a productive way to discover new pathogenesis clues. Our results reported here on dahA, ihk-irr, ciaH, isp, and slr provide a proof of principle for this concept and thereby set the stage for additional studies, for example, on genes of unknown function.
Compared to naturally occurring deep-tissue GAS infections in humans, this study was performed under tightly controlled experimental conditions. We used a standard infecting dose of GAS inoculated at the same anatomical site in the three NHPs, and the host tissue samples were collected 24 h later (46, 55). Despite using a standardized infection protocol, we observed some variation in differentially expressed GAS genes between the three NHP hosts, primarily due to variation in the magnitude of fold change in individual gene transcripts, rather than to the spectrum of differentially expressed genes. Furthermore, our spatial (section-to-section) transcriptome analysis yielded variability in gene expression contingent upon anatomic position with respect to the inoculation site. This likely reflects the fact that necrotizing fasciitis/myositis infection outcomes differ from host to host and from tissue to tissue within the same host and might also differ from section to section within the same host tissue, depending on bacterial load (CFU recovered), suggesting that population dynamics and signaling might play a role. Here, we found that some GAS genes encoding or involved in virulence factors, DNA and carbohydrate metabolism, cell wall biogenesis, and dissemination were differentially expressed depending on spatial location with respect to the inoculation site. Importantly, we detected a GAS-associated immunologic response with serum biomarkers in the host (either NHPs or human patients). The levels of several of the tested serum biomarkers were significantly increased in both primate hosts, suggesting that our NHP model of necrotizing myositis mimics the human disease.
Our study used only one GAS strain, a serotype M1 organism that genetically represents a pandemic clone that has emerged relatively recently (27). Given that GAS is characterized by extensive genetic diversity, it is possible that other strains will differ in transcriptome and virulence behavior. We used healthy adult NHPs in this study, with no known immunologic defect. Many patients with GAS necrotizing infections have underlying medical conditions that may influence pathogen-host interactions, including disease character. Thus, it is likely that a more comprehensive understanding of the molecular events involved in this devastating infection would require use of different combinations of GAS strains, host infection sites, and experimental infection protocols.
MATERIALS AND METHODS
Bacterial strains and growth media.
For in vitro growth, GAS strains were grown in Todd-Hewitt broth (Becton, Dickinson [BD]) supplemented with 0.2% yeast extract (THY medium). This medium was used (i) because it is a standard medium for GAS growth used by many investigators and (ii) because there is no medium that adequately mimics in vivo conditions. THY medium was supplemented with spectinomycin (150 μg ml−1) as needed. Escherichia coli strains were grown in Luria-Bertani (LB) medium at 37˚C. LB medium was supplemented with spectinomycin (50 μg ml−1), as needed. Trypticase soy agar supplemented with 5% sheep red blood cells (Becton, Dickinson and Co.) was also used for growth of GAS strains. Spectinomycin dihydrochloride pentahydrate was purchased from Sigma. Gap electroporation cuvettes (2-mm gap size) were purchased from BTX Harvard apparatus. Growth experiments were performed as described previously (93). Locus tag equivalence between strains MGAS5005 and MGAS2221 is shown in Table S1J in the supplemental material.
Ethics statement.
All mouse and nonhuman primate studies were performed in accordance with protocols AUP-0318-0016 and AUP-1217-0058 approved by the Institutional Animal Care and Use Committee at the Houston Methodist Research Institute. All studies with human blood and blood components were performed in accordance with a protocol (01-I-N055) approved for human subjects by the Institutional Review Board at the National Institute of Allergy and Infectious Diseases. All study volunteers gave written informed consent.
Nonhuman primate (NHP) skeletal muscle samples.
We used a well-described NHP model of necrotizing myositis (27, 45, 55). Three cynomolgus macaques (2.8 to 6.5 years of age, 2.9 to 3.5 kg of body weight) were studied. Briefly, the animals were sedated, the injection site was marked, and 1 × 10⁸ CFU/kg serotype M1 strain MGAS2221 was inoculated to uniform depths in the right thigh skeletal muscle. Strain MGAS2221 was used because it has wild-type alleles (i.e., the most common allele) for all major transcriptional regulators, because its genome has been sequenced, because it is genetically representative of contemporary epidemic serotype M1 strains, and because it has been used extensively in animal experiments (27). Animals were observed for 24 h and then subjected to necropsy. The infected thigh muscle was removed en bloc, and a 0.5-cm full-thickness transverse section was cut through the injection site with a TissueTek long trimming blade (Bevel). Infected tissue samples weighing ≥150 mg were excised radially in concentric sections from the site of infection and submerged in 2 ml FastPrep tubes (MP Biologicals, Inc.) containing 750 μl of 1× RNA/DNA Shield (ZymoBIOMICS). The samples were collected in duplicate. The sections were numbered 1 through 5, where section 1 corresponds to the inoculation site and 5 to the section most distantly peripheral to the inoculation site (see Fig. S2A in the supplemental material). As a negative control for GAS infection, uninfected skeletal muscle tissue was collected from mock-infected animals given only the same volume of sterile phosphate-buffered saline (PBS). Infected tissue was also collected for quantitative bacterial culture and histopathology examination.
RNA extraction from NHP tissue.
Two sets of five contiguous tissue sections from the same NHP (see Fig. S3 and S6A) were processed simultaneously. The tissue samples were thawed on ice, and sets of two weighing dishes (24-mm and 85-mm inner base diameter) were wiped with RNaseZap (Invitrogen). The thawed tubes containing the tissue samples were weighed with a Sartorius Entris balance (Fisher Scientific), the tissue was removed with a disposable spatula (VWR) and placed on the small (24-mm-diameter) weighing dish which was then placed inside the larger (85-mm-diameter) dish. The tissue was cut with a disposable scalpel (Exel International), and sections were placed on the larger weighing dish and rubbed against the surface to eliminate excess liquid. The tissue (70 to 90 mg) was washed twice by submerging it in an Eppendorf tube containing 1 ml PBS, gently inverted 10 times to eliminate excess RNA Shield, and placed in a 15-ml Falcon tube (Ambion) containing 3 ml of tissue and cell lysis solution, with 10 μl of proteinase K (50 μg/μl) from a MasterPure complete DNA and RNA isolation kit (Lucigen). Tissues were immediately homogenized (Omni tissue homogenizer; Omni International) on ice at 35,000 rpm, using three bursts of 10 s each. The tubes were incubated at 65°C for 15 min, subjected to vortex mixing every 5 min, and kept on ice for 5 min. The lysate in each tube was transferred to precooled 2-ml tubes containing 0.1-mm-diameter and 0.5-mm-diameter beads (ZR BashingBead lysis tubes; Zymo Research), and bead beating was performed at 1,600 rpm for 60 s and was repeated twice. Between the two bead-beating steps, the tubes were centrifuged at 4°C and immediately placed on ice. The tubes were centrifuged at 4°C at 13,000 rpm for 1 min, and the supernatant was transferred to precooled 1.5-ml Eppendorf tubes. RNA was extracted (MasterPure complete DNA and RNA purification kit; Lucigen) using the manufacturer’s instructions with the exception that the extracted RNA was subjected to three consecutive DNase treatments with a Turbo DNA-free kit (Ambion) at 37°C. RNA quality was assessed with an Agilent 6000 Nano kit (Agilent) and an Agilent 2100 Bioanalyzer. The concentration of total RNA was determined with a Qubit RNA BR assay kit (Thermo Fisher Scientific). Depletion of rRNA was performed with a Ribo-Zero Gold rRNA removal kit, epidemiology (Illumina). The efficacy of the ribosomal depletion procedure was assessed with an RNA 6000 Pico kit (Agilent) and an Agilent 2100 Bioanalyzer.
Flow charts depicting tissue collection, cDNA sequencing, and transcriptome data analysis. (A) Pipeline representing tissue collection and storage and sample preparation and processing for total RNA extraction, ribodepletion, cDNA library preparation, and cDNA sequencing. The superscript “(a)” indicates that 0.1-mm-diameter and 0.5-mm-diameter beads were used. The superscript “(b)” indicates that the use of the MasterPure protocol with the modification of three DNase treatments, instead of one. The superscript “(c)” indicates the use of a Ribo-Zero Gold rRNA removal kit. (B) Bioinformatic pipeline for demultiplexing, quality assessment, adapter trimming, read mapping to GAS and NHP genomes, data normalization, and differential expression of transcriptome data. Download FIG S6, EPS file, 0.4 MB (467.3KB, eps) .
Copyright © 2020 Kachroo et al.
This content is distributed under the terms of the Creative Commons Attribution 4.0 International license.
Gene coexpression network analysis.
A weighted gene coexpression network analysis (WGCNA) was performed on the normalized dual RNA-seq section data (n = 15 samples) using the WGCNA R software package (66, 94, 95). We largely followed the steps described in the tutorials available on the WGCNA software home page (https://horvath.genetics.ucla.edu/html/CoexpressionNetwork/Rpackages/WGCNA/Tutorials/). To filter out genes expressed at low levels from the analysis, we included only those genes whose normalized counts exceeded 20 in at least 40% of the samples. This resulted in a sample consisting of 1,472 GAS genes and 3,020 NHP genes. The filtered data set was log transformed using log2(x + 1). To identify outliers, we performed a hierarchical cluster analysis. This revealed one obvious outlier, which was removed from the data. The preprocessed data were split into a pathogen GAS data set and a host NHP data set. We applied WGCNA on the two data sets, using Pearson correlation and the signed hybrid option, to detect GAS- and NHP-specific clusters (or modules) of positively correlated genes. The soft thresholding powers were chosen according to the approximate scale-free topology criterion. The eigengene values of the modules were calculated, and modules were merged if the correlation between their eigengene values exceeded 0.8. COG enrichment analysis of the GAS modules was done in R using Fisher’s exact test and the Benjamini-Hochberg procedure. Pathogen-host interactions were examined by correlating the eigengene values of the GAS and NHP modules.
Mouse virulence experiments with GAS isogenic mutant strains.
Immunocompetent 5-week-old female CD1 mice (Envigo Laboratories) were used for necrotizing myositis virulence studies as described previously (45). Mice were randomly assigned to treatment groups and inoculated in the right hind limb to a uniform depth with 7.5 × 10⁶ CFU of isogenic mutant strain MGAS2221 ΔSpy0281 and wild-type parental strain MGAS2221 in 100 ml PBS. Stocks of each strain were prepared at known CFU levels and stored at –80°C. Inocula were prepared by diluting frozen stocks in PBS to the desired number of CFU. For survival experiments (n = 20 mice/strain), near-mortality was determined by observation using predefined criteria. For histology evaluation, lesions were excised, visually inspected, and photographed. Histopathology was scored by a pathologist blind to the strain treatment groups as described previously (27, 45). For the quantitative culture experiment (n = 35 mice/strain for the wild-type and MGAS2221 ΔSpy0281 strains), limbs were homogenized (Omni International) and CFU counts were determined by culturing serial dilutions. Identical methods were used to assess the virulence of all additional isogenic deletion-mutant strains. All mouse experiments were approved by the Institutional Animal Care and Use Committee of Houston Methodist Research Institute.
NHP virulence experiments with GAS isogenic mutant strains.
The NHP model of necrotizing myositis described above and elsewhere (27, 45, 55) was used. Each isogenic deletion-mutant strain was given to four animals. Lesion volume, CFU recovery, and histopathology analyses were performed as previously described (27, 45, 55). All NHP experiments were approved by the Institutional Animal Care and Use Committee of Houston Methodist Research Institute.
GAS bactericidal activity assay.
Bactericidal activity assays with human PMNs and GAS were performed in accordance with protocol 01-I-N055, approved by the Institutional Review Board for human subjects, National Institute of Allergy and Infectious Diseases. All volunteers gave written informed consent prior to participation in the study. Human neutrophils were isolated from the venous blood of healthy volunteers using a standard method (96). The wild-type MGAS2221 and isogenic MGAS2221 ΔSpy0281 deletion mutant strains were grown to early mid-exponential phase in THY medium with 5% CO2 at 37°C (optical density at 600 nm [OD600] = ∼0.5). A total volume of 600 μl containing 106 PMNs, 106 bacteria, 10% autologous serum, and HEPES-buffered RPMI 1640 medium was dispensed into a 1.5-ml Eppendorf tube. Assay mixtures were rotated gently at 37°C for 1 or 3 h, at which time saponin (0.1% final concentration) was added to each assay mixture and the tubes were placed on ice for 15 min. An aliquot of each tube was diluted and plated on THY agar plates for enumeration of CFU. Percent GAS survival was determined by comparison of CFU from assays performed with PMNs to CFU from assays performed without PMNs. Data were analyzed with repeated-measures 1-way analysis of variance (ANOVA) and Tukey’s posttest to correct for multiple comparisons (Prism 6 for Mac OS X, GraphPad Prism; GraphPad Software Inc.).
Statistical analysis.
Unless otherwise stated, error bars represent standard deviations (SD), and P values were calculated using the Fisher exact test, the Mann-Whitney test, the Kruskal-Wallis test, or the log rank test. Differential expression analysis was performed using DESeq2 1.16.1. Genes were considered differentially expressed if the change in the level of expression was greater than 1.5-fold and was associated with an adjusted P value (Bonferroni corrected) of <0.05. P values for pathways significantly associated with the up- and downregulated host genes were computed by the use of Ingenuity pathway analysis (IPA; version 01-14) with Fisher’s exact test. WGCNA was used with Pearson correlation and the signed hybrid option to detect GAS- and NHP-specific clusters (or modules) of positively correlated genes. The soft thresholding powers were chosen according to the approximate scale-free topology criterion. The eigengene values were calculated for the modules, and modules were merged if the correlation between their eigengene values exceeded 0.8. The enrichment analyses of the modules were done in R using Fisher’s exact test and the Benjamini-Hochberg procedure. For all animal experiments, statistical testing was performed using GraphPad Prism (version 8.1.2). Nonparametric statistical tests were used because the lesion volume and CFU data did not fit a normal distribution using the Anderson-Darling test, the D’Agostino-Pearson test, the Shapiro-Wilk test, or the Kolmogorov-Smirnov test. For mouse survival studies, results were graphed as Kaplan-Meier curves and data were analyzed using the log rank test, with P values of <0.05 considered to be significant. For the mouse CFU experiment, data were graphed as means ± standard errors of the means (SEM) and analyzed using the Mann-Whitney test, with P values of <0.05 considered to be significant. For the NHP virulence studies, lesion volume and CFU data were graphed as means ± SEM and analyzed using the Kruskal-Wallis test, with P values of <0.05 considered to be significant.
Data availability.
A slightly updated complete genome sequence of emm1 reference strain MGAS2221 (GenBank accession number CP043530) has been deposited in the NCBI GenBank database under the same accession number. Transcriptome data have been deposited in the Gene Expression Omnibus under accession number GSE144100.
ACKNOWLEDGMENTS
We thank the veterinary support staff for assistance; David Ginsburg, David M. Morens, Timothy Palzkill, and Kathryn Stockbauer for critical comments to improve the manuscript; and Stephen Beres, S. Wesley Long, and Hoang A. T. Nguyen for work on the genome of strain MGAS2221.
This study was supported in part by the Fondren Foundation, Houston Methodist Hospital and Research Institute, and National Institutes of Health grants AI139369-01 and AI146771-01 (to J.M.M.) and a European Research Council grant number 742158 (to J.C.). This research was also supported in part by the Intramural Research Program of the National Institute of Allergy and Infectious Diseases, National Institutes of Health (to F.R.D.).
J.M.M. conceptualized the study. P.K., J.M.E., and J.M.M. designed the study. P.K., J.M.E., R.J.O., L.Z., S.L.K., L.P., P.Y., C.C.C., M.O.S., J.P., J.C., and A.R.P. produced the data. J.M.M., P.K., J.M.E., R.J.O., L.Z., J.P., J.C., and F.R.D. analyzed the data. All of us contributed to writing the manuscript. All of us reviewed and approved the final draft.
We declare that we have no competing interests, either financial or nonfinancial.
Footnotes
This article is a direct contribution from James M Musser, a Fellow of the American Academy of Microbiology, who arranged for and secured reviews by Anna Norrby-Teglund, Karolinska Institutet, and Guido Grandi, University of Trento.
Citation Kachroo P, Eraso JM, Olsen RJ, Zhu L, Kubiak SL, Pruitt L, Yerramilli P, Cantu CC, Ojeda Saavedra M, Pensar J, Corander J, Jenkins L, Kao L, Granillo A, Porter AR, DeLeo FR, Musser JM. 2020. New pathogenesis mechanisms and translational leads identified by multidimensional analysis of necrotizing myositis in primates. mBio 11:e03363-19. https://doi.org/10.1128/mBio.03363-19.
REFERENCES
- 1.Carapetis JR, Steer AC, Mulholland EK, Weber M. 2005. The global burden of group A streptococcal diseases. Lancet Infect Dis 5:685–694. doi: 10.1016/S1473-3099(05)70267-X. [DOI] [PubMed] [Google Scholar]
- 2.Walker MJ, Barnett TC, McArthur JD, Cole JN, Gillen CM, Henningham A, Sriprakash KS, Sanderson-Smith ML, Nizet V. 2014. Disease manifestations and pathogenic mechanisms of group A Streptococcus. Clin Microbiol Rev 27:264–301. doi: 10.1128/CMR.00101-13. [DOI] [PMC free article] [PubMed] [Google Scholar]
- 3.Fischetti VA. 1989. Streptococcal M protein: molecular design and biological behavior. Clin Microbiol Rev 2:285–314. doi: 10.1128/cmr.2.3.285. [DOI] [PMC free article] [PubMed] [Google Scholar]
- 4.Barnett TC, Bowen AC, Carapetis JR. 15 August 2018, posting date The fall and rise of group A Streptococcus diseases. Epidemiol Infect doi: 10.1017/S0950268818002285. [DOI] [PMC free article] [PubMed] [Google Scholar]
- 5.Flores AR, Chase McNeil J, Shah B, Van Beneden C, Shelburne SA III.. 1 July 2019, posting date Capsule-negative emm types are an increasing cause of pediatric group A streptococcal infections at a large pediatric hospital in Texas. J Pediatric Infect Dis Soc doi: 10.1093/jpids/piy053. [DOI] [PMC free article] [PubMed] [Google Scholar]
- 6.Gherardi G, Vitali LA, Creti R. 9 March 2018, posting date Prevalent emm types among invasive GAS in Europe and North America since year 2000. Front Public Health doi: 10.3389/fpubh.2018.00059. [DOI] [PMC free article] [PubMed] [Google Scholar]
- 7.Naseer U, Steinbakk M, Blystad H, Caugant DA. 2016. Epidemiology of invasive group A streptococcal infections in Norway 2010–2014: a retrospective cohort study. Eur J Clin Microbiol Infect Dis 35:1639–1648. doi: 10.1007/s10096-016-2704-y. [DOI] [PubMed] [Google Scholar]
- 8.Nelson GE, Pondo T, Toews KA, Farley MM, Lindegren ML, Lynfield R, Aragon D, Zansky SM, Watt JP, Cieslak PR, Angeles K, Harrison LH, Petit S, Beall B, Van Beneden CA. 2016. Epidemiology of invasive group A streptococcal infections in the United States, 2005–2012. Clin Infect Dis 63:478–486. doi: 10.1093/cid/ciw248. [DOI] [PMC free article] [PubMed] [Google Scholar]
- 9.Plainvert C, Doloy A, Loubinoux J, Lepoutre A, Collobert G, Touak G, Trieu-Cuot P, Bouvet A, Poyart C, CNR-Strep network. 2012. Invasive group A streptococcal infections in adults, France (2006–2010). Clin Microbiol Infect 18:702–710. doi: 10.1111/j.1469-0691.2011.03624.x. [DOI] [PubMed] [Google Scholar]
- 10.Shea PR, Ewbank AL, Gonzalez-Lugo JH, Martagon-Rosado AJ, Martinez-Gutierrez JC, Rehman HA, Serrano-Gonzalez M, Fittipaldi N, Beres SB, Flores AR, Low DE, Willey BM, Musser JM. 2011. Group A streptococcus emm gene types in pharyngeal isolates, Ontario, Canada, 2002–2010. Emerg Infect Dis 17:2010–2017. doi: 10.3201/eid1711.110159. [DOI] [PMC free article] [PubMed] [Google Scholar]
- 11.Smit PW, Lindholm L, Lyytikainen O, Jalava J, Patari-Sampo A, Vuopio J. 2015. Epidemiology and emm types of invasive group A streptococcal infections in Finland, 2008–2013. Eur J Clin Microbiol Infect Dis 34:2131–2136. doi: 10.1007/s10096-015-2462-2. [DOI] [PubMed] [Google Scholar]
- 12.Dmitriev AV, Chaussee MS. 2010. The Streptococcus pyogenes proteome: maps, virulence factors and vaccine candidates. Future Microbiol 5:1539–1551. doi: 10.2217/fmb.10.116. [DOI] [PMC free article] [PubMed] [Google Scholar]
- 13.Kinkel TL, McIver KS. 2008. CcpA-mediated repression of streptolysin S expression and virulence in the group A Streptococcus. Infect Immun 76:3451–3463. doi: 10.1128/IAI.00343-08. [DOI] [PMC free article] [PubMed] [Google Scholar]
- 14.Kizy AE, Neely MN. 2009. First Streptococcus pyogenes signature-tagged mutagenesis screen identifies novel virulence determinants. Infect Immun 77:1854–1865. doi: 10.1128/IAI.01306-08. [DOI] [PMC free article] [PubMed] [Google Scholar]
- 15.Kreikemeyer B, McIver KS, Podbielski A. 2003. Virulence factor regulation and regulatory networks in Streptococcus pyogenes and their impact on pathogen-host interactions. Trends Microbiol 11:224–232. doi: 10.1016/s0966-842x(03)00098-2. [DOI] [PubMed] [Google Scholar]
- 16.Lei B, Liu M, Chesney GL, Musser JM. 2004. Identification of new candidate vaccine antigens made by Streptococcus pyogenes: purification and characterization of 16 putative extracellular lipoproteins. J Infect Dis 189:79–89. doi: 10.1086/380491. [DOI] [PubMed] [Google Scholar]
- 17.Graham MR, Virtaneva K, Porcella SF, Gardner DJ, Long RD, Welty DM, Barry WT, Johnson CA, Parkins LD, Wright FA, Musser JM. 2006. Analysis of the transcriptome of group A Streptococcus in mouse soft tissue infection. Am J Pathol 169:927–942. doi: 10.2353/ajpath.2006.060112. [DOI] [PMC free article] [PubMed] [Google Scholar]
- 18.Shea PR, Beres SB, Flores AR, Ewbank AL, Gonzalez-Lugo JH, Martagon-Rosado AJ, Martinez-Gutierrez JC, Rehman HA, Serrano-Gonzalez M, Fittipaldi N, Ayers SD, Webb P, Willey BM, Low DE, Musser JM. 2011. Distinct signatures of diversifying selection revealed by genome analysis of respiratory tract and invasive bacterial populations. Proc Natl Acad Sci U S A 108:5039–5044. doi: 10.1073/pnas.1016282108. [DOI] [PMC free article] [PubMed] [Google Scholar]
- 19.Sumby P, Whitney AR, Graviss EA, DeLeo FR, Musser JM. 2006. Genome-wide analysis of group A streptococci reveals a mutation that modulates global phenotype and disease specificity. PLoS Pathog 2:e5. doi: 10.1371/journal.ppat.0020005. [DOI] [PMC free article] [PubMed] [Google Scholar]
- 20.Virtaneva K, Porcella SF, Graham MR, Ireland RM, Johnson CA, Ricklefs SM, Babar I, Parkins LD, Romero RA, Corn GJ, Gardner DJ, Bailey JR, Parnell MJ, Musser JM. 2005. Longitudinal analysis of the group A Streptococcus transcriptome in experimental pharyngitis in cynomolgus macaques. Proc Natl Acad Sci U S A 102:9014–9019. doi: 10.1073/pnas.0503671102. [DOI] [PMC free article] [PubMed] [Google Scholar]
- 21.Wang Z, Gerstein M, Snyder M. 2009. RNA-Seq: a revolutionary tool for transcriptomics. Nat Rev Genet 10:57–63. doi: 10.1038/nrg2484. [DOI] [PMC free article] [PubMed] [Google Scholar]
- 22.Bao YJ, Liang Z, Mayfield JA, Lee SW, Ploplis VA, Castellino FJ. 27 July 2015, posting date CovRS regulated transcriptome analysis of a hypervirulent M23 strain of group A Streptococcus pyogenes provides new insights on virulence determinants. J Bacteriol doi: 10.1128/JB.00511-15. [DOI] [PMC free article] [PubMed] [Google Scholar]
- 23.Horstmann N, Tran CN, Brumlow C, DebRoy S, Yao H, Nogueras Gonzalez G, Makthal N, Kumaraswami M, Shelburne SA. 2018. Phosphatase activity of the control of virulence sensor kinase CovS is critical for the pathogenesis of group A Streptococcus. PLoS Pathog 14:e1007354. doi: 10.1371/journal.ppat.1007354. [DOI] [PMC free article] [PubMed] [Google Scholar]
- 24.Jain I, Miller EW, Danger JL, Pflughoeft KJ, Sumby P. 18 October 2017, posting date RocA is an accessory protein to the virulence-regulating CovRS two-component system in group A Streptococcus. Infect Immun doi: 10.1128/IAI.00274-17. [DOI] [PMC free article] [PubMed] [Google Scholar]
- 25.Kachroo P, Eraso JM, Beres SB, Olsen RJ, Zhu L, Nasser W, Bernard PE, Cantu CC, Saavedra MO, Arredondo MJ, Strope B, Do H, Kumaraswami M, Vuopio J, Grondahl-Yli-Hannuksela K, Kristinsson KG, Gottfredsson M, Pesonen M, Pensar J, Davenport ER, Clark AG, Corander J, Caugant DA, Gaini S, Magnussen MD, Kubiak SL, Nguyen HAT, Long SW, Porter AR, DeLeo FR, Musser JM. 2019. Integrated analysis of population genomics, transcriptomics and virulence provides novel insights into Streptococcus pyogenes pathogenesis. Nat Genet 51:548–559. doi: 10.1038/s41588-018-0343-1. [DOI] [PMC free article] [PubMed] [Google Scholar]
- 26.Le Rhun A, Beer YY, Reimegard J, Chylinski K, Charpentier E. 2016. RNA sequencing uncovers antisense RNAs and novel small RNAs in Streptococcus pyogenes. RNA Biol 13:177–195. doi: 10.1080/15476286.2015.1110674. [DOI] [PMC free article] [PubMed] [Google Scholar]
- 27.Nasser W, Beres SB, Olsen RJ, Dean MA, Rice KA, Long SW, Kristinsson KG, Gottfredsson M, Vuopio J, Raisanen K, Caugant DA, Steinbakk M, Low DE, McGeer A, Darenberg J, Henriques-Normark B, Van Beneden CA, Hoffmann S, Musser JM. 2014. Evolutionary pathway to increased virulence and epidemic group A Streptococcus disease derived from 3,615 genome sequences. Proc Natl Acad Sci U S A 111:E1768–1776. doi: 10.1073/pnas.1403138111. [DOI] [PMC free article] [PubMed] [Google Scholar]
- 28.Valdes KM, Sundar GS, Belew AT, Islam E, El-Sayed NM, Le Breton Y, McIver KS. 21 March 2018, posting date Glucose levels alter the Mga virulence regulon in the group A Streptococcus. Sci Rep doi: 10.1038/s41598-018-23366-7. [DOI] [PMC free article] [PubMed] [Google Scholar]
- 29.Marsh JW, Humphrys MS, Myers G. 21 September 2017, posting date A laboratory methodology for dual RNA-sequencing of bacteria and their host cells in vitro. Front Microbiol doi: 10.3389/fmicb.2017.01830. [DOI] [PMC free article] [PubMed] [Google Scholar]
- 30.Westermann AJ, Gorski SA, Vogel J. 2012. Dual RNA-seq of pathogen and host. Nat Rev Microbiol 10:618–630. doi: 10.1038/nrmicro2852. [DOI] [PubMed] [Google Scholar]
- 31.Westermann AJ, Barquist L, Vogel J. 2017. Resolving host-pathogen interactions by dual RNA-seq. PLoS Pathog 13:e1006033. doi: 10.1371/journal.ppat.1006033. [DOI] [PMC free article] [PubMed] [Google Scholar]
- 32.Wolf T, Kammer P, Brunke S, Linde J. 2018. Two’s company: studying interspecies relationships with dual RNA-seq. Curr Opin Microbiol 42:7–12. doi: 10.1016/j.mib.2017.09.001. [DOI] [PubMed] [Google Scholar]
- 33.Aprianto R, Slager J, Holsappel S, Veening JW. 27 September 2016, posting date Time-resolved dual RNA-seq reveals extensive rewiring of lung epithelial and pneumococcal transcriptomes during early infection. Genome Biol doi: 10.1186/s13059-016-1054-5. [DOI] [PMC free article] [PubMed] [Google Scholar]
- 34.Baddal B, Muzzi A, Censini S, Calogero RA, Torricelli G, Guidotti S, Taddei AR, Covacci A, Pizza M, Rappuoli R, Soriani M, Pezzicoli A. 2015. Dual RNA-seq of nontypeable Haemophilus influenzae and host cell transcriptomes reveals novel insights into host-pathogen cross talk. mBio 6:e01765-15. doi: 10.1128/mBio.01765-15. [DOI] [PMC free article] [PubMed] [Google Scholar]
- 35.Humphrys MS, Creasy T, Sun Y, Shetty AC, Chibucos MC, Drabek EF, Fraser CM, Farooq U, Sengamalay N, Ott S, Shou H, Bavoil PM, Mahurkar A, Myers GS. 2013. Simultaneous transcriptional profiling of bacteria and their host cells. PLoS One 8:e80597. doi: 10.1371/journal.pone.0080597. [DOI] [PMC free article] [PubMed] [Google Scholar]
- 36.Mavromatis CH, Bokil NJ, Totsika M, Kakkanat A, Schaale K, Cannistraci CV, Ryu T, Beatson SA, Ulett GC, Schembri MA, Sweet MJ, Ravasi T. 2015. The co-transcriptome of uropathogenic Escherichia coli-infected mouse macrophages reveals new insights into host-pathogen interactions. Cell Microbiol 17:730–746. doi: 10.1111/cmi.12397. [DOI] [PMC free article] [PubMed] [Google Scholar]
- 37.Rienksma RA, Suarez-Diez M, Mollenkopf HJ, Dolganov GM, Dorhoi A, Schoolnik GK, Martins Dos Santos VA, Kaufmann SH, Schaap PJ, Gengenbacher M. 2015. Comprehensive insights into transcriptional adaptation of intracellular mycobacteria by microbe-enriched dual RNA sequencing. BMC Genomics 16:34–15. doi: 10.1186/s12864-014-1197-2. [DOI] [PMC free article] [PubMed] [Google Scholar]
- 38.Westermann AJ, Forstner KU, Amman F, Barquist L, Chao Y, Schulte LN, Muller L, Reinhardt R, Stadler PF, Vogel J. 2016. Dual RNA-seq unveils noncoding RNA functions in host-pathogen interactions. Nature 529:496–501. doi: 10.1038/nature16547. [DOI] [PubMed] [Google Scholar]
- 39.Zimmermann M, Kogadeeva M, Gengenbacher M, McEwen G, Mollenkopf HJ, Zamboni N, Kaufmann SHE, Sauer U. 2017. Integration of metabolomics and transcriptomics reveals a complex diet of Mycobacterium tuberculosis during early macrophage infection. mSystems 2:e00057-17. doi: 10.1128/mSystems.00057-17. [DOI] [PMC free article] [PubMed] [Google Scholar]
- 40.LaMonte GM, Orjuela-Sanchez P, Calla J, Wang LT, Li S, Swann J, Cowell AN, Zou BY, Abdel-Haleem Mohamed AM, Villa Galarce ZH, Moreno M, Tong Rios C, Vinetz JM, Lewis N, Winzeler EA. 30 January 2019, posting date Dual RNA-seq identifies human mucosal immunity protein Mucin-13 as a hallmark of Plasmodium exoerythrocytic infection. Nat Commun doi: 10.1038/s41467-019-08349-0. [DOI] [PMC free article] [PubMed] [Google Scholar]
- 41.Damron FH, Oglesby-Sherrouse AG, Wilks A, Barbier M. 2016. Dual-seq transcriptomics reveals the battle for iron during Pseudomonas aeruginosa acute murine pneumonia. Sci Rep 6:39172–39112. doi: 10.1038/srep39172. [DOI] [PMC free article] [PubMed] [Google Scholar]
- 42.Thanert R, Goldmann O, Beineke A, Medina E. 2017. Host-inherent variability influences the transcriptional response of Staphylococcus aureus during in vivo infection. Nat Commun 8:14268–14213. doi: 10.1038/ncomms14268. [DOI] [PMC free article] [PubMed] [Google Scholar]
- 43.Low LY, Harrison PF, Gould J, Powell DR, Choo JM, Forster SC, Chapman R, Gearing LJ, Cheung JK, Hertzog P, Rood JI. 2018. Concurrent host-pathogen transcriptional responses in a Clostridium perfringens murine myonecrosis infection. mBio 9:e00473-18. doi: 10.1128/mBio.00473-18. [DOI] [PMC free article] [PubMed] [Google Scholar]
- 44.Avican K, Fahlgren A, Huss M, Heroven AK, Beckstette M, Dersch P, Fallman M. 2015. Reprogramming of Yersinia from virulent to persistent mode revealed by complex in vivo RNA-seq analysis. PLoS Pathog 11:e1004600. doi: 10.1371/journal.ppat.1004600. [DOI] [PMC free article] [PubMed] [Google Scholar]
- 45.Olsen RJ, Sitkiewicz I, Ayeras AA, Gonulal VE, Cantu C, Beres SB, Green NM, Lei B, Humbird T, Greaver J, Chang E, Ragasa WP, Montgomery CA, Cartwright J Jr, McGeer A, Low DE, Whitney AR, Cagle PT, Blasdel TL, DeLeo FR, Musser JM. 2010. Decreased necrotizing fasciitis capacity caused by a single nucleotide mutation that alters a multiple gene virulence axis. Proc Natl Acad Sci U S A 107:888–893. doi: 10.1073/pnas.0911811107. [DOI] [PMC free article] [PubMed] [Google Scholar]
- 46.Zhu L, Olsen RJ, Beres SB, Eraso JM, Saavedra MO, Kubiak SL, Cantu CC, Jenkins L, Charbonneau ARL, Waller AS, Musser JM. 2019. Gene fitness landscape of group A Streptococcus during necrotizing myositis. J Clin Invest 129:887–901. doi: 10.1172/JCI124994. [DOI] [PMC free article] [PubMed] [Google Scholar]
- 47.Cornforth DM, Dees JL, Ibberson CB, Huse HK, Mathiesen IH, Kirketerp-Moller K, Wolcott RD, Rumbaugh KP, Bjarnsholt T, Whiteley M. 2018. Pseudomonas aeruginosa transcriptome during human infection. Proc Natl Acad Sci U S A 115:E5125–E5134. doi: 10.1073/pnas.1717525115. [DOI] [PMC free article] [PubMed] [Google Scholar]
- 48.Huang L, Zhao L, Liu W, Xu X, Su Y, Qin Y, Yan Q. 3 May 2019, posting date Dual RNA-Seq unveils Pseudomonas plecoglossicida htpG gene functions during host-pathogen interactions with Epinephelus coioides. Front Immunol doi: 10.3389/fimmu.2019.00984. [DOI] [PMC free article] [PubMed] [Google Scholar]
- 49.Kumar SS, Tandberg JI, Penesyan A, Elbourne LDH, Suarez-Bosche N, Don E, Skadberg E, Fenaroli F, Cole N, Winther-Larsen HC, Paulsen IT. 22 November 2018, posting date Dual transcriptomics of host-pathogen interaction of cystic fibrosis isolate Pseudomonas aeruginosa PASS1 with zebrafish. Front Cell Infect Microbiol doi: 10.3389/fcimb.2018.00406. [DOI] [PMC free article] [PubMed] [Google Scholar]
- 50.Lee HJ, Georgiadou A, Walther M, Nwakanma D, Stewart LB, Levin M, Otto TD, Conway DJ, Coin LJ, Cunnington AJ. 27 June 2018, posting date Integrated pathogen load and dual transcriptome analysis of systemic host-pathogen interactions in severe malaria. Sci Transl Med doi: 10.1126/scitranslmed.aar3619. [DOI] [PMC free article] [PubMed] [Google Scholar]
- 51.Liao ZX, Ni Z, Wei XL, Chen L, Li JY, Yu YH, Jiang W, Jiang BL, He YQ, Huang S. 2019. Dual RNA-seq of Xanthomonas oryzae pv. oryzicola infecting rice reveals novel insights into bacterial-plant interaction. PLoS One 14:e0215039. doi: 10.1371/journal.pone.0215039. [DOI] [PMC free article] [PubMed] [Google Scholar]
- 52.Montoya DJ, Andrade P, Silva BJA, Teles RMB, Ma F, Bryson B, Sadanand S, Noel T, Lu J, Sarno E, Arnvig KB, Young D, Lahiri R, Williams DL, Fortune S, Bloom BR, Pellegrini M, Modlin RL. 2019. Dual RNA-seq of human leprosy lesions identifies bacterial determinants linked to host immune response. Cell Rep 26:3574–3585.e3573. doi: 10.1016/j.celrep.2019.02.109. [DOI] [PMC free article] [PubMed] [Google Scholar]
- 53.Nuss AM, Beckstette M, Pimenova M, Schmuhl C, Opitz W, Pisano F, Heroven AK, Dersch P. 2017. Tissue dual RNA-seq allows fast discovery of infection-specific functions and riboregulators shaping host-pathogen transcriptomes. Proc Natl Acad Sci U S A 114:E791–E800. doi: 10.1073/pnas.1613405114. [DOI] [PMC free article] [PubMed] [Google Scholar]
- 54.Thänert R, INFECT study group, Itzek A, Hoßmann J, Hamisch D, Madsen MB, Hyldegaard O, Skrede S, Bruun T, Norrby-Teglund A, Medina E, Pieper DH. 2019. Molecular profiling of tissue biopsies reveals unique signatures associated with streptococcal necrotizing soft tissue infections. Nat Commun 10:3846. doi: 10.1038/s41467-019-11722-8. [DOI] [PMC free article] [PubMed] [Google Scholar]
- 55.Eraso JM, Olsen RJ, Beres SB, Kachroo P, Porter AR, Nasser W, Bernard PE, DeLeo FR, Musser JM. 2016. Genomic landscape of intrahost variation in group A Streptococcus: repeated and abundant mutational inactivation of the fabT gene encoding a regulator of fatty acid synthesis. Infect Immun 84:3268–3281. doi: 10.1128/IAI.00608-16. [DOI] [PMC free article] [PubMed] [Google Scholar]
- 56.Bates CS, Montanez GE, Woods CR, Vincent RM, Eichenbaum Z. 2003. Identification and characterization of a Streptococcus pyogenes operon involved in binding of hemoproteins and acquisition of iron. Infect Immun 71:1042–1055. doi: 10.1128/iai.71.3.1042-1055.2003. [DOI] [PMC free article] [PubMed] [Google Scholar]
- 57.Cook LCC, Chatterjee N, Li Y, Andrade J, Federle MJ, Eichenbaum Z. 2019. Transcriptomic analysis of Streptococcus pyogenes colonizing the vaginal mucosa identifies hupY, an MtsR-regulated adhesin involved in heme utilization. mBio 10:e00848-19. doi: 10.1128/mBio.00848-19. [DOI] [PMC free article] [PubMed] [Google Scholar]
- 58.Ong CY, Berking O, Walker MJ, McEwan AG. 2018. New insights into the role of zinc acquisition and zinc tolerance in group A streptococcal infection. Infect Immun 86:e00048-18. doi: 10.1128/IAI.00048-18. [DOI] [PMC free article] [PubMed] [Google Scholar]
- 59.Sanson M, Makthal N, Flores AR, Olsen RJ, Musser JM, Kumaraswami M. 2015. Adhesin competence repressor (AdcR) from Streptococcus pyogenes controls adaptive responses to zinc limitation and contributes to virulence. Nucleic Acids Res 43:418–432. doi: 10.1093/nar/gku1304. [DOI] [PMC free article] [PubMed] [Google Scholar]
- 60.Janulczyk R, Ricci S, Bjorck L. 2003. MtsABC is important for manganese and iron transport, oxidative stress resistance, and virulence of Streptococcus pyogenes. Infect Immun 71:2656–2664. doi: 10.1128/iai.71.5.2656-2664.2003. [DOI] [PMC free article] [PubMed] [Google Scholar]
- 61.Haneklaus M, Gerlic M, O'Neill LAJ, Masters SL. 2013. miR-223: infection, inflammation and cancer. J Intern Med 274:215–226. doi: 10.1111/joim.12099. [DOI] [PMC free article] [PubMed] [Google Scholar]
- 62.Song J, Ouyang Y, Che J, Li X, Zhao Y, Yang K, Zhao X, Chen Y, Fan C, Yuan W. 2017. Potential value of miR-221/222 as diagnostic, prognostic, and therapeutic biomarkers for diseases. Front Immunol 8:56. doi: 10.3389/fimmu.2017.00056. [DOI] [PMC free article] [PubMed] [Google Scholar]
- 63.Wu X, Yang J, Yu L, Long D. 2018. Plasma miRNA-223 correlates with risk, inflammatory markers as well as prognosis in sepsis patients. Medicine (Baltimore, MD) 97:e11352. doi: 10.1097/MD.0000000000011352. [DOI] [PMC free article] [PubMed] [Google Scholar]
- 64.Guess MG, Barthel KK, Harrison BC, Leinwand LA. 2015. miR-30 family microRNAs regulate myogenic differentiation and provide negative feedback on the microRNA pathway. PLoS One 10:e0118229. doi: 10.1371/journal.pone.0118229. [DOI] [PMC free article] [PubMed] [Google Scholar]
- 65.Townley-Tilson WH, Callis TE, Wang D. 2010. MicroRNAs 1, 133, and 206: critical factors of skeletal and cardiac muscle development, function, and disease. Int J Biochem Cell Biol 42:1252–1255. doi: 10.1016/j.biocel.2009.03.002. [DOI] [PMC free article] [PubMed] [Google Scholar]
- 66.Langfelder P, Horvath S. 2008. WGCNA: an R package for weighted correlation network analysis. BMC Bioinformatics 9:559. doi: 10.1186/1471-2105-9-559. [DOI] [PMC free article] [PubMed] [Google Scholar]
- 67.Jensen PA, Zhu Z, van Opijnen T. 2017. Antibiotics disrupt coordination between transcriptional and phenotypic stress responses in pathogenic bacteria. Cell Rep 20:1705–1716. doi: 10.1016/j.celrep.2017.07.062. [DOI] [PMC free article] [PubMed] [Google Scholar]
- 68.Turner KH, Everett J, Trivedi U, Rumbaugh KP, Whiteley M. 2014. Requirements for Pseudomonas aeruginosa acute burn and chronic surgical wound infection. PLoS Genet 10:e1004518. doi: 10.1371/journal.pgen.1004518. [DOI] [PMC free article] [PubMed] [Google Scholar]
- 69.Zhang X, de Maat V, Guzman Prieto AM, Prajsnar TK, Bayjanov JR, de Been M, Rogers MRC, Bonten MJM, Mesnage S, Willems RJL, van Schaik W. 21 November 2017, posting date RNA-seq and Tn-seq reveal fitness determinants of vancomycin-resistant Enterococcus faecium during growth in human serum. BMC Genomics doi: 10.1186/s12864-017-4299-9. [DOI] [PMC free article] [PubMed] [Google Scholar]
- 70.Graham MR, Smoot LM, Migliaccio CA, Virtaneva K, Sturdevant DE, Porcella SF, Federle MJ, Adams GJ, Scott JR, Musser JM. 2002. Virulence control in group A Streptococcus by a two-component gene regulatory system: global expression profiling and in vivo infection modeling. Proc Natl Acad Sci U S A 99:13855–13860. doi: 10.1073/pnas.202353699. [DOI] [PMC free article] [PubMed] [Google Scholar]
- 71.Federle MJ, McIver KS, Scott JR. 1999. A response regulator that represses transcription of several virulence operons in the group A Streptococcus. J Bacteriol 181:3649–3657. doi: 10.1128/JB.181.12.3649-3657.1999. [DOI] [PMC free article] [PubMed] [Google Scholar]
- 72.Hertzen E, Johansson L, Kansal R, Hecht A, Dahesh S, Janos M, Nizet V, Kotb M, Norrby-Teglund A. 2012. Intracellular Streptococcus pyogenes in human macrophages display an altered gene expression profile. PLoS One 7:e35218. doi: 10.1371/journal.pone.0035218. [DOI] [PMC free article] [PubMed] [Google Scholar]
- 73.Voyich JM, Sturdevant DE, Braughton KR, Kobayashi SD, Lei B, Virtaneva K, Dorward DW, Musser JM, DeLeo FR. 2003. Genome-wide protective response used by group A Streptococcus to evade destruction by human polymorphonuclear leukocytes. Proc Natl Acad Sci U S A 100:1996–2001. doi: 10.1073/pnas.0337370100. [DOI] [PMC free article] [PubMed] [Google Scholar]
- 74.Voyich JM, Braughton KR, Sturdevant DE, Vuong C, Kobayashi SD, Porcella SF, Otto M, Musser JM, DeLeo FR. 2004. Engagement of the pathogen survival response used by group A Streptococcus to avert destruction by innate host defense. J Immunol 173:1194–1201. doi: 10.4049/jimmunol.173.2.1194. [DOI] [PubMed] [Google Scholar]
- 75.Henningham A, Dohrmann S, Nizet V, Cole JN. 2015. Mechanisms of group A Streptococcus resistance to reactive oxygen species. FEMS Microbiol Rev 39:488–508. doi: 10.1093/femsre/fuu009. [DOI] [PMC free article] [PubMed] [Google Scholar]
- 76.Reid SD, Montgomery AG, Voyich JM, DeLeo FR, Lei B, Ireland RM, Green NM, Liu M, Lukomski S, Musser JM. 2003. Characterization of an extracellular virulence factor made by group A Streptococcus with homology to the Listeria monocytogenes internalin family of proteins. Infect Immun 71:7043–7052. doi: 10.1128/iai.71.12.7043-7052.2003. [DOI] [PMC free article] [PubMed] [Google Scholar]
- 77.Mengaud J, Ohayon H, Gounon P, Mege RM, Cossart P. 1996. E-cadherin is the receptor for internalin, a surface protein required for entry of L. monocytogenes into epithelial cells. Cell 84:923–932. doi: 10.1016/S0092-8674(00)81070-3. [DOI] [PubMed] [Google Scholar]
- 78.Phelps CC, Vadia S, Arnett E, Tan Y, Zhang X, Pathak-Sharma S, Gavrilin MA, Seveau S. 21 September 2018, posting date Relative roles of listeriolysin O, InlA, and InlB in Listeria monocytogenes uptake by host cells. Infect Immun doi: 10.1128/IAI.00555-18. [DOI] [PMC free article] [PubMed] [Google Scholar]
- 79.McIver KS, Subbarao S, Kellner EM, Heath AS, Scott JR. 1996. Identification of isp, a locus encoding an immunogenic secreted protein conserved among group A streptococci. Infect Immun 64:2548–2555. doi: 10.1128/IAI.64.7.2548-2555.1996. [DOI] [PMC free article] [PubMed] [Google Scholar]
- 80.Tatsuno I, Isaka M, Okada R, Zhang Y, Hasegawa T. 2014. Relevance of the two-component sensor protein CiaH to acid and oxidative stress responses in Streptococcus pyogenes. BMC Res Notes 7:189. doi: 10.1186/1756-0500-7-189. [DOI] [PMC free article] [PubMed] [Google Scholar]
- 81.Engleberg NC, Heath A, Miller A, Rivera C, DiRita VJ. 2001. Spontaneous mutations in the CsrRS two-component regulatory system of Streptococcus pyogenes result in enhanced virulence in a murine model of skin and soft tissue infection. J Infect Dis 183:1043–1054. doi: 10.1086/319291. [DOI] [PubMed] [Google Scholar]
- 82.Shelburne SA, Olsen RJ, Suber B, Sahasrabhojane P, Sumby P, Brennan RG, Musser JM. 2010. A combination of independent transcriptional regulators shapes bacterial virulence gene expression during infection. PLoS Pathog 6:e1000817. doi: 10.1371/journal.ppat.1000817. [DOI] [PMC free article] [PubMed] [Google Scholar]
- 83.Loughman JA, Caparon M. 2006. Regulation of SpeB in Streptococcus pyogenes by pH and NaCl: a model for in vivo gene expression. J Bacteriol 188:399–408. doi: 10.1128/jb.188.2.399-408.2006. [DOI] [PMC free article] [PubMed] [Google Scholar]
- 84.Paluscio E, Caparon MG. 2015. Streptococcus pyogenes malate degradation pathway links pH regulation and virulence. Infect Immun 83:1162–1171. doi: 10.1128/IAI.02814-14. [DOI] [PMC free article] [PubMed] [Google Scholar]
- 85.Hirose Y, Yamaguchi M, Okuzaki D, Motooka D, Hamamoto H, Hanada T, Sumitomo T, Nakata M, Kawabata S. 16 October 2019, posting date Streptococcus pyogenes transcriptome changes in the inflammatory environment of necrotizing fasciitis. Appl Environ Microbiol doi: 10.1128/AEM.01428-19. [DOI] [PMC free article] [PubMed] [Google Scholar]
- 86.Saleh M, Bartual SG, Abdullah MR, Jensch I, Asmat TM, Petruschka L, Pribyl T, Gellert M, Lillig CH, Antelmann H, Hermoso JA, Hammerschmidt S. 2013. Molecular architecture of Streptococcus pneumoniae surface thioredoxin-fold lipoproteins crucial for extracellular oxidative stress resistance and maintenance of virulence. EMBO Mol Med 5:1852–1870. doi: 10.1002/emmm.201202435. [DOI] [PMC free article] [PubMed] [Google Scholar]
- 87.Sbarra AJ, Karnovsky ML. 1959. The biochemical basis of phagocytosis. I. Metabolic changes during the ingestion of particles by polymorphonuclear leukocytes. J Biol Chem 234:1355–1362. [PubMed] [Google Scholar]
- 88.Iyer GYN, Islam MF, Quastel JH. 1961. Biochemical aspects of phagocytosis. Nature 192:535–541. doi: 10.1038/192535a0. [DOI] [Google Scholar]
- 89.Rossi F, Zatti M. 1964. Biochemical aspects of phagocytosis in polymorphonuclear leucocytes. NADH and NADPH oxidation by the granules of resting and phagocytizing cells. Experientia 20:21–23. doi: 10.1007/bf02146019. [DOI] [PubMed] [Google Scholar]
- 90.Cho SH, Collet JF. 2013. Many roles of the bacterial envelope reducing pathways. Antioxid Redox Signal 18:1690–1698. doi: 10.1089/ars.2012.4962. [DOI] [PMC free article] [PubMed] [Google Scholar]
- 91.Edwards RJ, Pyzio M, Gierula M, Turner CE, Abdul-Salam VB, Sriskandan S. 13 April 2018, posting date Proteomic analysis at the sites of clinical infection with invasive Streptococcus pyogenes. Sci Rep doi: 10.1038/s41598-018-24216-2. [DOI] [PMC free article] [PubMed] [Google Scholar]
- 92.Powell JE, Leonard SP, Kwong WK, Engel P, Moran NA. 2016. Genome-wide screen identifies host colonization determinants in a bacterial gut symbiont. Proc Natl Acad Sci U S A 113:13887–13892. doi: 10.1073/pnas.1610856113. [DOI] [PMC free article] [PubMed] [Google Scholar]
- 93.Carroll RK, Shelburne SA III, Olsen RJ, Suber B, Sahasrabhojane P, Kumaraswami M, Beres SB, Shea PR, Flores AR, Musser JM. 2011. Naturally occurring single amino acid replacements in a regulatory protein alter streptococcal gene expression and virulence in mice. J Clin Invest 121:1956–1968. doi: 10.1172/JCI45169. [DOI] [PMC free article] [PubMed] [Google Scholar]
- 94.Team RC. 2016. R: a language and environment for statistical computing, version 3.3.1. R Foundation for Statistical Computing, Vienna, Austria. [Google Scholar]
- 95.Zhang B, Horvath S. 2005. A general framework for weighted gene co-expression network analysis. Stat Appl Genet Mol Biol 4:Article17. doi: 10.2202/1544-6115.1128. [DOI] [PubMed] [Google Scholar]
- 96.Kobayashi SD, Voyich JM, Buhl CL, Stahl RM, DeLeo FR. 2002. Global changes in gene expression by human polymorphonuclear leukocytes during receptor-mediated phagocytosis: cell fate is regulated at the level of gene expression. Proc Natl Acad Sci U S A 99:6901–6906. doi: 10.1073/pnas.092148299. [DOI] [PMC free article] [PubMed] [Google Scholar]
- 97.Gusa AA, Scott JR. 2005. The CovR response regulator of group A Streptococcus (GAS) acts directly to repress its own promoter. Mol Microbiol 56:1195–1207. doi: 10.1111/j.1365-2958.2005.04623.x. [DOI] [PubMed] [Google Scholar]
Associated Data
This section collects any data citations, data availability statements, or supplementary materials included in this article.
Supplementary Materials
Differentially expressed GAS genes comparing in vivo and in vitro samples. (A) Correlation coefficients for transcript data for in vivo and in vitro replicates. (B) Differentially expressed genes comparing in vivo versus in vitro ME and ES samples combined. (C) Differentially expressed genes comparing in vivo versus in vitro ME samples. (D) Differentially expressed genes comparing in vivo versus in vitro ES samples. (E) Differentially expressed genes encoding transcriptional regulators. (F) Virulence, metal homeostasis, and stress genes differentially expressed in vivo compared to both ME and ES phases in vitro. (G) Differentially expressed GAS genes comparing pooled sections 1 and 2 to pooled sections 3, 4, and 5. (H) Differentially expressed virulence genes comparing MGAS2221 and MGAS2221 ΔSpy0281. (I) Upregulated genes comparing MGAS2221 to MGAS2221 ΔdahA and to MGAS2221 ΔcovR. (J) Locus tag equivalence between MGAS2221 and MGAS5005. Download Table S1, XLSX file, 0.2 MB (227.3KB, xlsx) .
Copyright © 2020 Kachroo et al.
This content is distributed under the terms of the Creative Commons Attribution 4.0 International license.
Transcriptome analysis of GAS grown in vitro and in vivo and NHP samples. Principal-component analyses of transcriptome data were performed. The fold change value cutoff and adjusted P value cutoff were 1.5 and ≤0.05, respectively. (A) In vitro-grown GAS strains in triplicate at the mid-exponential (ME) and early stationary (ES) phases of growth and in vivo-grown GAS strains collected from three nonhuman primates (NHP). Five samples (sections 1 through 5) collected from each NHP were pooled for analysis. The in vitro ME replicates clustered together and grouped distinctly apart from the in vitro ES samples, and both the ME and ES replicates grouped apart from the in vivo samples. These three distinct clusters are highlighted within ovals. (B) In vivo-grown GAS samples are depicted as separate sections. Five sections corresponding to each NHP are highlighted. The sections are color coded, whereas NHPs are indicated by geometric shapes as follows: NHP-1, circles; NHP-2, triangles; NHP-3, squares. (C) In vivo grown samples from panel B shown at a larger scale. Phages and mobile genetic elements were excluded from the analysis. (D) Infected and mock-infected samples from three NHPs (NHP-1, blue; NHP-2, red; NHP-3, green). Data from mock-infected samples (hatched squares) and infected animals (nonhatched circles) clustered distantly from each other. (E) Infected (red) and mock-infected (blue) samples separated by sections. Each section was pooled from three NHPs. All sections corresponding to the mock-infected tissue clustered distinctly together, away from sections corresponding to infected tissue. Download FIG S1, EPS file, 0.5 MB (541.2KB, eps) .
Copyright © 2020 Kachroo et al.
This content is distributed under the terms of the Creative Commons Attribution 4.0 International license.
Sample collection for dual RNA-seq analysis and GAS genes differentially expressed during infection, grouped by functional categories. (A) The samples were processed in concentric sections. Section 1, at the center, corresponds to the inoculation site, and section 5 is the most distal section. The section-to-section borders are idealized and are less discrete than portrayed. Sections from infected tissue are color coded. Section 1 from the uninfected arm muscle corresponds to the inoculation site, where only PBS was injected. (B) Genes differentially expressed (DE) in vivo versus in vitro in the ME and ES growth phases combined. (C) Genes DE in vivo versus in vitro in the ME growth phase (nonhatched) and in vivo versus in vitro in the ES growth phase (hatched). The plots represent the percentage of up- and downregulated genes in each category. Functional categories were obtained from PATRIC (https://www.patricbrc.org/) for serotype M1 reference strain MGAS5005. Upregulated genes are represented in red and downregulated genes in blue. The fold change value cutoff and adjusted P value cutoff were 1.5 and ≤0.05, respectively. Download FIG S2, EPS file, 0.5 MB (559.8KB, eps) .
Copyright © 2020 Kachroo et al.
This content is distributed under the terms of the Creative Commons Attribution 4.0 International license.
Differentially expressed GAS genes implicated in carbon metabolism and extracellular oxidative stress defense in GAS. “Spy” numbers correspond to the annotation for serotype M1 reference strain MGAS5005. The fold change value cutoff and adjusted P value cutoff were 1.5 and ≤0.05, respectively. (A) Genes encoding glycolytic enzymes are downregulated, and genes involved in transport and utilization of ascorbate, malate, maltose, and glycerol are upregulated. Genes differentially expressed in vivo, compared to in vitro, at ME and/or ES growth phases are color coded. Upregulated genes are shown in red and downregulated genes in blue. Fold change values are represented in parentheses, with the first value corresponding to in vivo versus in vitro ME and the second value to in vivo versus in vitro ES. –, no differential expression. (B) Shift from homolactic fermentation to mixed-acid fermentation inferred from downregulation of ldh, encoding lactate dehydrogenase, and upregulation of lctO, encoding lactate oxidase, formate transport and assimilation, and mixed-acid fermentation. A reduction in lactate production is likely to result in decreased autoacidification. (C) (Top panel) Schematic of the ccdA, tlpA, and msrA operon in serotype M1 GAS. The transcriptional start site (i) (red arrow) was described previously by Rosinski-Chupin et al. (https://doi.org/10.1186/s12864-019-5613-5). The inferred enzymatic functions of the encoded proteins are indicated. The fold upregulation values in vivo, compared to both in vitro growth conditions, are depicted in parentheses (ME/ES). –, no differential expression. (Bottom panel) Proposed mechanism for GAS extracellular oxidative stress defense during invasive infections (ii) based on data for Streptococcus pneumoniae. Reducing equivalents (e-) from NADPH are channeled through the thioredoxin system in the cytoplasm and transferred to the outer side of the cell across CcdA. In turn, CcdA transfers the reducing equivalents to the thiol-disulfide oxidoreductase TlpA and through to the bifunctional methionine sulfoxide reductase MsrA. The result is increased protection from oxidation of cysteine residues in secreted proteins and reduction of methionine sulfoxides (iii to v), both likely occurring as a consequence of PMN oxidative burst. This system might also contribute to GAS extracellular protein folding (vi). Download FIG S3, PDF file, 1.0 MB (1,001.3KB, pdf) .
Copyright © 2020 Kachroo et al.
This content is distributed under the terms of the Creative Commons Attribution 4.0 International license.
Pathway analysis of differentially expressed genes in infected NHP tissue and heat map depicting relationship between gene coexpression modules. (A) Top 50 pathways associated with differentially expressed genes in the infected NHP tissue compared to mock-infected tissue. y axis data depict –log (P value). Pathways with P values of ≤0.05 were considered significant. Host pathways containing genes that were upregulated (top panel) or downregulated (bottom panel) during infection are indicated. (B) Heat map depicting similarity of gene coexpression modules (based on eigengene adjacency) among and between the 15-pathogen modules (PM) and 10-host modules (HM) identified by WGCNA (7). Eigengenes are module representatives, and eigengene adjacency is computed based on their correlation. The heat map is colored based on adjacency score as follows: red represents high adjacency (positive correlation), and blue represents low adjacency (negative correlation). GAS gene modules 5 and 6 (marked with an asterisk [*]) were positively correlated with host gene modules 7, 8, and 9 (highlighted in red) and negatively correlated with host gene modules 1 to 4 (highlighted in blue). Download FIG S4, PDF file, 0.4 MB (430KB, pdf) .
Copyright © 2020 Kachroo et al.
This content is distributed under the terms of the Creative Commons Attribution 4.0 International license.
DE genes and significantly enriched biological processes associated with upregulated and downregulated genes comparing infected versus mock-infected NHPs. (A) Differentially expressed genes. (B) Significantly enriched biological processes. Download Table S2, XLSX file, 0.2 MB (254.5KB, xlsx) .
Copyright © 2020 Kachroo et al.
This content is distributed under the terms of the Creative Commons Attribution 4.0 International license.
List of supplemental tables, study design, additional methods, and supplemental materials references. Download Text S1, DOCX file, 0.1 MB (84.4KB, docx) .
Copyright © 2020 Kachroo et al.
This content is distributed under the terms of the Creative Commons Attribution 4.0 International license.
Biomarker analysis of serum samples from humans and NHPs. The biomarkers selected for the custom panel were as follows: (i) BAFF/BLyS/TNFSF13B; (ii) CTSS/cathepsin S; (iii) CCL7/monocyte chemoattractant protein-3 (MCP-3)/MARC; (iv) CD30/TNFRSF8; (v) CD44; (vi) CD163; (vii) CXCL2/GRO beta/MIP-2/CINC-3; (viii) Fas/TNFRSF6/CD95; (ix) interferon (IFN) gamma; (x) IL-1 RII; (xi) IL-2; (xii) IL-8/CXCL8; (xiii) MMP-1; (xiv) S100A9; (xv) TNF-α; (xvi) TNF RII/TNFRSF1B; and (xii) TRAIL R3/TNFRSF10C. Red dots/bars, infected NHPs/patients. Blue dots/bars, uninfected NHP/control human serum. (A) Serum samples collected from 17 NHPs prior to inoculation with GAS and at the time of necropsy. The Wilcoxon matched-pair signed rank test was used to compute the P values. (B) Serum samples collected from three infected human patients and from nine healthy, uninfected donors. Statistical significance was computed using the Mann-Whitney U test. The y-axis data in both panels are represented on a log10 scale. Download FIG S5, EPS file, 0.5 MB (560KB, eps) .
Copyright © 2020 Kachroo et al.
This content is distributed under the terms of the Creative Commons Attribution 4.0 International license.
(A) Functional categories associated with the host gene modules (HM) identified by WGCNA. (B) COG enrichment analysis for pathogen modules (PM). Download Table S3, PDF file, 0.3 MB (327.2KB, pdf) .
Copyright © 2020 Kachroo et al.
This content is distributed under the terms of the Creative Commons Attribution 4.0 International license.
Flow charts depicting tissue collection, cDNA sequencing, and transcriptome data analysis. (A) Pipeline representing tissue collection and storage and sample preparation and processing for total RNA extraction, ribodepletion, cDNA library preparation, and cDNA sequencing. The superscript “(a)” indicates that 0.1-mm-diameter and 0.5-mm-diameter beads were used. The superscript “(b)” indicates that the use of the MasterPure protocol with the modification of three DNase treatments, instead of one. The superscript “(c)” indicates the use of a Ribo-Zero Gold rRNA removal kit. (B) Bioinformatic pipeline for demultiplexing, quality assessment, adapter trimming, read mapping to GAS and NHP genomes, data normalization, and differential expression of transcriptome data. Download FIG S6, EPS file, 0.4 MB (467.3KB, eps) .
Copyright © 2020 Kachroo et al.
This content is distributed under the terms of the Creative Commons Attribution 4.0 International license.
Data Availability Statement
A slightly updated complete genome sequence of emm1 reference strain MGAS2221 (GenBank accession number CP043530) has been deposited in the NCBI GenBank database under the same accession number. Transcriptome data have been deposited in the Gene Expression Omnibus under accession number GSE144100.