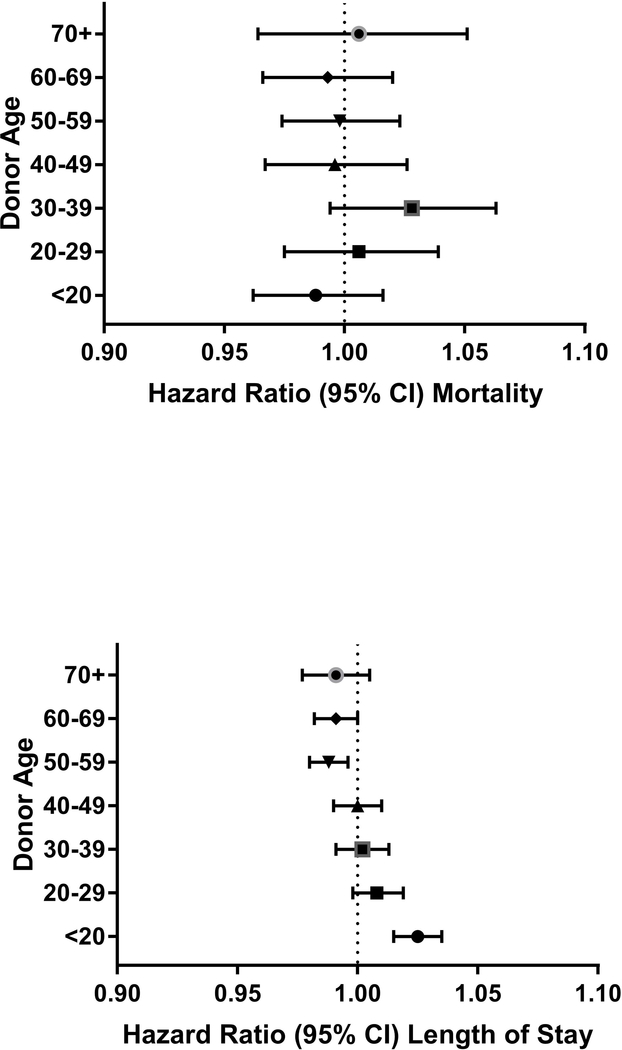
Figure 1:
Forest plots of hazard ratios of hospital mortality and length of stay per red cell unit transfused for groups of donor age (relative to the reference group of all other ages)
Hazard ratio estimates for length of stay denote likelihood of hospital discharge with increasing hazard ratio associated with shorter duration of hospitalization in patients who survived to discharge.

