

Abstract
Dorsal and ventral premotor (dPM and vPM) areas are crucial in control of hand muscles during object manipulation, although their respective role in humans is still debated. In patients undergoing awake surgery for brain tumors, we studied the effect of direct electrical stimulation (DES) of the premotor cortex on the execution of a hand manipulation task (HMt). A quantitative analysis of the activity of extrinsic and intrinsic hand muscles recorded during and in absence of DES was performed. Results showed that DES applied to premotor areas significantly impaired HMt execution, affecting task-related muscle activity with specific features related to the stimulated area. Stimulation of dorsal vPM induced both a complete task arrest and clumsy task execution, characterized by general muscle suppression. Stimulation of ventrocaudal dPM evoked a complete task arrest mainly due to a dysfunctional recruitment of hand muscles engaged in task execution. These results suggest that vPM and dPM contribute differently to the control of hand muscles during object manipulation. Stimulation of both areas showed a significant impact on motor output, although the different effects suggest a stronger relationship of dPM with the corticomotoneuronal circuit promoting muscle recruitment and a role for vPM in supporting sensorimotor integration.
Keywords: EMG, hand manipulation, hand motor control, intraoperative brain mapping, premotor cortex
Introduction
Control of hand muscles is fundamental for grasping and manipulating objects. In both the human and nonhuman primate, the activity of the premotor cortex (PM) shapes motor output of the hand, via the primary motor cortex (M1), in order to achieve adequate object-oriented hand configuration by means of appropriate patterns of muscle activity (Cerri et al. 2003; Shimazu et al. 2004; Dum and Strick 2005; Davare et al. 2006,Schmidlin et al. 2008; Davare et al. 2009; Prabhu et al. 2009; Boudrias et al. 2010; Davare et al. 2010, 2011; Kraskov et al. 2011; Fornia et al. 2016; Côté et al. 2017). In the nonhuman primate, the ventral and dorsal sectors of PM (vPM and dPM) are functionally and anatomically distinct and their patterns of corticocortical connections support the idea that both areas, in conjunction with M1, form a densely interconnected network involved in preparing and executing hand movements (Dum and Strick 2005; Hoshi and Tanji 2007). vPM is the core of the so-called “lateral grasping network” (Borra et al. 2017), implicated in a wide repertoire of sensorimotor transformations, assuring highly flexible hand–object interaction, including grasping with and without visual guidance (Ehrsson et al. 2000; Toni et al. 2001; Cavina-Pratesi et al. 2010; Nelissen and Vanduffel 2011; Nelissen et al. 2017), haptic object manipulation (Binkofski et al. 1999), tool prehension (Brandi et al. 2014), and hand postural control (Leo et al. 2016). The dPM area, rather than playing a role in direct sensorimotor processing, seems to be implicated in indirect processing by compiling motor information from sensory signals and integrating components of the required action to formulate an appropriate motor program (Hoshi and Tanji 2007). Despite the prevalent belief that dPM and vPM contribute differently to control of reaching (associated with dPM) and grasping (associated with vPM) movements, recent studies in both human and nonhuman primates supports the idea, already provided from past studies (Preuss et al. 1996; Binkofski et al. 1999; Fogassi et al. 1999; Ehrsoon et al. 2000; Raos et al. 2003), that distal hand movements are coded in both areas (Nelissen et al. 2017; Takahashi et al. 2017; Cavina-Pratesi et al. 2018). The different role of the two premotor sectors has been investigated using intracortical microstimulation (ICMS) studies in the anesthetized nonhuman primate (Cerri et al. 2003; Shimazu et al. 2004; Côtè et al. 2017), showing a prevalent inhibitory effect on the motor output of the primary motor cortex (M1) from dPM and a prevalent facilitation on M1 motor output from vPM. In spite of this evidence, the specific role of human premotor sectors in shaping muscle activity during hand–object interaction is still a matter of debate. Firstly, this is due to differences in the monkey and human brain, as the latter lacks clear architectonic landmarks between premotor areas, preventing a direct comparison between stimulated areas. The vast majority of electrophysiological studies in humans has been performed with noninvasive stimulation techniques such as transcranial magnetic stimulation (TMS), and actually supports the idea of a conjunct contribution of dPM and vPM in hand–object interaction (Davare et al. 2006; Vesia et al. 2018). TMS, however, suffers from poor spatial resolution, again preventing direct comparison with monkey data.
Attempting to overcome this limitation in humans, we investigated this issue in the present study with the more focal and direct approach facilitated by the brain mapping technique used during the surgical removal of brain tumors. In this clinical setting, the tumor is removed according to functional borders, by stimulating the cortical and subcortical structures with direct electrical stimulation (DES) to identify and preserve so-called “eloquent areas.” We here investigated the effect of DES delivered on premotor areas (vPM and the ventral sector of dPM as functionally defined by Mayka et al. 2006), but also extending to the adjacent inferior and middle frontal gyrus. DES was applied in patients undergoing awake surgery for brain tumor removal, while they performed a dedicated hand–object manipulation task (HMt). In this condition, should vPM and dPM modulate control of hand–object manipulation in different ways, DES delivered during HMt execution would be expected to impair the task with different features related to the stimulated area. The effect of DES on premotor areas was investigated offline by means of quantitative analysis of the electrical activity of hand muscles (electromyography [EMG]) recorded during HMt. The EMG activity recorded during stimulation of effective sites (i.e., the sites in which DES actually disrupted the HMt execution) was quantitatively analyzed to study whether the stimulating sites associated with perturbation and with anomalous patterns of muscle activity during task execution clustered in specific premotor sectors.
Materials and Methods
General Description and Clinical Setting
In this study, we analyzed data recorded during neurosurgical procedures for brain tumor removal performed with the brain mapping technique in awake patients. In the cohort of patients analyzed, the cortical areas exposed for clinical needs were stimulated with DES during the performance of a specific hand motor task (the hand manipulation task, HMt). This is a novel intraoperative tool, shown to be relevant in preventing post-operative apraxia, thus is useful for testing regions important in motor execution (see Rossi et al. 2018). Due to the location of the tumor, in these patients the cortical areas that were more systematically stimulated were the entire vPM area and adjacent inferior frontal gyrus, and the ventral sector of the dPM area and the adjacent middle frontal gyrus. The effect of DES on HMt execution was first assessed intraoperatively, by visual inspection of the behavior of the hand and by real-time monitoring of the free running EMG recorded from hand and forearm muscles. Second, a more complex quantitative analysis of the activity of a sample of hand and forearm muscles significantly involved in the motor task was performed offline using the recorded EMG, to more precisely characterize the effect of DES on muscle unit recruitment during HMt performance.
Patient Selection
We studied 36 right-handed patients (mean age 46 ± 12.5 SD, range 25–75) affected by a glioma in the left hemisphere, candidates for surgery requiring the exposure of the frontal lobe. Only patients with a tumor not infiltrating the investigated areas were considered for the analysis (for inclusion criteria see Fornia et al. 2016). Patients who received previous neurosurgical treatment were not included. All inclusion requirements were assessed in all patients, irrespective of tumor location, based on an extensive and multidisciplinary preoperative evaluation involving standard magnetic resonance (MR) studies and high angular resonance diffusion imaging (HARDI)-based diffusion imaging (spherical deconvolution). Volumetric scan analysis was used to define tumor location and volume. Tumor volume was computed on volumetric fluid-attenuated inversion recovery magnetic resonance imaging (MRI) scans for low-grade gliomas and on post-contrast T1-weighted MRI scans for high-grade gliomas. Tractography performed before the surgery allowed for the detection of the degree of infiltration of descending and associative pathways at both cortical and subcortical levels. Patients with sensory-motor deficits and/or cognitive deficits were not included in the analysis. Only patients either without or with a short history of seizures, well controlled with only one antiepileptic drug, were included in the analysis. All patients gave written informed consent to the surgical and mapping procedure and to use of data for research purposes, which followed the principles outlined in the “World Medical> Association Declaration of Helsinki: Research involving human subjects.” The study was performed with strict adherence to the routine procedure normally utilized for surgical tumor removal. Accordingly, all data analyzed were recorded during the electrophysiological monitoring and stimulating protocols (see below) adopted for routine clinical mapping.
Presurgical Routine
Preoperatively, all patients were assessed for handedness, neurological examination, and a neuropsychological evaluation of cognitive abilities including upper limb apraxia. The scores obtained by patients considered for the study fell within the normal range. Preoperative MRI was performed using a Philips Intera 3 T scanner (Best) (see Bello et al. 2014).
Intraoperative Procedure
Total intravenous anesthesia with propofol and remifentanil was used, and no muscle relaxants were employed during surgery to allow mapping of motor responses. A craniotomy was performed to expose the tumor area and a limited amount of surrounding tissue, including functional landmarks (primary sensory-motor cortex). Surgery was performed in all patients under asleep-awake-asleep anesthesia, with the aid of the neurophysiological brain mapping and monitoring techniques (Bello et al. 2014). Cortical and subcortical mapping, performed with DES to identify so-called “eloquent” structures, was mandatory to localize the cortical safe entry zone and the functional boundaries surrounding the tumor to guide resection at the subcortical level. We only report the results of the cortical mapping in this study. A brief description of the intraoperative setting for brain mapping and monitoring and of the intraoperative HMt follows.
-
Neurophysiological brain monitoring. During surgery, cortical activity was monitored by electroencephalography and electrocorticography (EEG, ECoG, Comet, and Grass). ECoG from a cortical region adjacent to the area to be stimulated was recorded by subdural strip electrodes (4–8 contacts, monopolar array referred to a mid-frontal electrode) throughout the whole procedure, to monitor the level of anesthesia and to detect after-discharges or electrical seizures during the resection. EEG was recorded with electrodes placed over the scalp in a standard array. EEG and ECoG signals were filtered (bandpass 1–100 Hz), displayed with high sensitivity (50–150 μV/cm and 300–500 μV/cm, respectively) and recorded. The integrity of the descending motor pathways was monitored throughout the procedure by using a “train-of-five” (To5) monitoring technique delivered to the primary motor (M1) cortex to elicit motor-evoked potentials (MEPs) in a sample of contralateral muscles (face, upper, and lower limbs) (Bello et al. 2014). To5 monitoring was suspended during cortical and subcortical mapping, performed during resection to avoid interference.
Electromyographic responses to stimulation of the motor areas (MEPs, EMG recruitment), as well as voluntary motor activity (free-running EMG), were recorded throughout the procedure by pairs of subdermal hook needle electrodes (Technomed) inserted into 20 muscles (face, upper, and lower limb) contralateral to the hemisphere to be stimulated, plus 4 ipsilateral muscles, all connected to a multichannel EMG recording (2000 Hz sample frequency, ISIS-IOM, InomedGmbH) (Bello et al. 2014).
- Neurophysiological brain mapping. To perform brain mapping, two stimulation techniques were available to the surgeon: the low frequency (LF-DES) and the high frequency (HF-DES) protocol (Bello et al. 2014).
- – HF-DES was delivered through a constant current monopolar stimulator (straight tip, 1.5 mm diameter (Inomed), with reference/ground on the scalp overlying the central sulcus). Trains of 1 to 5 constant anodal current pulses (pulse duration 0.5 ms; interstimulus interval, ISI: 3–4 ms) were delivered at variable intensity (intensity range 1–15 mA), depending on the patient’s cortical excitability and clinical condition.
-
– LF-DES consisted of trains, lasting 2 to 5 s, of biphasic square wave pulses (0.5 ms each phase) at 60 Hz (ISI 16.6 ms) delivered at variable intensity (intensity range 2–6 mA) by a constant current stimulator (OSIRIS-NeuroStimulator, Inomed) integrated into the ISIS System through a bipolar probe (2 ball tips, 2 mm diameter, separation 5 mm).The HF-DES, by eliciting MEPs, is particularly (although not exclusively, see Riva et al. 2016) effective in mapping the motor output from motor areas/pathways (Bello et al. 2014; Fornia et al. 2016). The LF-DES, acting on a small amount of surrounding tissue around the probe, is very efficient during surgery in the identification and preservation of structures subserving complex functions. In all patients considered for this study, the LF-DES was used first, during naming tasks to avoid language deficits (Bello et al. 2006) and then, during the HMt (see below a dedicated section) designed to avoid post-operative apraxia (Rossi et al. 2018).
HMt. During the procedure, brain mapping was performed by delivering LF-DES during the HMt execution. The same intensity adopted for language assessment was used during HMt. A specific tool was made for this specific purpose. It consists of a small cylindrical handle (∅ 2 and length 6 cm) inserted inside a fixed rectangular base (3×3 cm and 9 cm of length) by means of a worm-screw. The rectangular base was kept stable close to the patient’s hand along the armrest of the operating table, while the patient sequentially grasped, held, rotated, and released the cylindrical handle continuously with the thumb and the index finger, using a precision grip. The proximity between the hand and the cylindrical handle allowed the patients to perform the movement using just the fingers, avoiding any reaching movements (Fig. 1A1). Each patient, opportunely trained the day before surgery, was asked to repeat the task with the highest regularity paced by an internally generated rhythm, without any external cue or visual information about the hand or the cylindrical handle movement; thus, tactile and proprioceptive information was the primary feedback required for muscle control. During the procedure a trained neuropsychologist performed real-time monitoring of the patients’ HMt behavioral outcome, reporting real time to the surgeons any behavioral impairment in task performance and/or any somatic sensation reported by the patient. Moreover, any impairment was monitored online by the occurrence of a clear anomalous pattern of activation in hand and forearm muscles recorded by the EMG. In order to achieve the main aim of the study, an offline quantitative analysis of the EMG data was performed. To this aim, out of the 24 muscles simultaneously recorded in the clinical setting (including bilateral orbicularis oris, mylohyoid, mentalis, bilateral biceps brachii, bilateral triceps brachii, bilateral extensor digitorum communis [EDC], bilateral abductor pollicis brevis [APB], bilateral abductor digiti minimi, bilateral first dorsal interosseous [FDI], quadriceps, hamstring, tibialis anterior, triceps surae, flexos allucis brevis), the activity of the right APB, the FDI, and the EDC (see Fig. 1A1) was selected for the analysis. During surgery, the ongoing hand–object interaction was video recorded and synchronized offline with the EMG signal, the video of the surgical flap, and the DES onset/offset. At the beginning of the HMt session, the patient was asked to start the performance at his/her own rhythm and an average of 10 s was needed to achieve a rhythmic, regular, and stable task execution, assessed by online inspection of the behavioral outcome and of the ongoing EMG activity. The EMG during 10 s of regular performance was recorded and considered the baseline muscle activity in absence of stimulation. Once this condition was achieved, the LF-DES stimulation of the cortical areas of interest was delivered randomly during HMt execution. Stimulations were spaced by 3–4 s to avoid dragging effects. From a clinical point of view during the HMt intraoperative mapping, two different stimulation effects were observed:
1) Ineffective stimulation: DES during execution of the HMt was not associated to an anomalous EMG pattern of activity or clinically observable behavioral impairment of task performance;
2) Effective stimulation: DES during execution of the HMt was associated with anomalous EMG patterns of activity with clinically observable behavioral impairment of the task.
Figure 1.
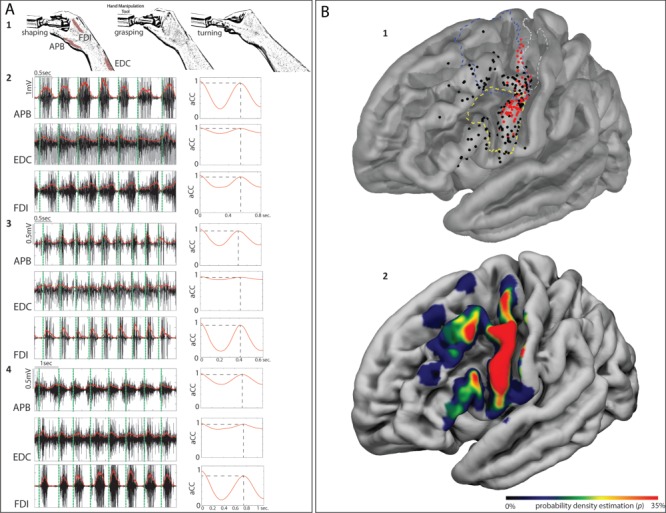
(A) 1: schematic representation of HMt execution. 2, 3 and 4: examples of EMG activity from the muscles recorded during HMt execution (APB; FDI; EDC) in 3 different patients. On the right side of each muscle, activity is shown by the level of autocorrelation of the fundamental frequency extracted by the EMG envelope. On the EMG activity of each muscle, the vertical green dashed line indicates the time in which the patient approached the object (shaping). The time between green vertical dashed lines indicates the time required by each patient to shape the fingers immediately before the contact with the object, to grasp it, to rotate it and turning back to the initial shaping phase. (B) 1: Cortical distribution of the effective (red) and ineffective (black) sites on the 3D FSAverage template overlapped with functional subdivision of the motor (BA4 upper limb (BA4ul) in dashed gray line, Fan et al. 2016) and dPM (in dashed blue line, Mayka et al. 2006) and vPM (in dashed yellow line, Mayka et al. 2006). 2: The same template shows the sampling density of stimulated sites within the investigated areas.
When effective stimulation occurred, extra time of 3–4 s was given to the patient to regain regular performance and to continue the procedure.
The clinical procedure adopted to identify the effective sites during mapping is standardized and well known in the neurosurgical literature (Duffau et al. 2002; Puglisi et al. 2018; Rossi et al. 2018). Once the surgeon finds a site responsive to DES, the probe is moved to stimulate other sites, then returns to stimulate the responsive site on two further occasions, in alternation with other sites. If the site is responsive for three out of three nonconsecutive trials it is considered effective. Conversely, if a site is not responsive in two out of two nonconsecutive trials, it is considered ineffective. In this setting, the total number of stimulations for each site was 3 for each effective site and 2 for each ineffective site. The effective sites were considered by the neurosurgeons (L.B. and M.R.) as “eloquent” areas for the HMt and thus preserved. In order to investigate the specificity of the effect of DES on the hand motor task, the effective sites were also stimulated while the hand was completely at rest (rest condition).
Data Analysis
In order to investigate the effect of LF-DES delivered on different premotor sectors during the HMt, the intraoperative EMG data recorded were extracted and analyzed as follows.
EMG Analysis
Recording, Selection, and Preprocessing of the EMG Signal
In compliance with the clinical procedure the EMG activity of all muscles, including the muscles selected for the study, was recorded during HMt (ISIS, INOMED, sampling rate 2000 Hz, notch filter at 50 Hz). These data were further analyzed offline. For each patient, the raw data were extracted and analyzed with a dedicated software (MatLab, Math Works 2016a) allowing for visualization and selection of EMG activity corresponding to the initial baseline and to the EMG activity occurring during the time window of stimulations, that is, between DES onset and DES offset (defined “EMG time window baseline” and “EMG time window DES-related,” respectively). The selection of the EMG time window baseline and DES-related was done for all the stimulated sites (effective and ineffective stimulation). The quantitative analysis of EMG signal was selectively performed on the EDC, FDI, and APB. For each patient and for each muscle, the EMG activity corresponding to the baseline was obtained by selecting 10 s of EMG signal (EMG time window baseline) corresponding to the regular and stable execution of the HMt preceding the mapping (stimulation) procedure. The EMG time window DES-related was selected by using the stimulation-related artifact from an electrode routinely placed on the forehead (close to the orbicularis oculi muscle) and recorded by one of the EMG-synchronized channels. The selected EMG was low-pass filtered at 500 Hz and multiple notch filters from 60 to 480 Hz were applied to remove LF-DES artifacts and its harmonics. In the analysis, following a careful offline inspection of the video regarding the patient’s performance during intraoperative mapping, we excluded data recorded during stimulation trials when DES-unrelated problems were reported.
Parameters Calculated on EMG
Two quantitative parameters were calculated on the EMG in each muscle across the different conditions, that is, all the stimulation trials (effective and ineffective) and the baseline:
The autocorrelation coefficient (aCC), was computed, in each patient, on all the EMG time window selected (i.e., baseline and DES-related) for each muscle. Specifically, the autocorrelation analysis (Matlab function “xcorr,” using the “unbiased” option) was applied on each EMG window selected, after being demeaned, full-wave rectified and low-pass filtered; the resulting autocorrelation function, when a phasic activity was maintained, was characterized by a prominent positive peak whose timing corresponded to the fundamental time period (f0), inverse of the fundamental frequency (Nelson-Wong et al. 2009); the y-value of this peak was the aCC index accounting for the regularity/rhythmicity of the phasic muscle contraction during HMt execution. The closer to the unitary value the peak aCC index is, the more repeatable and regular it is to be considered the EMG pattern. Therefore, the values of aCC close to one accounted for the adequate activation (phasic) in time of muscles contraction during HMt execution (see baseline examples on Fig. 1A2–4). When, due to a missing repetitive pattern, no prominent positive peak was identified on the autocorrelation function, the aCC was given a null value (aCC = 0), while when the repetitive activation pattern was partially disrupted, the prominent peak lowers and so does the aCC. In the analysis we first quantified the overall patient’s muscle performance, using the aCC value from each muscle. We next assessed the level of variability in muscle performance, using the maximal semidispersion (max-min/2) between the aCC of the three muscles (aCCvar). These parameters enabled estimation of the effect of DES on the rhythmicity of muscles during HMt execution.
- The root mean square (RMS) was estimated on the EMG activity according to the following formula:
The RMS of each muscle during effective and ineffective stimulation was normalized to the RMS activity of the corresponding muscle recorded at baseline according to the formula
 . We used the normalized RMS from each muscle to quantify the amount of motor units recruited during task execution and the RMS variation (RMSvar), calculated as maximal semidispersion (max-min/2) across muscles, to quantify the level of variability among muscles in unit recruitment during HMt execution.
The mean normalized RMS activity during ineffective stimulation was used as a marker to quantify the delay between DES onset and the significant variation of RMS activity for the effective stimulations. Significant variation in muscle recruitment was recorded when RMS activity during DES negatively or positively exceeded the mean RMS activity during ineffective stimulation ±2SD.
These parameters allowed for estimation of the effect of DES on motor unit recruitment in all muscles, irrespective of the rhythmicity of HMt execution, to disclose whether the effect of DES, either excitatory or inhibitory, was homogenously distributed across muscles.
. We used the normalized RMS from each muscle to quantify the amount of motor units recruited during task execution and the RMS variation (RMSvar), calculated as maximal semidispersion (max-min/2) across muscles, to quantify the level of variability among muscles in unit recruitment during HMt execution.
The mean normalized RMS activity during ineffective stimulation was used as a marker to quantify the delay between DES onset and the significant variation of RMS activity for the effective stimulations. Significant variation in muscle recruitment was recorded when RMS activity during DES negatively or positively exceeded the mean RMS activity during ineffective stimulation ±2SD.
These parameters allowed for estimation of the effect of DES on motor unit recruitment in all muscles, irrespective of the rhythmicity of HMt execution, to disclose whether the effect of DES, either excitatory or inhibitory, was homogenously distributed across muscles.
Figure 4.
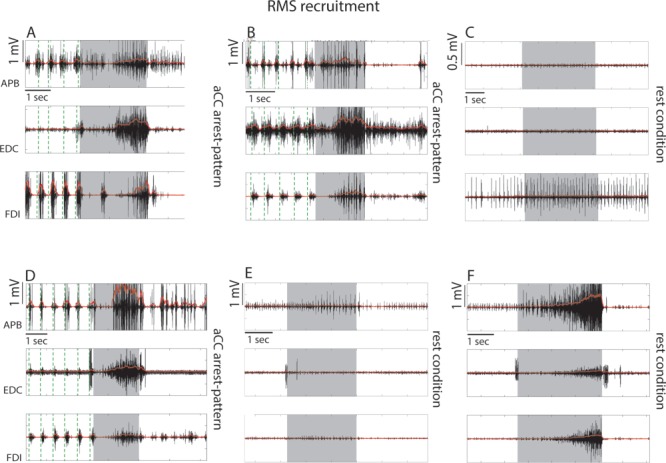
Examples of single effective stimulations in 3 different patients resulting in RMS recruitment responses when ventrocaudal sector of dPM was stimulated. The EMG activity of the APB, EDC, and FDI are shown as raw signal (black) and rectified signal (red). (A, B, D). Stimulation evoked an involuntary hand–forearm movement interfering with task execution concomitantly to general muscle recruitment occurring in all muscles. The significant muscle recruitment obtained in each trial was preceded with a variable delay by a brief suppression-like effect. Effective site characterized by these responses belong to the “aCC-arrest” pattern. Stimulation of the same effective sites showing response B and D when the hand was at rest did not evoke significant muscle activity (C, E). (F) An example of stimulation in the rest condition of a site close to central sulcus (caudal hand-knob) in the same patient showing response D and E. In this case a significant muscle activation was evoked. Gray shadows in each graph indicate the time window of DES stimulation, while the green vertical dashed lines indicate the beginning of each task cycle behaviorally defined (see Fig. 1A).
Detailed Analysis of aCC and aCCvar
Correct execution of the HMt task was assessed by a regular EMG pattern aCCvar, calculated using the ongoing activity of three hand muscles during HMt execution, was used to evaluate DES outcome, since it strictly reflected the regularity of the EMG pattern and thus the degree of patient performance. This analysis was chosen to provide a quantitative estimation of the effect of DES on HMt execution. Based on this analysis, the effective sites are expected to be characterized by lower aCC values with respect to ineffective sites, possibly with different degrees of variability among muscles (aCCvar), estimating the loss of muscle coordination. First, we performed the aCC analysis by comparing aCC values recorded for each individual effective site (n = 3 trials for 3 muscles) with the same parameter recorded for all the ineffective sites (n = minimal number of trials was 2 for 3 muscles) at the single patient level. Comparison was performed independent of muscle, by means of the Mann-Whitney U-Test (a non-parametric test was used due to the small sample of trials that were available for a single patient). As a second step, we studied the correlation (Spearman rank order) between aCC and aCCvar in the effective and ineffective sites to investigate to what extent impairment in patient’s performance was associated with higher variability among muscle performance.
Detailed Analysis of RMS and RMSvar
Correct execution of the task, besides a regular EMG pattern, requires a specific motor unit recruitment (measured with RMS), which has to be correctly balanced among the muscles (measured with RMSvar) performing the task. RMS analysis was performed in order to study the effect of the DES on muscle recruitment during HMt execution. The aim was to compare muscle recruitment in the effective sites with respect to the ineffective sites for each patient and to study whether DES on the effective sites, induced different muscle recruitment profiles during HMt. RMS analysis was performed, comparing normalized RMS recorded in the effective sites (n = 3 trials for 3 muscles) with the same parameter recorded for the ineffective sites (n = minimal number of trials was 2 for 3 muscles) at single patient level. Comparison was performed independent of muscle, by means of the Mann-Whitney U-Test. RMSvar was used to estimate the effect of DES on motor unit recruitment variability among muscles within effective sites showing different muscle recruitment profiles. Comparison was performed by means of the Mann-Whitney U-Test.
Behavioral Outcome Classification
In each patient, the effect of DES during HMt for each cortical site (effective or ineffective) was video recorded and the movement of the hand with respect to the object to be manipulated was visually inspected offline. This allowed us to investigate whether the different EMG pattern possibly emerging from the quantitative analysis might correlate with different behavioral outcomes.
Anatomo-Functional Reconstruction
For each patient, the reconstruction of the exact position of the effective and ineffective sites over the cortex was computed. During intraoperative mapping, the exposed craniotomy was video recorded, and the MRI coordinates of the sites were acquired using a neuronavigation system (Brainlab). To determine the exact position of the sites on the 3D MRI cortical surface of each patient the following procedure was adopted. The post-contrast T1-weighted sequence (TR/TE 2000/10 ms; FOV 230 mm; 176 slices; matrix, 400 × 512; SENSE factor 1.5) of each patient (the same loaded into the neuronavigation system during surgery) was used to perform the cortical surface extraction and surface volume registration computed with the FreeSurfer Software (Fischl 2012). Subsequently, the results were loaded in a Matlab Tool Box, Brainstorm (Tadel et al. 2011), which is a documented software freely available for download online under the GNU general public license (http://neuroimage.usc.edu/brainstorm). With the aid of Brainstorm, the exact site coordinates were marked on the patient’s 3D MRI native space. Subsequently, the MRI and site were coregistered to MNI space using unified segmentation implemented in SPM 12 (Ashburner and Friston, 2005) (see Fig. 1 in Supplementary Material). The coordinates of each site of all patients were defined on the FSAverage template to create a 3D reconstruction of the left (stimulated) hemisphere, spatially matched with functional subdivision of pre-motor areas (Mayka et al. 2006) and upper limb representation of BA4 (BAul, Fan et al. 2016). Due to anatomical variability among patients, particularly in this clinical setting (Quinones-Hinojosa et al. 2003), normalization steps may introduce some spatial inaccuracies. To avoid mismatching between native and MNI space, for each patient we checked the quality of the coregistration procedure (matching the native and MNI localization of the anterior and posterior commissures, median line, and ventricles) and we visually inspected the location of the stimulated sites on the MNI template with respect to its localization in native space. All the sites (effective and ineffective) reported in the present study matched with the original/native anatomical localization.
To investigate whether the effective sites clustered in specific subsectors within the whole stimulated cortex, a modified in-house version of kernel density estimation implemented in MatLab and based on the geodesic distance between sites was designed to take into account the quantitative characterization of each effective site. Standard kernel density estimation considers all points within the distribution as equal. This is not appropriate in this case, since the effect of DES on each effective site is associated with quantifiable values of aCC/aCCvar and RMS, and estimation must cluster the sites with similar features based on this characterization. In order to highlight the differences between stimulation sites and obtain a more realistic estimation of the probability function, every site has been weighted with the natural exponential of the value of the parameter measured on that site (aCC, aCCvar, and RMS). This leads to higher probability values around stimulation sites with a higher weight value, discriminating between different effects of DES on muscles during HMt. The results were plotted on the 3D FSAverage template. In this regard and based on the results of the EMG analysis, three analyses were performed:
1) Localization of the premotor sectors in which DES evoked the lowest aCC values during HMt execution. We evaluated the anatomical sectors containing effective sites associated with very low muscle performance, characterized by complete task arrest (aCC-arrest pattern). A probability density estimation was applied on the anatomical coordinates of each effective site, weighted by the corresponding mean regular phasic activity (aCC) among muscles; the lower the aCC value induced by DES, the more salient the effective site.
2) Localization of the premotor sectors in which DES evoked the highest aCCvar values during HMt execution. We evaluated anatomical sectors for which effective sites were associated with high variability among muscles, possibly reflecting poorer muscle coordination (aCC-clumsy pattern). A probability density estimation was applied on the anatomical coordinates of each effective site, weighted by the corresponding variability of phasic activity (aCCvar) among muscles during HMt execution; the higher the aCCvar value induced by DES, the more relevant the effective site.
3) Localization of premotor sectors based on RMS analysis. A probability density estimation was applied on the anatomical coordinates of each effective site, weighted by the corresponding mean-normalized RMS value among muscles recorded during HMt execution.
We assessed the localization of these sectors with respect to predefined premotor sectors defined by meta-analytic techniques (Mayka et al. 2006). Finally, we assessed the percentage of overlap in these sectors, in order to study the anatomical relationship between effective sites showing different aCC patterns and motor unit recruitment (RMS). The surface volume obtained from each density estimation analysis was thresholded to include the volume represented by a probability threshold higher than 35%. This threshold was arbitrarily chosen to best show the main results of the analysis.
RESULTS
Thirty-six right-handed patients, all candidates for awake surgery for brain tumor resection in the frontal lobe of the left hemisphere were enrolled in this study. All patients satisfied the required inclusion criteria. In 36 patients, 75 effective sites (out of 227 stimulated sites) were intraoperatively identified (mean sites for patient = 6 ± 3.1; mean effective sites for patient = 2 ± 1.5).
The reconstruction based on anatomical landmarks and location of all the stimulated sites (Fig. 1B1) showed that the effective sites were found within the precentral gyrus (PreCG) mainly clustering in vPM cortex (n = 46) and the ventrocaudal sector of the dPM (n = 29) at the border with the upper limb representation in primary motor cortex (M1). No effective sites were found in the inferior frontal gyrus (n = 14 sites) and in the middle frontal gyrus (n = 16 sites). Figure 1B2 shows the sampling density of stimulation sites within the investigated left frontal lobe. Despite the differences in the number of stimulated sites for each area, due to clinical reasons, a similar percentage of incidence of effective sites out of the total amount of sites between areas was observed (in vPM: n = 46 out of 115, 40%; in dPM: n = 29 out of 82, 35.4%, Chi-square p = 0.657), allowing for a reliable comparison. Probability density analysis was applied to investigate the anatomical clustering based on aCC/aCCvar and RMS analysis. The results are presented below.
EMG Analysis
aCC and aCCvar results
The aCC value was used to estimate the effect of stimulation on the rhythmicity of muscle performance during the HMt execution, providing a quantitative measure of DES-induced impairment on overall performance. aCC analysis showed that 74 out of 75 effective sites showed aCC values statistically lower with respect to ineffective sites. Figure 2A shows the mean aCC value computed on EMG, recorded during stimulation of each of the 75 effective sites (red line and dot) and the mean aCC value, computed on EMG recorded during stimulation of ineffective sites (black line and dot) within patients. The gray dashed line and dots in Figure 2A represent the baseline that, although not considered for the statistical analysis, was plotted for visual inspection with respect to ineffective sites. The results were divided by the two different sectors of PM (dPM and vPM), and ranked, for each area, from the lowest to the highest mean aCC value recorded from effective sites (indicated as numbers on x-axis). The results showed that DES stimulation of both ventrocaudal dPM and vPM during HMt execution evoked a wide range of effects on phasic muscle performance, ranging from complete arrest of phasic muscle activity (aCC = 0 in 41 effective sites) to partial impairments in different sites (aCC > 0 in 33 effective sites). A significant positive correlation between aCC and aCCvar occurred for effective but not for ineffective sites (respectively R = 0.9 and R = 0.1), suggesting that partial impairment of performance was generally associated with an increase in variability among the individual muscles. Despite the wide range of responses, these results suggest the emergence of two main aCC patterns on the time course of muscle contraction during HMt execution: 1) a complete disruption of the EMG pattern obtained similarly in all muscles, characterized by the lowest aCC and therefore aCCvar value (aCC-arrest pattern); 2) a partial disruption of the EMG pattern characterized by a higher variability among muscles performance shown by the highest value of aCCvar (aCC-clumsy pattern).
RMS and RMSvar results
Figure 2.
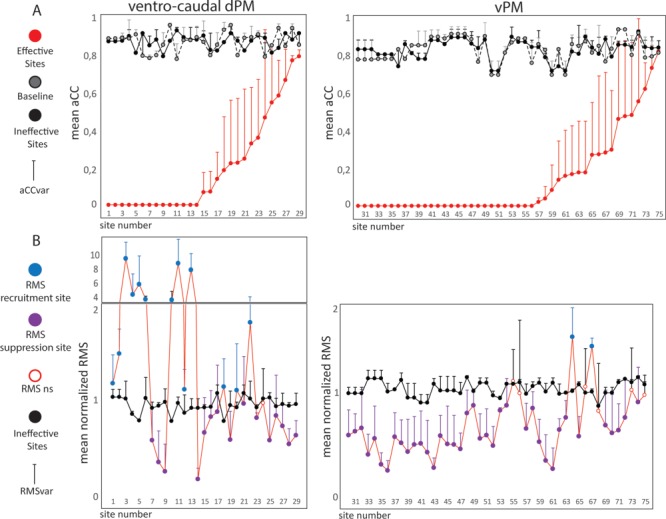
(A) For each effective site the following is represented: the mean aCC value among muscles (red line and dot), the corresponding mean aCC value during baseline performance (gray dashed line and dot) and the mean aCC value during stimulation of the ineffective sites (black line and dot). The result is presented divided by different premotor areas, and the effective sites are ranked according to the aCC value from lowest to highest. For each dot the whisker indicates the aCCvar value. (B) Each dot represents the mean normalized RMS value among muscles for each effective site (red line) and the mean normalized RMS value among muscles for the corresponding ineffective sites (black line and dot). The effective sites are ranked according to Fig. 2A in order. effective sites are represented with a color code indicating the results of the comparison: blue dots represent the effective sites in which stimulation evoked a muscle recruitment (RMS recruitment sites); purple dots represent the effective sites in which stimulation inhibited the muscle recruitment (RMS suppression sites); white dots represent the effective sites in which no statistical differences were reported (RMS ns). For each dot the whisker indicates the RMSvar value.
Control of dexterous movement relies on precise and refined distribution of facilitation and inhibition among the muscles engaged, in order to achieve the correct hand–finger configuration. We investigated whether the impairment of HMt associated to DES was due to a specific effect on hand muscle recruitment, that is, an imbalance in excitatory and inhibitory inputs to hand muscles, by performing RMS analysis. Results showed that 68 out of 75 effective sites showed normalized RMS that was statistically different with respect to the ineffective sites. Six effective sites (1 in dPM and 5 vPM) were statistically different from ineffective sites identified in the aCC analysis, but not the RMS analysis. One site did not show statistical differences in either analysis. In Figure 2B we show the mean normalized RMS value recorded from each of the 75 effective sites (blue or purple dots based on statistical results) and the mean normalized RMS value recorded from the ineffective sites (black line and dot), both calculated within patients. In Figure 2B the RMS data ranking parallels the ranking order adopted in Figure 2A, allowing for a direct comparison of the two parameters (aCC and RMS for each site). Of the 68 effective sites showing statistical differences in RMS compared to ineffective sites, 53 showed an overall suppression in muscle recruitment (RMS suppression sites, Fig. 2B purple dots). In most cases, this effect corresponded with abrupt task interruption due to the arrest of hand/finger movements, observable on the video recording (Supplementary Video 1). In 60% of cases, the RMS suppression effect occurred almost simultaneously (or with a very short delay) to DES onset (<50 ms) (see example in Fig. 2B and Fig. 3A,B in Supplementary Materials). In other cases, progressive general muscle suppression was observed, behaviorally associated with a slowdown of the movement and loss of appropriate finger coordination; in some cases, hand–object contact was lost, while in other cases the movement gradually decreased in amplitude and regularity (see example Fig. 3D,E and Supplementary Video 2 and Fig. 2C in Supplementary Materials). In these cases, the delay between DES onset and the suppression effect was variable among muscles ranging from 200 ms to 2 s.
Figure 3.
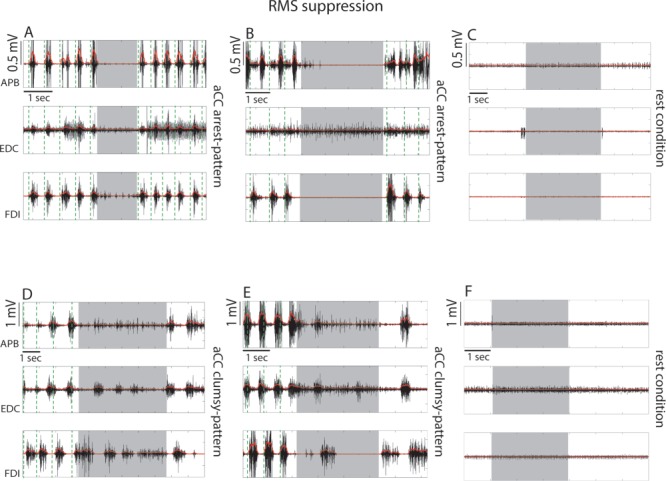
Examples of single effective stimulations in 4 different patients resulting in RMS suppression responses when the dorsal sector of vPM was stimulated. The EMG activity of the APB, EDC, and FDI are shown as raw (black) and rectified signal (red). (A, B) Stimulation evoked a complete and sharp arrest of task execution concomitantly to a muscle suppression observed in all muscles. Effective sites characterized by this response belong to the “aCC-arrest pattern”. Stimulation of the same effective site showing response B, where stimulation of the hand at rest did not evoke significant muscle activity (C). (D, E) Stimulation evoked an arrest of task execution with a general muscle suppression although this was not homogeneously distributed in the different muscles. Effective sites characterized by this response belong to the “aCC-clumsy” pattern. Stimulation of the same effective site showing response E, with the hand at rest did not evoke significant muscle activity (F). Gray shadows in each graph indicate the time window of DES stimulation, while the green vertical dashed lines indicate the beginning of each task cycle behaviorally defined (see Fig. 1A).
Stimulation of 15 effective sites impaired task execution due to overall muscle recruitment (RMS recruitment sites, in Fig. 2B blue dots), in most cases associated with abrupt task interruption due to involuntary or dysfunctional hand movement (Supplementary Video 3). In 75% of these cases, muscle recruitment was delayed with respect to stimulus onset by an initial period of muscle suppression (mean delay among muscles = 320 ± 74.67 ms) followed by a progressive clear recruitment of motor units, lasting until DES was removed (see example Fig. 4A,B,D and Fig. 2A in Supplementary Materials). The recruitment effect showed significantly higher RMSvar with respect to the suppression effect (P < 0.000), suggesting that the recruitment effect was not homogeneously distributed among muscles.
The sites associated with RMS suppression and recruitment were tested also with the hand at rest as a control condition. All suppression sites and 5 out of 15 recruitment sites were tested with the hand at rest. In all cases during DES, RMS activity did not exceed the mean RMS activity recorded at rest, showing a lack of clear motor output of DES in this condition (see examples in Figs 3C–F and 4C–E).
Anatomo-Functional Results
1) Localization of the premotor sectors in which DES evoked the lowest aCC values during HMt execution (aCC arrest-pattern). Probability density estimation showed that DES in two distinct premotor sectors evoked the most compromised muscle performance during HMt: the most dorsal investigated sector of the ventrocaudal dPM and the dorsal sector of vPM (Fig. 5A).
2) Localization of the premotor sectors in which DES evoked the highest aCCvar values during HMt execution (aCC clumsy-pattern). Probability density estimation showed that the dorsal sector of vPM and its transition with dPM evoked higher variability among muscles performance (Fig. 5B).
3) Localization of premotor sectors based on RMS analysis. The RMS analysis revealed two types of effects evoked by DES during HMt: pure RMS suppression and RMS recruitment. Probability density estimation showed that RMS recruitment effect was mainly evoked by stimulating the most dorsal investigated sector of dPM (Fig. 5D), while the RMS suppression sites clustered mainly in the dorsal sector of vPM (Fig. 5E).
Figure 5.
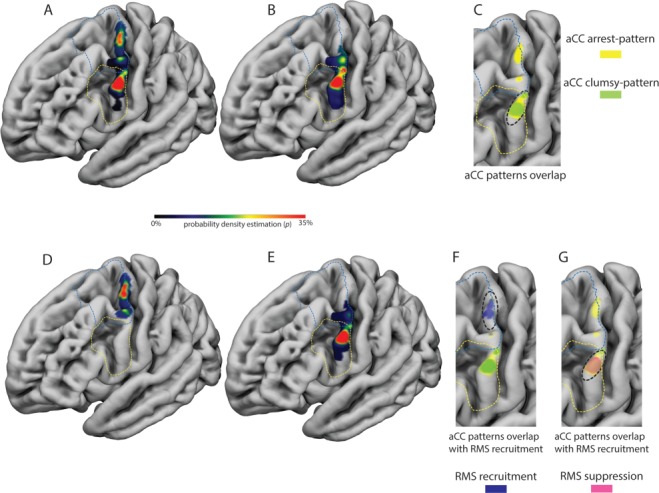
(A) The distribution of the probability density estimation of the “aCC-arrest” pattern, characterized by fully compromised muscle performance is reported on the 3D FSAverage template. The aCC-arrest pattern was clustered in the dorsal sector of vPM and in the most dorsal investigated sector of dPM. (B) The distribution of the probability density estimation of the “aCC-clumsy pattern”, characterized by higher variability among muscle performance, is reported on the 3D FSAverage template. The aCC-clumsy pattern was clustered mainly in the dorsal sector of vPM and at the transition between vPM and dPM. (C) The two patterns completely overlap only in the dorsal sector of vPM (see black dashed line). (D) The distribution of the probability density estimation of the “RMS recruitment sites”, characterized by an involuntary movement and a general unspecific increase of muscles activity, is reported on the 3D FSAverage template. These sites were mainly localized in the most dorsal investigated sector of dPM. (E) The distribution of the probability density estimation of the “RMS suppression sites”, characterized by hand movement arrest and a general decrease of muscle activity, is reported on the 3D FSAverage template. These sites were mainly localized in the dorsal sector of vPM. (F) the RMS recruitment sites overlap with the dorsal spot hosting sites showing the aCC-arrest pattern (see black dashed line), while in (G) the RMS suppression sites overlap with both the most ventral sector of the aCC-arrest and clumsy patterns (see black dashed line).
The anatomical relationship between the probability density maps regarding localization of the RMS-related sectors with respect to localization of sectors showing the most compromised muscle performance (aCC-arrest pattern) and the higher variability among muscle performance (aCC-clumsy pattern) was investigated by studying the extent of overlap between sectors. Within vPM, there was 82% overlap between the sector related to the aCC-clumsy pattern and the sector related to the aCC-arrest pattern, while in dPM only the aCC-arrest pattern was present (Fig. 5C). The sector associated with RMS recruitment overlapped only with the sector related to the aCC-arrest pattern in dPM (Fig. 5F), while the volume related to the RMS suppression sites overlapped with both aCC-arrest and aCC-clumsy patterns in vPM (Fig. 5G).
Overall, these results showed that stimulation of vPM induced both aCC arrest and aCC clumsy patterns, both mainly characterized by a suppression of motor unit recruitment required by the task. Stimulation of dPM also induced a significant aCC arrest-pattern, mainly characterized by a general recruitment effect, notably preceded by a brief muscle suppression.
Discussion
The aim of this study was to investigate the human PM involved in control of muscle activity required for hand–object interaction. To this aim, we analyzed data collected with a direct electrophysiological approach during neurosurgical procedures for brain tumor removal with the aid of the brain mapping technique. During the procedure, DES was delivered on human premotor areas of awake patients performing a dedicated hand motor task. Quantitative assessment of the effect of DES was computed on EMG recorded on hand muscles during task execution. Our results showed that DES caused a range of severity of impairment on hand movements, characterized by different patterns of muscle recruitment in two distinct subsectors of the PreCG. Importantly, our results support the correspondence between “eloquent” areas identified with DES during HMt and the areas identified in previous human studies using indirect approaches, showing areas involved in control of hand movement during grasping and/or object manipulation under or in absence of visual guidance (Binkofski et al. 1999, Ehrsson et al. 2000, Toni et al. 2001, Marangon et al. 2016).
Electrophysiological Characterization of HMt-Effective Sites Suggests Different Roles of Human Premotor Areas in Shaping Hand Muscles during HMt Execution.
Overall, the aCC and aCCvar analysis showed that DES within premotor areas does not affect task execution with a univocal effect. The aCC and aCCvar analysis demonstrated the emergence, among the 75 effective sites, of two main patterns of interference: an aCC-arrest pattern, showing a complete impairment of muscle performance, and thus of task execution, homogeneously distributed among all the muscles considered (assessed by both low aCC and aCCvar), and an aCC-clumsy pattern showing a partial impairment of muscle performance mainly due to a high level of variability between muscles (assessed by higher aCCvar). According to the probability density analysis, the aCC-arrest pattern can be evoked by stimulation of both dorsal vPM and ventrocaudal dPM, while the aCC-clumsy pattern seems to be primarily specific to vPM. Based on this evidence, the range of effects observed might be reasonably due to stimulation of different neuronal substrates playing different roles in motor control of HMt execution. According to this hypothesis, the most severe impairment (aCC-arrest pattern) might be due to stimulation of neuronal substrates closely implicated in motor output execution, an aspect crucially shared by both vPM and dPM (Dum and Strick 2005; Hoshi and Tanji 2007). On the other hand, the partial impairments (aCC-clumsy pattern) observed selectively in vPM might be due to the disruption of ongoing processes of sensorimotor integration for controlling hand actions. Coherently, the rostral sector of vPM in the nonhuman primate (F5) hosts both pure motor and bimodal neurons with large somatosensory receptive fields on the hand/upper-limb, increasing their firing rate during grasping motor acts (Maranesi et al. 2012). These features are in line with our findings. In fact, the intraoperative HMt, performed in absence of visual guidance, relies primarily on somatosensory feedback. In this regard, F5 receives higher order somatosensory information from secondary somatosensory cortex and inner perisylvian regions, a network implicated in somatomotor integration (Ishida et al. 2013). Moreover, the aCC-clumsy pattern, from a behavioral perspective, resembles the effect obtained by temporary inactivation of F5 sector and premotor lesions in humans. In particular, following inactivation of large portions of F5, primates often either refuse to grasp small objects or, during the attempt, grasping was clumsy, and the hand shape was inappropriate to object size, shape, and orientation (Fogassi et al. 2001). Similarly, lesions of human PM lead to myelokinetic apraxia (Kleist, 1934). In this syndrome, patients are unable to manipulate objects correctly in the absence of any deficit of force. Similar behavioral results were also reported during transient TMS-induced virtual lesions of human vPM while performing a precision grip, altering the correct adjustment of fingers on the object, and thus increasing their dispersion (Davare et al. 2006).
The effects measured with the aCC/aCCvar analysis should not however be considered exhaustive, in that they do not allow for inference on the specific effect of DES on motor unit recruitment, an important feature in understanding the role of the two areas in control of task execution. It was thus important to perform the muscle recruitment analysis, in order to investigate the overall direction of the effect (suppression or recruitment) and the variation of this effect among muscles. HMt execution requires dexterous movement relying on a precise balance between inhibition and facilitation of muscle recruitment during hand–object interaction. The analysis revealed that the effects highlighted by the aCC analysis were mainly associated with a general suppression of the muscle activity during HMt (RMS suppression sites) or with general and progressive muscle recruitment lasting till the end of the stimulus (RMS recruitment sites). Interestingly, the recruitment effect showed higher variability between muscles with respect to the suppression effect (as assessed by the RMSvar). This variability might be due to the timing of stimulation with respect to the time course of task execution. During the HMt, the different phases of task execution require different engagement of the muscles to build up, together, adequate muscle synergies required to achieve correct task execution. In this context, DES delivered in different trials might affect motor unit recruitment to different extents, depending on the phase of the task “perturbed” by the stimulation (possibly favoring activation of the muscle mainly engaged at stimulus onset). However, data collected in this study prevents a rigorous investigation of this hypothesis, given that DES was applied randomly during task execution, rather than triggered during a specific phase of the HMt execution, an essential condition to measure and correlate the effect with a specific phase of the task.
Based on probability density estimation, RMS suppression and RMS recruitment sites were segregated in different premotor sectors. The “pure” suppression responses were significantly evoked by stimulation of the dorsal sector of vPM, within which both the aCC-arrest and aCC-clumsy patterns coexisted. The recruitment responses were segregated in the most dorsal investigated sector of dPM, where DES evoked the aCC-arrest pattern. Despite the subdivision between suppression and recruitment sites based on statistical analysis and their different anatomical segregation in PM, both vPM and dPM showed a muscle suppression response. However, differently from vPM where the suppression effect evoked by DES was observed for the whole stimulation period, DES applied to dPM evoked a suppression effect lasting for about 320 ms, followed by clear muscle recruitment. Balance between inhibition and excitation is crucial for efficient sensorimotor control. From a functional perspective the inhibition of muscle activity in both areas might suggest a role in suppressing unwanted output during motor preparation, avoiding early movement release and refining muscle activity during execution in order to correctly grasp and manipulate objects. Despite the occurrence of the aCC arrest pattern in both areas, RMS analysis shows that DES in dPM, but not in vPM, evoked muscle recruitment following early suppression. This result suggests that dPM, rather than vPM, has a stronger relationship with the corticomotoneuronal circuit promoting muscle recruitment. From anatomo-functional perspective the recruitment effect obtained in dPM might be mediated by its corticospinal projections to upper and lower cervical segments or by corticocortical interactions with M1. A recent study in nonhuman primate reported a higher correlation of the dPM neurons discharge, compared to vPM, with movement kinematics, suggesting a direct involvement in motor output (Takahashi et al. 2017). However, the present study cannot provide conclusive evidence to address this issue.
Based on intraoperative findings both vPM and dPM have recently been suggested to be “negative motor areas”, albeit without electrophysiological verification (Rech et al. 2019). In the present study the behavioral outcome supported by the EMG analysis showed that DES of vPM actually evoked motor responses that could be properly defined as negative responses, while dPM showed a mixed suppression-recruitment effect that cannot strictly be considered “negative” on the basis of muscle activation. Similar effects have been reported by our group in a previous study investigating the rostral sector of the hand-knob in the right hemisphere during intraoperative performance of the same motor task (Viganò et al. 2019). A more appropriate and exhaustive definition of “negative motor area” is certainly mandatory, and the possible role of the classical ‘negative motor areas’ (Lüders et al. 1995) in motor control is still a matter of debate (Filevich et al. 2012). From a perspective based on the present findings, both anatomical and electrophysiological, we thus simply suggest that these areas play an important role in balancing facilitation-inhibition input to M1 to shape the appropriate motor output for the intended action.
These results, however, are conflicting with the evidence provided by studies on the nonhuman primate investigating the functional interaction between vPM/dPM and M1 with a conditioning-test paradigm, suggesting a prevalence of powerful facilitation from vPM and inhibition from dPM on the M1 motor output (Cerri et al. 2003; Shimazu et al. 2004; Côtè et al. 2017). In this regard, discussion of the two sets of results must consider the different experimental (sedated nonhuman primates) and clinical (brain mapping in awake neurosurgical patients) setting, constraining direct comparison between ICMS and DES data. However, during conditioning tests between F5 and M1, in which the monkey was awake and engaged in a visuomotor grasping task (a setting more similar to ours), the percentage of inhibitory responses on intrinsic and extrinsic hand muscles increased significantly (Prabhu et al. 2009), underlying that the general background activity of the motor system, that is, awake versus anesthetized, may be a crucial variable that should be taken into account when comparing the present results with nonhuman primate data.
Translational Impact
From a clinical perspective, our study increases the specificity and resolution of the brain mapping technique, when associated with hand–object manipulation, in the identification and preservation of subsectors of the PreCG (vPM and ventrocaudal dPM) relevant for the control of dexterous hand movement. This finding is highly relevant for obtaining more extensive intraoperative mapping in patients undergoing brain surgery. The effect on the preservation of praxis abilities due to the implementation of the brain mapping technique with a custom-built HMt has been already discussed in a previous study (Rossi et al. 2018). Drawing together previous and present data obtained by means of DES coupled with the HMt (see also Viganò et al. 2019), the results suggest that within the PreCG there are other functionally relevant regions, beyond the “hand-knob” region, that are fundamental for appropriate motor execution of the hand. Two subsectors were identified with specific behavioral and electrophysiological patterns, a dPM region broadly contained within the well-described “hand-knob” region (Yousry et al. 1997), and a second vPM region also located within the PreCG. This ventral region could be reliably and consistently identified in all patients, and sites were anatomically conserved across patients, within the crown of a bulge of the PreCG extending anterior toward the limit of the inferior frontal sulcus. The dorsal “hand-knob” region is traditionally associated with hand motor function while ventral regions are regarded to be involved in muscle control of the mouth (Penfield and Boldrey 1937). Our study strongly indicates that hand movements are coded also within this second “hand-knob” region in a more ventral sector of the PreCG within vPM.
Strengths and Limitations of the Study
The intraoperative setting and brain mapping using DES enable a direct approach for studying the human cortex and provides interesting elements for studying the functional properties of stimulated areas. At present, during neurosurgical procedure for brain tumor removal, intraoperative DES is used to distinguish essential cortical–subcortical regions involved in a wide variety of neurological functions, including language (Tate et al. 2014; Ferpozzi et al. 2018), visuospatial (Thiebaut de Schotten et al. 2005), and cognitive abilities (Yordanova et al. 2017; Puglisi et al. 2018). One of the main limitations of this approach in humans is that the neurophysiological substrate of DES is not yet fully clarified (Borchers et al. 2011), making data interpretation difficult and therefore allowing us only to make further hypotheses rather than conclusions. Independent of the neurophysiological nature of DES, the strong causality between the stimulation, concomitant behavioral outcome, and post-surgical clinical outcome of patients has led DES to be considered the “gold standard for brain mapping” in systems neuroscience (Mandonnet et al. 2010). However, the correlation between DES and behavior leads to ambiguous results (Borchers et al. 2011). In order to overcome this limitation, in the present study we applied a quantitative approach to the analysis of the relationship between DES and the electrophysiological activity (EMG) of the hand muscles actively engaged and recorded during execution of a HMt. Moreover, although previous studies investigated hand and arm movement in a similar setting, none have specifically explored highly skilled movements involving hand–object interaction, rather more simple actions like repetitive and alternative flexion–extension of the upper limbs (Lüders et al. 1992; Mandonnet et al. 2016; Rech et al. 2016, 2019;). Although clinically relevant, these studies did not quantitatively analyze muscle activity during the task, nor used an object-related motor task, both essential elements for studying hand motor control within premotor networks in an ecologically goal-related context (Rizzolatti et al. 1988, Jeannerod et al. 1995).
Regarding the anatomical localization of the effective sites, we must however consider the limitations of the clinical approach. In the present study, the dorsomesial PM and the supplementary motor areas were not explored with DES during the HMt due to clinical constraints (the clinical procedure in patients enrolled did not require their exposure) preventing the acquisition of data on these areas significantly involved in control of hand movements, as suggested in both human and nonhuman studies (Grafton 2010; Nelissen et al. 2017; Howells et al. 2018). Moreover, DES cannot be delivered directly over the cortex buried in the brain sulci preventing the investigation of the cortex located in the precentral sulcus, which also encodes hand-related information.
Regarding discussion of intraoperative data in light of results obtained in the nonhuman primate using ICMS, DES cannot strictly be compared in spatial resolution with ICMS. DES is a cruder technique, involving a higher volume of cortex and different elements simultaneously. Moreover, DES acts on different elements with different effects, the latter depending on the state of the cortex (rest vs. task execution). It is indeed not proven that the effect of this paradigm of stimulation is net excitation, rather it can be the interruption of ongoing activity. Should this be the case, the effect must not be considered the product of excitation, but rather it could be explained as a lack of excitation due to a “transient lesion”. In addition to the effect on the stimulated area, DES may also interrupt the action of the distant network anatomically connected with the stimulated areas by acting on the incoming axons, thus the final effect could also be due to the lack of incoming information to the stimulated area. Both approaches (ICMS and DES) allow for exploration of the cortex, the limitation being the interpretation of data more accessible in nonhuman primate studies with respect to human studies in a clinical setting. The gap between ICMS and DES is a relevant limitation for interpreting our results in light of nonhuman primate data but may suggest a possible hypothesis that could inspire other studies. At present, DES is the only direct approach for testing brain function in humans that is comparable to ICMS, despite the described limitations.
Conclusions
In the present study, intraoperative DES was applied during awake surgery for tumor resection and used to investigate the premotor areas involved in shaping hand muscle activity during HMt execution. Stimulation with DES in this clinical context has the benefit of enabling the direct application of current with valuable spatial and temporal accuracy to different sectors of the premotor areas in ecological conditions, that is, while the patient performed a dedicated intraoperative HMt. The effect of DES was quantified using the activity of a sample of specific intrinsic and extrinsic hand muscles that were significantly activated during task execution. Overall, our results showed that both vPM and dPM are eloquent areas crucial in the control of muscles during HMt, as expected based on primate studies. Interestingly, vPM and dPM showed distinctive features; DES on dPM, by inducing an aCC-arrest pattern characterized by a general muscle recruitment, suggests a strong relationship with the corticomotoneuronal circuit promoting muscle contraction. Conversely, DES applied to vPM, by inducing both aCC arrest and clumsy patterns characterized by general muscle suppression, suggests a role in motor execution and sensorimotor integration needed for the refined regulation of muscle activity during hand–object interaction. Overall, the complementary action of vPM and dPM may balance the excitatory–inhibitory inputs to motor output to execute dexterous movement such as the HMt.
Supplementary Material
Funding
“Regione Lombardia” under the Eloquentstim Project (Por-Fesr 2014-2020)
Notes
The authors are deeply grateful to Dr Marco Grimaldi for neuroradiological examination. gabriella.cerri@unimi.it
References
- Ashburner J, Friston KJ. 2005. Unified segmentation. Neuroimage. 26(3):839–851. [DOI] [PubMed] [Google Scholar]
- Bello L, Acerbi F, Giussani C, Baratta P, Taccone P, Songa V. 2006. Intraoperative language localization in multilingual patients with gliomas. Neurosurgery. 59:115–125. [DOI] [PubMed] [Google Scholar]
- Bello L, Riva M, Fava E, Ferpozzi V, Castellano A, Raneri F, Pessina F, Bizzi A, Falini A, Cerri G. 2014. Tailoring neurophysiological strategies with clinical context enhances resection and safety and expands indications in gliomas involving motor pathways. Neuro Oncol. 16:1110–1128. [DOI] [PMC free article] [PubMed] [Google Scholar]
- Binkofski F, Buccino G, Posse S, Seitz RJ, Rizzolatti G, Freund H. 1999. A fronto-parietal circuit for object manipulation in man: evidence from an fMRI-study. Eur J Neurosci. 11:3276–3286. [DOI] [PubMed] [Google Scholar]
- Borra E, Gerbella M, Rozzi S, Luppino G. 2017. The macaque lateral grasping network: a neural substrate for generating purposeful hand actions. Neurosci Biobehav Rev. 75:65–90. [DOI] [PubMed] [Google Scholar]
- Boudrias MH, McPherson RL, Frost SB, Cheney PD. 2010. Output properties and organization of the forelimb representation of motor areas on the lateral aspect of the hemisphere in rhesus macaques. Cereb Cortex. 20:169–186. [DOI] [PMC free article] [PubMed] [Google Scholar]
- Brandi ML, Wohlschläger A, Sorg C, Hermsdörfer J. 2014. The neural correlates of planning and executing actual tool use. J Neurosci. 34(39):13183–13194. [DOI] [PMC free article] [PubMed] [Google Scholar]
- Borchers S, Himmelbach M, Logothetis N, Karnath HO. 2011. Direct electrical stimulation of human cortex—the gold standard for mapping brain functions. Nat Rev Neurosci. 13(1):63–70. [DOI] [PubMed] [Google Scholar]
- Cavina-Pratesi C, Connolly JD, Monaco S, Figley TD, Milner AD, Schenk T, Culham JC. 2018. Human neuroimaging reveals the subcomponents of grasping, reaching and pointing actions. Cortex. 98:128–148. [DOI] [PubMed] [Google Scholar]
- Cavina-Pratesi C, Monaco S, Fattori P, Galletti C, McAdam TD, Quinlan DJ, Goodale MA, Culham JC. 2010. Functional magnetic resonance imaging reveals the neural substrates of arm transport and grip formation in reach-to-grasp actions in humans. J Neurosci. 30(31):10306–10323. [DOI] [PMC free article] [PubMed] [Google Scholar]
- Cerri G, Shimazu H, Maier MA, Lemon RN. 2003. Facilitation from ventral premotor cortex of primary motor cortex outputs to macaque hand muscles. J Neurophysiol. 90(2):832–842. [DOI] [PubMed] [Google Scholar]
- Côté SL, Hamadjida A, Quessy S, Dancause N. 2017. Contrasting modulatory effects from the dorsal and ventral premotor cortex on primary motor cortex outputs. J Neurosci. 37(24):5960–5973. [DOI] [PMC free article] [PubMed] [Google Scholar]
- Davare M, Andres M, Cosnard G, Thonnard JL, Olivier E. 2006. Dissociating the role of ventral and dorsal premotor cortex in precision grasping. J Neurosci. 26(8):2260–2268. [DOI] [PMC free article] [PubMed] [Google Scholar]
- Davare M, Kraskov A, Rothwell JC, Lemon RN. 2011. Interactions between areas of the cortical grasping network. Curr Opin Neurobiol. 21:565–570. [DOI] [PMC free article] [PubMed] [Google Scholar]
- Davare M, Montague K, Olivier E, Rothwell JC, Lemon RN. 2009. Ventral premotor to primary motor cortical interactions during object-driven grasp in humans. Cortex. 45(9):1050–1057. [DOI] [PMC free article] [PubMed] [Google Scholar]
- Davare M, Rothwell JC, Lemon RN. 2010. Causal connectivity between the human anterior intraparietal area and premotor cortex during grasp. Curr Biol. 20:176–181. [DOI] [PMC free article] [PubMed] [Google Scholar]
- Duffau H, Capelle L, Sichez N, Denvil D, Lopes M, Sichez JP, Bitar A, Fohanno D. 2002. Intraoperative mapping of the subcortical language pathways using direct stimulations. An anatomo-functional study. Brain. 125(Pt 1:199–214. [DOI] [PubMed] [Google Scholar]
- Dum RP, Strick PL. 2005. Frontal lobe inputs to the digit representations of the motor areas on the lateral surface of the hemisphere. J Neurosci. 25:1375–1386. [DOI] [PMC free article] [PubMed] [Google Scholar]
- Ehrsson HH, Fagergren A, Jonsson T, Westling G, Johansson RS, Forssberg H. 2000. Cortical activity in precision- versus power-grip tasks: an fMRI study. 83(1):528–536. [DOI] [PubMed] [Google Scholar]
- Fan L, Li H, Zhuo J, Zhang Y, Wang J, Chen L, Yang Z, Chu C, Xie S, Laird AR et al. 2016. The human brainnetome atlas: a new brain atlas based on connectional architecture. Cereb Cortex. 26:3508–3526. [DOI] [PMC free article] [PubMed] [Google Scholar]
- Ferpozzi V, Fornia L, Montagna M, Siodambro C, Castellano A, Borroni P, Riva M, Rossi M, Pessina F, Bello L et al. 2018. Broca’s area as a pre-articulatory phonetic encoder: gating the motor program. Front Hum Neurosci. 12:64. [DOI] [PMC free article] [PubMed] [Google Scholar]
- Filevich E, Kühn S, Haggard P. 2012. Negative motor phenomena in cortical stimulation: implications for inhibitory control of human action. Cortex. 48(10):1251–1261. [DOI] [PubMed] [Google Scholar]
- Fischl B. 2012. FreeSurfer. Neuroimage. 62(2):774–781. [DOI] [PMC free article] [PubMed] [Google Scholar]
- Fogassi L, Gallese V, Buccino G, Craighero L, Fadiga L, Rizzolatti G. 2001. Cortical mechanism for the visual guidance of hand grasping movements in the monkey: a reversible inactivation study. Brain. 124(Pt 3:571–586. [DOI] [PubMed] [Google Scholar]
- Fogassi L, Raos V, Franchi G, Gallese V, Luppino G, Matelli M. 1999. Visual responses in the dorsal premotor area F2 of the macaque monkey. Exp Brain Res. 128(1–2):194–199. [DOI] [PubMed] [Google Scholar]
- Fornia L, Ferpozzi V, Montagna M, Rossi M, Riva M, Pessina F, Martinelli Boneschi F, Borroni P, Lemon RN, Bello L et al. 2016. Functional characterization of the left ventrolateral premotor cortex in humans: a direct electrophysiological approach. Cereb Cortex. 1–17. [DOI] [PubMed] [Google Scholar]
- Grafton ST. 2010. The cognitive neuroscience of prehension: recent developments. Exp Brain Res. 204:475–491. [DOI] [PMC free article] [PubMed] [Google Scholar]
- Hoshi E, Tanji J. 2007. Distinctions between dorsal and ventral premotor areas: anatomical connectivity and functional properties. Curr Opin Neurobiol. 17(2):234–242. [DOI] [PubMed] [Google Scholar]
- Howells H, Thiebaut de Schotten M, Dell'Acqua F, Beyh A, Zappalà G, Leslie A, Simmons A, Murphy DG, Catani M. 2018. Frontoparietal tracts linked to lateralized hand preference and manual specialization. Cereb Cortex. 28(7):2482–2494. [DOI] [PMC free article] [PubMed] [Google Scholar]
- Ishida H, Fornia L, Grandi LC, Umiltà MA, Gallese V. 2013. Somato-motor haptic processing in posterior inner perisylvian region (SII/pIC) of the macaque monkey. PLoS One. 8(7): e69931. [DOI] [PMC free article] [PubMed] [Google Scholar]
- Jeannerod M, Arbib MA, Rizzolatti G, Sakata H. 1995. Grasping objects: the cortical mechanisms of visuomotor transformation. Trends Neurosci. 18(7):314–320. [PubMed] [Google Scholar]
- Kleist K. 1934. Gehirnpathologie vornehmlich auf Grund der Kriegserfahrungen. Leipzig: Barth. [Google Scholar]
- Kraskov A, Prabhu G, Quallo MM, Lemon RN, Brochier T. 2011. Ventral premotor–motor cortex interactions in the macaque monkey during grasp: response of single neurons to intracortical microstimulation. J Neurosci. 31(24):8812–8821. [DOI] [PMC free article] [PubMed] [Google Scholar]
- Leo A, Handjaras G, Bianchi M, Marino H, Gabiccini M, Guidi A, Scilingo EP, Pietrini P, Bicchi A, Santello M et al. 2016. A synergy-based hand control is encoded in human motor cortical areas. Elife. 5: e13420. [DOI] [PMC free article] [PubMed] [Google Scholar]
- Lüders HO, Dinner DS, Morris HH, Wyllie E, Comair YG. 1995. Cortical electrical stimulation in humans. The negative motor areas. Adv Neurol. 67:115–129. [PubMed] [Google Scholar]
- Lüders HO, Lesser RP, Dinner DS, Morris HH, Wyllie E, Godoy J, Hahn JH. 1992. A negative motor response elicited by electrical stimulation of the human frontal cortex. Adv Neurol. 57:149–157. [PubMed] [Google Scholar]
- Mandonnet E, Sarubbo S, Duffau H. 2016. Proposal of an optimized strategy for intraoperative testing of speech and language during awake mapping. Neurosurg Rev. 40:29–35. [DOI] [PubMed] [Google Scholar]
- Mandonnet E, Winkler PA, Duffau H. 2010. Direct electrical stimulation as an input gate into brain functional networks: principles, advantages and limitations. Acta Neurochir (Wien). 152(2):185–193. [DOI] [PubMed] [Google Scholar]
- Maranesi M, Rodà F, Bonini L, Rozzi S, Ferrari PF, Fogassi L, Coudé G. 2012. Anatomo-functional organization of the ventral primary motor and premotor cortex in the macaque monkey. Eur J Neurosci. 36(10):3376–3387. [DOI] [PubMed] [Google Scholar]
- Marangon M, Kubiak A, Króliczak G. 2016. Haptically guided grasping. fMRI shows right-hemisphere parietal stimulus encoding, and bilateral dorso-ventral parietal gradients of object-and action-related processing during grasp execution. Front Hum Neurosci. 9:691. [DOI] [PMC free article] [PubMed] [Google Scholar]
- Mayka MA, Corcos DM, Leurgans SE, Vaillancourt DE. 2006. Three-dimensional locations and boundaries of motor and premotor cortices as defined by functional brain imaging: a meta-analysis. Neuroimage. 31(4):1453–1474. [DOI] [PMC free article] [PubMed] [Google Scholar]
- Nelissen K, Fiave PA, Vanduffel W. 2017. Decoding grasping movements from the parieto-frontal reaching circuit in the nonhuman primate. Cereb Cortex. 1–15. [DOI] [PubMed] [Google Scholar]
- Nelissen K, Vanduffel W. 2011. Grasping-related functional magnetic resonance imaging brain responses in the macaque monkey. J Neurosci. 31(22):8220–8229. [DOI] [PMC free article] [PubMed] [Google Scholar]
- Nelson-Wong E, Howarth S, Winter DA, Callaghan JP. 2009. Application of autocorrelation and cross-correlation analyses in human movement and rehabilitation research. J Orthop Sports Phys Ther. 39(4):287–295. [DOI] [PubMed] [Google Scholar]
- Penfield W, Boldrey E. 1937. Somatic motor and sensory representation in the cerebral cortex of man as studied by electrical stimulation. Brain. 60:389–443. [Google Scholar]
- Prabhu G, Shimazu H, Cerri G, Brochier T, Spinks RL, Maier MA, Lemon RN. 2009. Modulation of primary motor cortex outputs from ventral premotor cortex during visually guided grasp in the macaque monkey. J Physiol. 587:1057–1069. [DOI] [PMC free article] [PubMed] [Google Scholar]
- Preuss TM, Stepniewska I, Kaas JH. 1996. Movement representation in the dorsal and ventral premotor areas of owl monkeys: a microstimulation study. J Comp Neurol. 371(4):649–676. [DOI] [PubMed] [Google Scholar]
- Puglisi G, Sciortino T, Rossi M, Leonetti A, Fornia L, Conti Nibali M, Casarotti A, Pessina F, Riva M, Cerri G et al. 2018. Preserving executive functions in nondominant frontal lobe glioma surgery: an intraoperative tool. J Neurosurg. 28:1–7. [DOI] [PubMed] [Google Scholar]
- Quiñones-Hinojosa A, Ojemann SG, Sanai N, Dillon WP, Berger MS. 2003. Preoperative correlation of intraoperative cortical mapping with magnetic resonance imaging landmarks to predict localization of the Broca area. J Neurosurg. 99:311–318. [DOI] [PubMed] [Google Scholar]
- Raos V, Franchi G, Gallese V, Fogassi L. 2003. Somatotopic organization of the lateral part of area F2 (dorsal premotor cortex) of the macaque monkey. J Neurophysiol. 89(3):1503–1518. [DOI] [PubMed] [Google Scholar]
- Rech F, Herbet G, Gaudeau Y, Mézières S, Moureau JM, Moritz-Gasser S, Duffau H.. 2019. A probabilistic map of negative motor areas of the upper limb and face: a brain stimulation study. Brain. 142(4):952–965. [DOI] [PMC free article] [PubMed] [Google Scholar]
- Rech F, Herbet G, Moritz-Gasser S, Duffau H. 2016. Somatotopic organization of the white matter tracts underpinning motor control in humans: an electrical stimulation study. Brain Struct Funct. 221(7):3743–3753. [DOI] [PubMed] [Google Scholar]
- Riva M, Fava E, Gallucci M, Comi A, Casarotti A, Alfiero T, Raneri FA, Pessina F, Bello L. 2016. Monopolar high-frequency language mapping: can it help in the surgical management of gliomas? A comparative clinical study. J Neurosurg. 124(5):1479–1489. [DOI] [PubMed] [Google Scholar]
- Rizzolatti G, Camarda R, Fogassi L, Gentilucci M, Luppino G, Matelli M. 1988. Functional organization of inferior area 6 in the macaque monkey. Exp Brain Res. 71(3):491–507. [DOI] [PubMed] [Google Scholar]
- Rossi M, Fornia L, Puglisi G, Leonetti A, Zuccon G, Fava E, Milani D, Casarotti A, Riva M, Pessina F et al. 2018. Assessment of the praxis circuit in glioma surgery to reduce the incidence of postoperative and long-term apraxia: a new intraoperative test. J Neurosurg. 23:1–11. [DOI] [PubMed] [Google Scholar]
- Schmidlin E, Brochier T, Maier MA, Kirkwood PA, Lemon RN. 2008. Pronounced reduction of digit motor responses evoked from macaque ventral premotor cortex after reversible inactivation of the primary motor cortex hand area. J Neurosci. 28(22):5772–5783. [DOI] [PMC free article] [PubMed] [Google Scholar]
- Shimazu H, Maier MA, Cerri G, Kirkwood PA, Lemon RN. 2004. Macaque ventral premotor cortex exerts powerful facilitation of motor cortex outputs to upper limb motoneurons. J Neurosci. 24(5):1200–1211. [DOI] [PMC free article] [PubMed] [Google Scholar]
- Tadel F, Baillet S, Mosher JC, Pantazis D, Leahy RM. 2011. Brainstorm: a user-friendly application for MEG/EEG analysis. Comput Intell Neurosci. 2011: 879716. [DOI] [PMC free article] [PubMed] [Google Scholar]
- Takahashi K, Best MD, Huh N, Brown KA, Tobaa AA, Hatsopoulos NG. 2017. Encoding of both reaching and grasping kinematics in dorsal and ventral premotor cortices. J Neurosci. 37(7):1733–1746. [DOI] [PMC free article] [PubMed] [Google Scholar]
- Tate MC, Herbet G, Moritz-Gasser S, Tate JE, Duffau H. 2014. Probabilistic map of critical functional regions of the human cerebral cortex: Broca's area revisited. Brain. 137(Pt 10):2773–2782. [DOI] [PubMed] [Google Scholar]
- Thiebaut de Schotten M, Urbanski M, Duffau H, Volle E, Lévy R, Dubois B, Bartolomeo P. 2005. Direct evidence for a parietal-frontal pathway subserving spatial awareness in humans. Science. 309(5744):2226–2228. [DOI] [PubMed] [Google Scholar]
- Toni I, Rushworth MF, Passingham RE. 2001. Neural correlates of visuomotor associations. Exp Brain Res. 141:359–369. [DOI] [PubMed] [Google Scholar]
- Vesia M, Culham JC, Jegatheeswaran G, Isayama R, Le A, Davare M, Chen R. 2018. Functional interaction between human dorsal premotor cortex and the ipsilateral primary motor cortex for grasp plans: a dual-site TMS study. Neuroreport. 29:1355–1359. [DOI] [PubMed] [Google Scholar]
- Viganò L, Fornia L, Rossi M, Howells H, Leonetti A, Puglisi G, Conti Nibali M, Bellacicca A, Grimaldi M, Bello L et al. 2019. Anatomo-functional characterisation of the human "hand-knob": a direct electrophysiological study. Cortex. 113:239–254. [DOI] [PubMed] [Google Scholar]
- Yordanova YN, Duffau H, Herbet G. 2017. Neural pathways subserving face-based mentalizing. Brain Struct Funct. 222(7):3087–3105. [DOI] [PubMed] [Google Scholar]
- Yousry TA, Schmid UD, Alkadhi H, Schmidt D, Peraud A, Buettner A, Winkler P. 1997. Localization of the motor hand area to a knob on the precentral gyrus. A new landmark. Brain. 120 (Pt 1):141–157. [DOI] [PubMed] [Google Scholar]
Associated Data
This section collects any data citations, data availability statements, or supplementary materials included in this article.