ABSTRACT
Introduction
The vestibular system is essential for normal postural control and balance. Because of their proximity to the cochlea, the otolith organs are vulnerable to noise. We previously showed that head jerks that evoke vestibular nerve activity were no longer capable of inducing a response after noise overstimulation. The present study adds a greater range of jerk intensities to determine if the response was abolished or required more intense stimulation (threshold shift).
Materials and Methods
Vestibular short-latency evoked potential (VsEP) measurements were taken before noise exposure and compared to repeated measurements taken at specific time points for 28 days after noise exposure. Calretinin was used to identify changes in calyx-only afferents in the sacculus.
Results
Results showed that more intense jerk stimuli could generate a VsEP, although it was severely attenuated relative to prenoise values. When the VsEP was evaluated 4 weeks after noise exposure, partial recovery was observed.
Conclusion
These data suggest that noise overstimulation, such as can occur in the military, could introduce an increased risk of imbalance that should be evaluated before returning a subject to situations that require normal agility and motion. Moreover, although there is recovery with time, some dysfunction persists for extended periods.
INTRODUCTION
Military personnel are exposed to intense noise in multiple settings. Noise-induced hearing loss is the most common service-connected condition in Veterans; however, noise can also cause damage to the vestibular system resulting in postural instability and compromised balance, leading to increased fall risk. Indeed, evidence suggests that exposure to intense or repeated military and occupational noise sufficient to cause hearing loss may also cause vestibular dysfunction.1 Hearing loss and cochlear synaptopathy after intense noise exposure have been well characterized2; however, similar decrements in otolith organ afferent activity are not well characterized. The vestibular short-latency evoked potential (VsEP) is a measure of otolith organ function. This measure uses a range of jerk amplitudes to elicit far-field potential responses generated by irregular primary vestibular afferent discharges.3 We have demonstrated a loss of VsEP responses following a 6-hour exposure to intense (120 dB SPL) low-frequency (500–4,000 Hz) continuous noise, correlated with a significant loss of irregular afferent endings in the sacculus at 21 days post-noise exposure.4 This population of afferents is highly sensitive to linear forces and fires synchronously in responses to rapid changes in head position. Importantly, it is also known that irregularly discharging vestibular afferents are activated by loud sounds,5–7 suggesting that these afferents are likely to be susceptible to acoustic overexposure. Therefore, the VsEP is particularly well suited to the primary goal of this study—to measure noise-induced changes in the vestibular periphery, which may ultimately impact vestibular reflexes. Although balance and postural stability arise from the integration of vestibular, visual, and proprioceptive sensation, reduction in the integrity of any one of these senses may ultimately have a negative impact on balance and postural reflexes.
In a previous study, we showed that intense noise exposure (6 hours, 120 dB 1.5 kHz-centered 3 octave band noise [OBN]; ~ 500–4,000 Hz) caused a loss of calretinin immunoreactivity in striolar calyces in the upper bend of the sacculus as well as attenuation of VsEP responses.3 The jerk stimuli (0.2–1.2 g/ms) we previously used to demonstrate noise-induced vestibular loss were sufficient to produce a response in an intact animal, but there was a significant attenuation of the VsEP response 21 days after noise exposure.3 Other studies used jerk intensities as large as 4.6 g/ms in intact animals.3 More than 10 years ago, it was shown that jerk stimuli as large as 3.3 g/ms were able to elicit VsEP responses after noise exposure (113 dB broadband noise), suggesting that larger stimuli might elicit VsEP responses in lesioned animals.8
In the present study, we used a broader range of jerk stimuli in order to characterize the damaging effects of low-frequency noise and to address two questions: first, were the smaller head jerk stimuli used in previous work3 insufficient to elicit responses after noise exposure and second, is a 21-day recovery period sufficiently long to show a permanent loss of VsEP responses?
We hypothesize that larger stimuli might be able to elicit responses, but these responses will be significantly attenuated with respect to prenoise baseline values, suggesting that noise exposure irreparably damages peripheral vestibular signals from the sacculus. In addition to extending the range of jerk stimuli, we extended the postexposure recovery time in order to more confidently determine if the changes in VsEP responses were permanent.
MATERIALS AND METHODS
Animals
Long-Evans rats weighing 350–400 g (Charles River Laboratories, Wilmington, Massachusetts) at the start of the experiment were pair housed on a 12:12-h light-dark cycle (lights on at 8:00 a.m. and off at 8:00 p.m.) with ad libitum access to food and water. All procedures were carried out in accordance with National Institutes of Health guidelines and were approved by the Institutional Animal Care and Use Committee at the University of Michigan.
Surgical Preparation
Rats’ heads were positioned on a stereotaxic frame under isoflurane anesthesia, and a dorsal cranial midline incision was made to expose bregma and lambda. After the skull was leveled, two anchor screws were placed into the skull and a custom head bolt was bonded to the skull with C&B Metabond cement (Parkell Inc., Edgewood, New York). After the cement was set, the head bolt was fused to the anchor screws in the skull with dental acrylic and animals were allowed to recover for 10 days.
Noise Exposure Parameters
We delivered a continuous noise stimulus 1.5 kHz 3OBN designed to impact the uppermost 20% of the rat cochlea (or the lower end of the rat hearing frequency range). The noise was delivered at a maximum intensity of 120 dB SPL (Fig. 1). Unanesthetized, awake Long-Evans rats were placed into individual wire mesh cages and held in a ventilated sound exposure booth for 6 hours. The noise exposure booth was fitted with a 52-Hz resonance loudspeaker (Kappalite 3012H0; Eminence Speaker LLC, Eminence, Kentucky) and mounted in a custom-built 1.7 cubic foot sealed enclosure. The loudspeaker was driven by a simultaneous high-voltage/high-current magnetic field power amplifier (TFM-35; Carver Corporation, Lynnwood, Washington), which received an audio signal from an audio CD player (PDM320 Marantz America; LLC, Mahwah, New Jersey). The audio CD was created using Adobe Audition version 1.5 software. Sound level and spectrum were measured with a fast Fourier transform spectrum analyzer (SRS760; Stanford Research Systems, Sunnyvale, California), Bruel & Kjaer type 4136 microphone, type 2619 preamplifier, and type 2804 power supply (Bruel & Kjaer Sound and Vibration Measurement, Naerum, Denmark).
FIGURE 1.
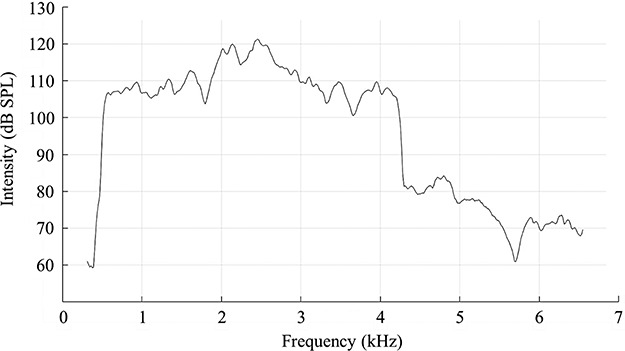
The Noise Exposure Frequency Spectrum Used in This Study Ranged From ~0.5 kHz to Just Over 4 kHz (~4.2 kHz). Peak intensities reached 121 dB SPL between 2 and 2.5 kHz. The remainder of the frequency spectrum fell above 106 dB SPL. A small harmonic can be seen at ~4.8 kHz, at an intensity of ~85 dB SPL.
Test Protocols
Auditory Brainstem Response
Auditory function was evaluated using auditory brainstem response (ABR; a far-field potential reflecting sound-induced VIIIth nerve activity) with tones delivered at 8, 4, and 1.5 kHz. ABRs were recorded in an electrically and acoustically shielded chamber (Acoustic Systems, Austin, Texas). Needle electrodes were placed at vertex (active), behind the test ear (reference), and in the hip (ground). Tucker Davis Technologies (TDT) System III hardware and SigGen/BioSig software (TDT, Alachua, Florida) were used to present the stimulus and record responses. Tones were delivered through an EC1 microphone (aluminum-shielded enclosure made in house), with the speculum placed just inside the tragus. Stimulus duration was 15 ms, 1 ms rise/fall times, presented at a rate of 10 per second. The sound stimulus was calibrated with an FFT spectrum analyzer (SRS760; Stanford Research Systems), connected to a microphone (4136, Bruel & Kjaer), with a preamplifier (2619, Bruel & Kjaer), and power supply (2804, Bruel & Kjaer). The microphone was coupled to the sound source speculum with a 0.5-cc tube, and the unattenuated level of each tone was measured. This measurement was used to create a TDT.nrm file that equalized the levels of all tones. The levels were then verified using the output generated by the BioSig ABR program. 1,024 responses were averaged for each stimulus level. Responses waveforms were collected for stimulus levels in 10 dB steps at higher stimulus levels, with additional 5 dB steps near threshold. Thresholds were interpolated between the lowest stimulus level, where a response was observed, and 5 dB lower, where no response was observed. Measurements were taken before and 28 days after noise exposure. Pre- and posttreatment ABR thresholds at each frequency were averaged and compared with one-tailed t test in MATLAB (MathWorks Inc., Natick, Massachusetts).
VsEP Protocol
The VsEP was measured according to previously established methods.3,4 Anesthetized Long-Evans rats were attached to a shaker using the implanted head pedestal so that motion of the shaker is dependably transmitted to the rat’s skull, as the head is linearly accelerated in the naso-occipital plane. Five jerk stimulus waveforms were developed based on previously established criteria.3 Each stimulus consisted of brief jerks (0.65–1.35 ms) ranging from ~ 0.3 to 5.5 g/ms (Fig. 2). With the exception of the smallest stimulus, these jerks were larger than those used in our prior study. Electrodes (stainless needles) placed subcutaneously at the vertex (noninverting), mastoid (reference), and hip (ground) recorded the VsEP. Stimuli were delivered as successive positive and negative jerks (~200 each) and averaged together to minimize electromagnetic artifacts from the shaker. Using custom software (MATLAB), the average is synchronized using the stimulus onset as a trigger. Figure 2 illustrates typical VsEP recordings obtained in our laboratory.
FIGURE 2.
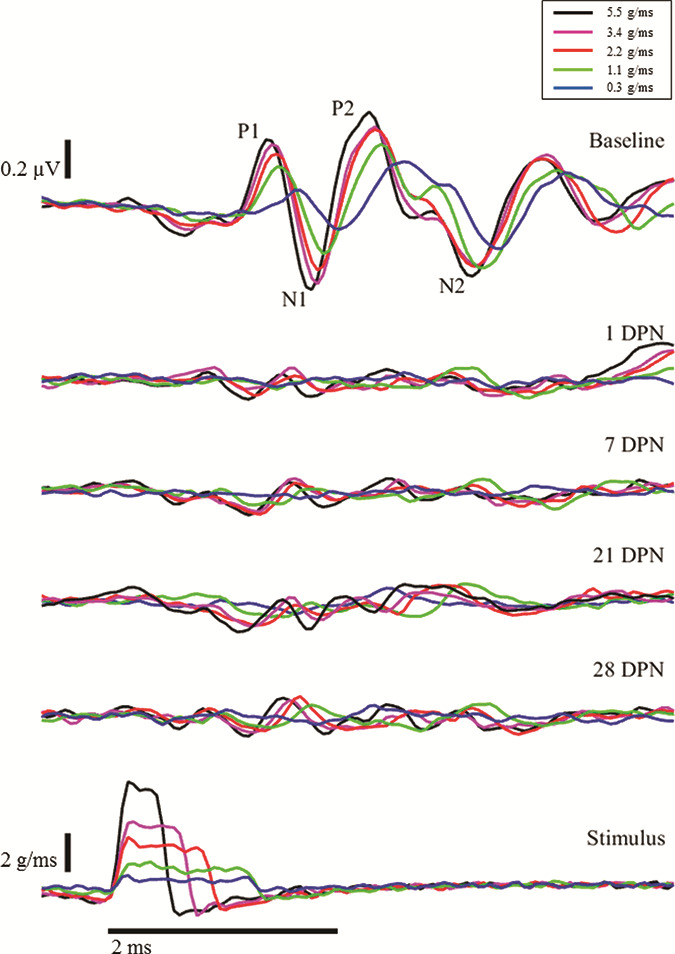
Loss and Progressive Recovery of VsEP Responses After Intense Noise Exposure. Lowermost traces: Five head jerk stimulus intensities were used to produce VsEP responses. Representative results for one animal are shown. Uppermost traces: Pre-exposure VsEPs. In an intact animal, two distinct waveforms are identified as P1N1 and P2N2. After exposure to intense noise, the VsEP is abolished at the lowest intensity and is severely attenuated at larger intensities immediately after noise exposure (1 DPN [day post-noise], 2nd row). Minimal improvement can be observed at 7 DPN (3rd row); however, the changes in postnoise VsEP amplitudes were not statistically significant (see Fig. 3). Scale bars represent 0.2 μV (VsEP), 2 g/ms (jerk stimuli), and 2 ms (time base).
Signals from the electrodes were amplified (200,000×), filtered (300–10,000 Hz), and digitized by a Cambridge Electronic Design data acquisition system (Cambridge Electronic Design, Cambridge, United Kingdom) at 20 kHz. An accelerometer, epoxied to the shaker arm, recorded the skull acceleration; its output was also digitized at 20 kHz. Data were transferred to a PC for storage and offline analysis with custom MATLAB scripts.
Tissue Analysis
Animal Termination and Tissue Fixation
Following a lethal dose of sodium pentobarbital, rats were fixed by vascular perfusion with 4% paraformaldehyde. Inner ears then received intrascalar fixation and were immersed in fixative overnight, washed with phosphate-buffered saline (PBS), and decalcified with 5% ethylenediaminetetraacetic acid for dissection.
Assessment of Noise-Induced Saccular Injury
Vestibular sensory epithelia were blocked and permeabilized with 5% normal donkey serum in a solution of 0.3% Triton X in 1× PBS (Jackson Labs 17000121) and then incubated in primary antibodies mouse anticalretinin (CR; 1:1000, Millipore MAB1568), chicken antineurofilament H (NF; 1:1,000, Millipore AB5539), and rabbit antimyosin 7a (Myo7a; 1:200, Proteus Bioscience Inc., Rab PAB 25–6790). CR is used to identify calyx-only afferents, whereas NF labels fibers projecting from the vestibular ganglion. Myo7a is used to label hair cell bodies. Tissue was washed three times in PBS and incubated with corresponding secondary antibodies, washed again with PBS, and mounted with ProLong Diamond mounting medium.
Imaging was carried out on a confocal microscope (Leica TCS SP8). First, a 20× z-series of the upper half of the sacculus containing the upper bend and upper portions of the long and short limbs was collected to determine regions of interest for 40× imaging. Next, 40× 1 μm steps were collected to produce two-dimensional z-stack-collapsed images along the upper bend of the sacculus using methods similar to those described previously.3 Images collected from noise-exposed and control sacculi were analyzed with MetaMorph software.
Images were qualitatively compared to determine the absence or presence of CR-positive calyces. After identification of the upper and lower limits in the z-plane of the area of interest within the sacculus, steps were selected if they contained calyces, defined here as CR-positive circles, greater than 5 μm in diameter that appeared below the cuticular plate of the sensory epithelium and did not colocalize with Myo7a but did colocalized with NF. Images were analyzed for the presence of CR-positive calyces and for the intensity of labeling.
RESULTS
Noise-Induced Hearing Loss
Hearing thresholds measured at baseline were compared to hearing thresholds at 28 days post-noise exposure with t test in MATLAB. At 8 kHz, the mean hearing level at baseline was 44.29 dB SPL and the mean hearing level at 28 days post-noise exposure was 73.57 dB SPL. At 8 kHz, the hearing threshold shift of 29.29 dB SPL was significant (P < 0.001; df = 6). At 4 kHz, the mean hearing level at baseline was 46.43 dB SPL and the mean hearing level at 28 days post-noise exposure was 78.57 dB SPL. At 4 kHz, the hearing threshold shift of 32.14 dB SPL was significant (P < 0.001; df = 6). At 1.5 kHz, the mean hearing level at baseline was 50.00 dB SPL and the mean hearing level at 28 days post-noise exposure was 72.86 dB SPL. At 1.5 kHz, the hearing threshold shift (22.86 dB SPL) was significant (P < 0.001; df = 6).
Noise-Induced Attenuation of VsEP Amplitude
The VsEP amplitude measurements were compared across prenoise baseline and postnoise survival days to test the hypothesis that intense noise exposure attenuates VsEP responses. The VsEP amplitudes were calculated by subtracting the negative peak (N1 or N2) of each waveform from the corresponding positive peak (P1 or P2, see Fig. 2). When waveform peaks could not be identified, they were arbitrarily defined to occur at the same latencies as the prenoise peaks. All values are presented in Table I. As can be seen in Table I and Figures 2 and 3, little or no statistically significant recovery occurred between days 1 and 28. Prenoise baseline responses were consistent across animals and produced P1N1 amplitudes ranging from ~ 0.16 μV in response to the weakest jerk stimuli (Fig. 2, 1st row, blue traces) to ~ 0.60 μV in response to the largest jerk stimuli (Fig. 2, 1st row, black traces). Similarly, P2N2 amplitudes ranged from ~ 0.51 μV in response to the smallest jerk stimuli (Fig. 2, 1st row, blue traces) to ~ 0.73 μV in response to the largest jerk stimuli (Fig. 2, 1st row, black traces). Notably, 1 day after noise exposure, both P1N1 and P2N2 waveforms were essentially absent in response to small head jerk stimuli and were severely attenuated in response to larger head jerk stimuli (see Fig. 2, second line of traces from the top). Use of the latency criteria to determine amplitude-yielded values less than 0.10 μV (Fig. 2 and Table I, 2nd row). Although some improvement in waveform amplitude occurred, there was no statistically significant change in these responses by postnoise exposure day 28 (Fig. 2, 5th row; Fig. 3; and Table I).
TABLE I.
Noise-Induced Shifts in VsEP Amplitude
| P1N1 Amplitude (μV) | P2N2 Amplitude (μV) | |||||
|---|---|---|---|---|---|---|
| Mean | 95% LCL | 95% UCL | Mean | 95% LCL | 95% UCL | |
| Baseline | ||||||
| 0.3 g/ms | 0.16 | 0.11 | 0.20 | 0.51 | 0.46 | 0.56 |
| 1.1 g/ms | 0.38 | 0.33 | 0.43 | 0.69 | 0.64 | 0.74 |
| 2.2 g/ms | 0.50 | 0.45 | 0.55 | 0.70 | 0.65 | 0.75 |
| 3.2 g/ms | 0.55 | 0.50 | 0.60 | 0.64 | 0.59 | 0.69 |
| 5.5 g/ms | 0.60 | 0.55 | 0.65 | 0.73 | 0.68 | 0.78 |
| Day 1 | ||||||
| 0.3 g/ms | −0.04 | −0.09 | 0.01 | 0.04 | −0.01 | 0.09 |
| 1.1 g/ms | 0.08 | 0.02 | 0.13 | 0.14 | 0.08 | 0.19 |
| 2.2 g/ms | 0.09 | 0.04 | 0.14 | 0.12 | 0.08 | 0.17 |
| 3.4 g/ms | 0.13 | 0.08 | 0.18 | 0.05 | 0.00 | 0.09 |
| 5.5 g/ms | 0.13 | 0.08 | 0.18 | 0.09 | 0.04 | 0.15 |
| Day 7 | ||||||
| 0.3 g/ms | 0.02 | −0.02 | 0.07 | 0.07 | 0.02 | 0.12 |
| 1.1 g/ms | 0.08 | 0.03 | 0.12 | 0.15 | 0.11 | 0.20 |
| 2.2 g/ms | 0.09 | 0.05 | 0.13 | 0.14 | 0.10 | 0.19 |
| 3.4 g/ms | 0.09 | 0.05 | 0.13 | 0.16 | 0.12 | 0.21 |
| 5.5 g/ms | 0.10 | 0.05 | 0.14 | 0.11 | 0.07 | 0.16 |
| Day 21 | ||||||
| 0.3 g/ms | 0.02 | −0.03 | 0.06 | 0.13 | 0.08 | 0.18 |
| 1.1 g/ms | 0.04 | −0.01 | 0.09 | 0.15 | 0.10 | 0.19 |
| 2.2 g/ms | 0.17 | 0.12 | 0.22 | 0.11 | 0.06 | 0.16 |
| 3.4 g/ms | 0.20 | 0.15 | 0.25 | 0.07 | 0.02 | 0.12 |
| 5.5 g/ms | 0.19 | 0.14 | 0.24 | 0.11 | 0.05 | 0.16 |
| Day 28 | ||||||
| 0.3 g/ms | 0.06 | 0.01 | 0.11 | 0.08 | 0.03 | 0.14 |
| 1.1 g/ms | 0.09 | 0.04 | 0.15 | 0.12 | 0.07 | 0.18 |
| 2.2 g/ms | 0.15 | 0.10 | 0.21 | 0.16 | 0.11 | 0.20 |
| 3.4 g/ms | 0.11 | 0.06 | 0.17 | 0.09 | 0.03 | 0.14 |
| 5.5 g/ms | 0.17 | 0.12 | 0.23 | 0.14 | 0.09 | 0.19 |
Averaged VsEPs (in μV) from two trials per day were averaged and compared. Mean values for noise-treated rats are shown with confidence intervals (95% LCL, 95% lower confidence limit; 95% UCL, 95% upper confidence limit).
FIGURE 3.
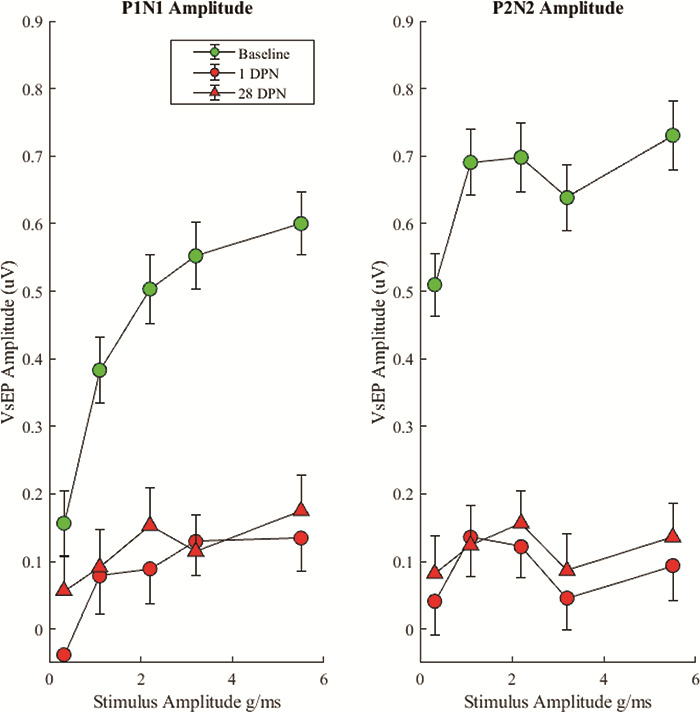
VsEP Average Waveform Amplitudes for P1N1 and P2N2 Waveforms With 95% Confidence Intervals. The VsEP was severely attenuated from baseline at 1 DPN and failed to significantly recover by 28 DPN.
Noise-Induced Latency Shift in Residual VsEP
VsEP latency measurements were compared across prenoise baseline values and postnoise exposure. Latency was calculated by subtracting the stimulus onset time from the time of the P1 peak. If there was no discernable P1 peak, then no latency value was calculated. Latency values are presented in Table II. Prenoise exposure baseline latencies are dependent on stimulus intensity with largest head jerks eliciting the smallest latencies. P1 latency ranged from ~ 1.5 ms with the smallest head jerks to 1.25 ms with the largest head jerk. One day after noise exposure, no waveforms were identifiable with the smallest head jerks, so these latencies were not calculable. All other waveforms showed a shift in latency. This latency shift appeared to recover with the largest (5.5 g/ms) jerk by 28 days post-noise exposure. All other latencies were still longer than baseline at 28 days post-noise exposure (Table II and Fig. 4).
TABLE II.
Noise-Induced Shifts in VsEP Latency
| Latency (ms) | |||||
|---|---|---|---|---|---|
| Baseline | Day 1 | Day 7 | Day 21 | Day 28 | |
| 0.3 g/ms | 1.47 | (no P1) | (no P1) | (no P1) | (no P1) |
| 1.1 g/ms | 1.33 | 1.73 | 1.59 | 1.54 | 1.56 |
| 2.2 g/ms | 1.29 | 1.40 | 1.40 | 1.42 | 1.44 |
| 3.4 g/ms | 1.28 | 1.38 | 1.34 | 1.38 | 1.35 |
| 5.5 g/ms | 1.25 | 1.30 | 1.34 | 1.27 | 1.27 |
Latencies were identified from averaged VsEP traces and compared across days. At baseline, latencies were inversely correlated with stimulus intensity. Where a waveform was identifiable at the first positive peak of the VsEP waveform (P1; 0.5 g/ms excluded), there was an increase in latency, which persisted at all intensities except for 6.0 g/ms, for up to 28 days after noise exposure.
FIGURE 4.
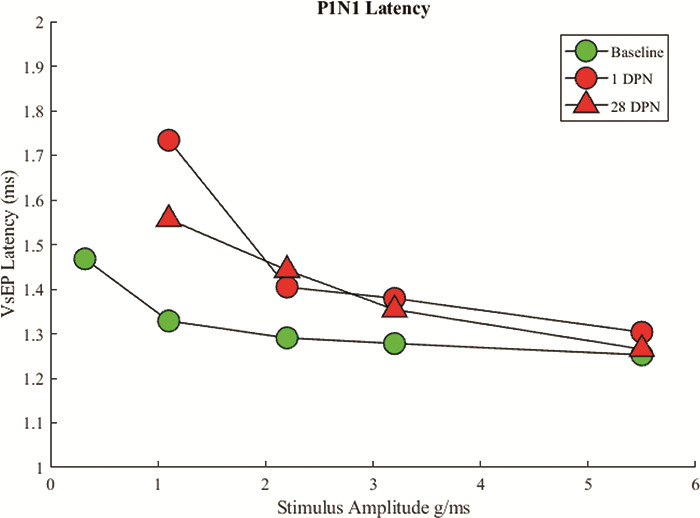
Average Latency for Onset of VsEP P1 Waveform. Comparison between baseline, 1 DPN, and 28 DPN. Values for 0.3 g/ms are excluded because no clear waveform could be identified following noise exposure.
Histopathological Changes in the Sacculus After Intense Noise Exposure
Following a single noise exposure, calyx-only afferents located in the striolar region of the sacculus and identified by CR and NF colabeling, in the absence of Myo7a colabeling, were fewer in number confirming our previous result.3 Remaining calyces were less intensely CR positive (Fig. 5). There was no significant hair cell loss at 28 days after noise exposure (data not shown).
FIGURE 5.
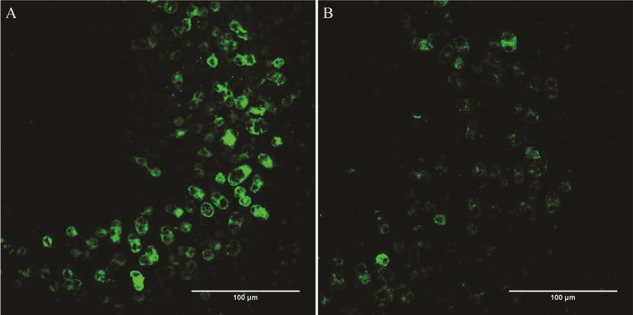
Qualitative Assessment of Calretinin-Positive Calyceal Endings in the Striolar Region of the Sacculus of Sham-Exposed (A) and Noise-Exposed (B) Rats. In addition to noting fewer calyceal endings overall in the noise (B) versus sham (A) tissue, the staining seen in the remaining calyces is less intense. Scale bars = 100 μm.
DISCUSSION
In this study, the VsEP was used as a tool to probe the effects of damaging noise insults in rats. An immediate threshold shift was induced by noise, such that 1 day post-noise VsEP responses were only generated by the largest jerk stimuli. However, the responses evoked by the larger stimuli were severely attenuated relative to prenoise exposure baseline values. Four weeks after noise exposure, there was only modest recovery of VsEP responses to large jerk stimuli and a persistent loss of response to the weakest jerk stimulus. These results are highly relevant to people exposed to noise overstimulation and then placed or remaining in situations where agility and responsive motion is required, as can occur in a military setting. It would be useful to have a protocol and assessment tool for human use to measure vestibular function after noise exposure, as is currently used to test auditory function before returning to active duty; however, no tool is available for human use at this time. It will be important to define the noise parameters that place vestibular function at greatest risk and to track vestibular threshold shifts for longer time periods to determine if there is capacity for recovery.
CONCLUSIONS
Uncovering the underlying cause(s) of the VsEP threshold shift will be an important step toward developing treatments that could prevent this change or provide a more rapid or complete recovery. The profound VsEP deficit following noise implies a loss of irregular afferent inflow from the vestibular periphery to the brainstem. Studies have shown that sounds presented to the ear can preferentially activate irregular otolithic afferents.6 These afferents preferentially synapse via a calyceal connection to a specific sensory cell type, type I hair cells located in the striolar region of the macular epithelia.9,10 Our previous study found that 4 weeks after noise exposure, there was a significant reduction in CR-immunolabeled striolar calyceal connections to type I hair cells. This change may represent an actual loss of calyceal endings, an interpretation consistent with the observed changes in VsEP amplitude in the previous and current studies. Alternatively, it may reflect down-regulation of CR in calyces, suggesting possible changes in channel properties that impair synaptic transmission across the calyx, an interpretation that would also be consistent with reduced afferent activity.
Military personnel who are exposed to battlefield-related noise are more likely to be affected by balance disorders characterized by postural instability, dizziness, and vertigo (eg, Scherer and Schubert, 2009). As the effects of noise exposures accumulate, synaptic organization may be disrupted, producing a degraded vestibular inflow. Overall vestibular function may appear intact; however, when rapid and intense accelerations occur, noise-disrupted synaptic connections may fail resulting in a higher risk of a fall. This can reduce quality of life, limit job opportunities, and increase potential for serious injury. These issues may then be compounded by the effects of aging, making problems acquired during service progressively worse in aging Veterans. Additional studies will be required to determine the exact mechanism by which noise impairs synaptic transmission across calyx endings in the noise-exposed sacculus and to measure deficits in dynamic motor performance after intense noise exposure. Through additional studies, it might be possible to develop therapies to prevent this loss or to induce functional reconnection.
ACKNOWLEDGMENTS
Chris Ellinger, Dwayne Vailliencourt
Presented as a poster at the 2018 Military Health System Research Symposium, August 2018, Kississimmee, FL; abstract # MHSRS-18-2047
The views expressed do not necessarily reflect the official policies of the Department of Health and Human Services, nor does mention of trade names, commercial practices, or organizations imply endorsement by the U.S. Government
FUNDING
This study was supported by grants from the Department of Veteran’s Affairs (1I01RX001986) and from the National Institute on Deafness and Other Communication Disorders (R21 DC015097, T32 DC000011, F32 DC017063–01).
REFERENCES
- 1. Akin FW, Murnane OD, Tampas JW, Clinard C, Byrd S, Kelly JK: The effect of noise exposure on the cervical evoked myogenic potential. Ear Hear2012; 33(4): 458–65. [DOI] [PubMed] [Google Scholar]
- 2. Liberman MC, Kujawa SG: Cochlear synaptopathy in acquired sensorineural hearing loss: manifestations and mechanisms. Hear Res2017; 349: 138–47. [DOI] [PMC free article] [PubMed] [Google Scholar]
- 3. Jones TA, Jones SM, Vijayakumar S, Brugeaud A, Bothwell M, Chabbert C: The adequate stimulus for mammalian linear vestibular evoked potentials (VsEPs). Hear Res2011; 280(1–2): 133–40. [DOI] [PMC free article] [PubMed] [Google Scholar]
- 4. Stewart CE, Kanicki AC, Altschuler RA, King WM: Vestibular short-latency evoked potential abolished by low-frequency noise exposure in rats. J Neurophysiol2018; 119: 662–7. [DOI] [PMC free article] [PubMed] [Google Scholar]
- 5. Rosengren SM, Colebatch JG: The contributions of vestibular evoked myogenic potentials and acoustic vestibular stimulation to our understanding of the vestibular system. Front Neurol2018; 9: 481. [DOI] [PMC free article] [PubMed] [Google Scholar]
- 6. Curthoys IS, MacDougall HG, Vidal PP, de Waele C: Sustained and transient vestibular systems: a physiological basis for interpreting vestibular function. Front Neurol2017; 8: 117. [DOI] [PMC free article] [PubMed] [Google Scholar]
- 7. Zhu H, Tang X, Wei W, Mustain W, Zu Y, Zhou W: Click-evoked responses in vestibular afferents in rats. J Neurophysiol2011; 106(2): 754–63. [DOI] [PubMed] [Google Scholar]
- 8. Sohmer H, Elidan J, Plotnik M, et al. : Effect of noise on the vestibular system—vestibular evoked potential studies in rats. Noise Health1999; 2: 41–52. [PubMed] [Google Scholar]
- 9. Eatock RA, Xue J: Kalluri: ion channels in mammalian vestibular afferents may set regularity of firing. J Exp Biol2008; 211(11): 1764–74. [DOI] [PMC free article] [PubMed] [Google Scholar]
- 10. Eatock RA, Songer JE: Vestibular hair cells and afferents: two channels for head motion signals. Annu Rev Neurosci2011; 34: 501–34. [DOI] [PubMed] [Google Scholar]
- 11. Scherer MR, Schubert MC: Traumatic brain injury and vestibular pathology as a comorbidity after blast exposure. Phys Ther2009; 89(9): 980–92. [DOI] [PubMed] [Google Scholar]


