

Summary:
Glioblastoma is a devastating form of brain cancer. To identify aspects of tumor heterogeneity that may illuminate drivers of tumor invasion, we created a glioblastoma tumor cell atlas with single-cell transcriptomics of cancer cells mapped onto a reference framework of the developing and adult human brain. We find that multiple GSC subtypes exist within a single tumor. Within these GSCs, we identify an invasive cell population similar to outer radial glia (oRG), a fetal cell type that expands the stem cell niche in normal human cortex. Using live time-lapse imaging of primary resected tumors, we discover that tumor derived oRG-like cells undergo characteristic mitotic somal translocation behavior previously only observed in human development, suggesting a reactivation of developmental programs. In addition, we show that PTPRZ1 mediates both mitotic somal translocation and glioblastoma tumor invasion. These data suggest that the presence of heterogeneous GSCs may underlie glioblastoma’s rapid progression and invasion.
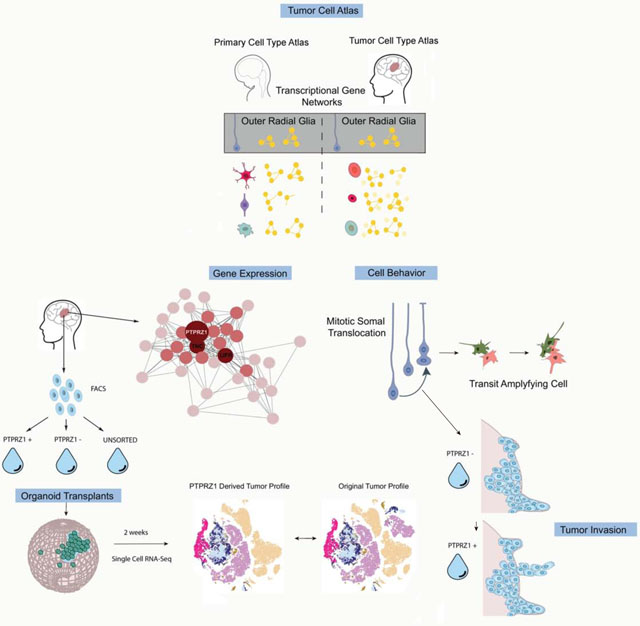
Graphical Abstract
eTOC
Kriegstein and colleagues use single-cell RNA-sequencing to create a tumor atlas of primary glioblastoma tumors. One interesting population they identify is the outer radial glia-like cell, a cell type found during normal cortical development that undergoes a characteristic mitotic somal translocation “jump-and-divide”. In tumors these cells may promote invasive behavior.
Introduction
Glioblastoma is an aggressive form of cancer and the most common primary malignant brain cancer in adults. The ability of glioblastoma cells to migrate through brain tissue to distant regions outside of the tumor bulk is thought to confer resistance to standard-of-care treatment by impeding complete surgical resection, and glioblastomas inevitably recur after surgery (Claes et al., 2007; Omuro and DeAngelis, 2013).
Similarities between cancer and development have long been appreciated. In the 19th century, pathologists noted morphological similarities between developing tissue and tumor tissue, leading to the ‘embryonic rest’ hypothesis (F., 1874) proposing that remnants of developmental tissue stay dormant in the adult and become reactivated in cancer. More recently, the concept that brain tumors are maintained by a stem cell-like population has become well established (Lathia et al., 2015; Prager et al., 2019). Populations of cells harboring a stemness signature have been identified in glioblastoma, and recent studies in astrocytomas and oligodendrogliomas suggest that lineage trajectories observed during normal astrocyte and oligodendrocyte development may be replicated by cells in these cancers (Azzarelli et al., 2018; Filbin et al., 2018; Venteicher et al., 2017; Weng et al., 2019). However, identifying the cell types that comprise the tumor bulk and the developmental trajectories underlying the generation of heterogeneous tumors like glioblastoma remains elusive (Lathia et al., 2015; Patel et al., 2014). Understanding the molecular drivers of intra-glioblastoma heterogeneity is essential to developing novel therapeutic strategies for patients, but technical limitations including suboptimal preclinical models, have delayed scientific and clinical progress.
Single-cell RNA sequencing (scRNA-seq) offers an opportunity to explore the cell type composition of primary glioblastoma resection specimens, thereby overcoming the technical barriers that have hampered understanding of intra-glioblastoma heterogeneity. Prior studies exploring glioblastoma at the single-cell level have primarily focused on immune and infiltrating cell populations (Darmanis et al., 2017; Muller et al., 2017), or have specifically targeted a subset of readily identifiable cell types (Filbin et al., 2018). A recent study of adult and pediatric glioblastoma used single-cell sequencing to characterize four primary cell states of a tumor, but did not characterize tumor cell types as they compare to primary developing or adult human brain (Neftel et al., 2019), leaving open the question of what cell types actually comprise the tumor bulk. Identifying the cell types that compose the tumor and how they arise from GSCs may illuminate activated gene signatures that could provide therapeutic targets to inhibit tumor growth.
Cortical organoids are a model of brain development that can be generated from human induced pluripotent stem cells and contain many of the major cell types present in the developing human brain (Di Lullo and Kriegstein, 2017). Organoids can promote development of cell heterogeneity and the establishment of a tumor niche, which may enable observations and screening approaches that are more difficult to recapitulate in mouse or two-dimensional models. Organoids have proved useful in the study of colorectal, pancreatic, and hematopoietic cancers, among others (Drost and Clevers, 2018). To model glioblastoma, oncogenic events have been introduced into cortical organoids in order to create glioblastoma-like cell types (Ogawa et al., 2018). Though similar to genetic mouse models of cancers, it remains unclear how closely the tumorigenic trajectories and resultant cell types resemble patient cancers. This is of particular concern in a highly heterogeneous tumor such as glioblastoma. Tumor samples have also been used to create organoid-like structures after tumor resection (Hubert et al., 2016). These structures maintain some aspects of glioblastoma cancer stem cell biology, but grow more slowly over time. Other groups have co-cultured or fused stable lines (Linkous et al., 2019) or spheroids (Cosset et al., 2019; da Silva et al., 2018) derived from glioblastoma samples with cortical organoids. This approach maintains longer-term cultures, and mimics aspects of cancer – normal cell interactions (Linkous et al., 2019), but may create a selection bias for tumor cells that are more likely to generate stable lines.
In this study, we merge several existing approaches by taking primary tumors directly from surgical resections, dissociating them, labeling them with an adenovirus, and subsequently transplanting them into cortical organoids derived from unmodified pluripotent stem cell lines. This label-based approach from freshly resected specimens results in a 100% engraftment rate, enables tracking of tumor cells, and allows for lineage tracing – like approaches when paired with single-cell sequencing before and after transplantation. This approach enabled us to observe that the diversity of cancer stem cells from the bulk tumor are well represented in our glioblastoma transplanted organoids, and that tumorigenic trajectories can be recapitulated from subsets of cancer stem cell-like populations.
Results
Single Cell Expression Profiling Reveals Widespread Stem Cell Marker Expression in Primary GBM
To examine cell composition within glioblastoma, we performed single-cell RNA sequencing of 32,877 cells from 11 tumors dissociated and processed directly after surgical tumor resections (see Tables S1–2, hosted on Mendeley Data at [doi: 10.17632/ky8vs4xhp8.1], Fig 1A). We compared the marker genes from clustering analysis to previously described transcriptional signatures of adult cortex (single-nuclei sequencing) (Velmeshev et al., 2019) or developing human brain (single-cell sequencing) (Nowakowski et al., 2017), and identified the closest primary, normal cell type for each glioblastoma cluster. With this analysis, we observed populations that have been previously observed in glioblastoma, including oligodendrocyte precursor cells (OPCs), microglia, tumor associated macrophages, and dividing tumor cells (Darmanis et al., 2017; Ozawa et al., 2014). In addition, we identified populations of neurons (including neurons co-expressing progenitor markers or cell cycle genes), radial glia, and glial cell populations with varying degrees of maturity (Fig 1B, SFig 1). Each of these progenitor, glial and neuronal populations had strong expression of identifiable marker genes that characterize the cell type, including GFAP, VIM, DCX, MKI67, and DLX1. However, unlike in primary samples, despite clear expression of these markers, we observed instances of co-expression of markers of progenitor identity and markers of post-mitotic neurons (Fig 1C). Although we refer to each of the annotated cell populations as a ‘type’, the permanence of cell identity and cell ‘state’ remains unknown in both the context of normal development and in tumorigenesis. Recent data suggests that many cell states have the potential to give rise to tumor cells characteristic of the remaining tumor (Neftel et al., 2019). In our analysis, each tumor contained a distinctive combination of cell type/state heterogeneity, with each tumor on average containing 11 transcriptional cancer cell types (Fig 1D, sFig 1B), and this observation was validated in the reanalysis of other recent single-cell RNA-sequencing datasets from primary glioblastoma tumors (SFig 1D). Using hematoxylin and eosin staining and immunolabeling we validated that despite heterogeneous tumor composition, all tumors had a mitotic index of 20% or higher and that the major cell populations identified were present in multiple tumors (SFig 2).
Figure 1. Single cell RNA-sequencing of primary glioblastoma tumors creates an atlas of tumor cell types.

a) Schematic of the workflow used to create the tumor atlas. Primary tumor resections are obtained and dissociated for single-cell sequencing. Clustering is performed and cell clusters are compared to annotated clusters from adult and developing human datasets. b) tSNE plots showing the clustering of primary tumor cells, colored by cluster, tumor of origin, and annotated cell type. c) Similarity matrix of clusters from primary glioblastoma analysis, correlated in the space of marker genes. Heatmap color indicates the Pearson’s correlation, and above the heatmap is the annotated cell type for each cluster. To the right of the heatmap are marker gene violin plots depicting the distribution of cell type genes across clusters. Some genes (such as GFAP) are broadly expressed but strongly enriched in clusters where the marker is associated with cell type (such as cluster 15, protoplasmic astrocyte-like cells). d) Composition of individual tumors is shown as a proportion of single-cells identified as each annotated cell type. Stacked barchart shows the proportional composition for each tumor, and graph to the right shows the number of cell types represented in each tumor.
Glioblastoma stem cells (GSCs) are accepted as the cell population that gives rise to glioblastoma tumors, ultimately resulting in patient morbidity and mortality. GSCs were first identified through isolation of CD133+ cells from primary tumors, demonstrating that these cells were necessary and sufficient to give rise to an ectopic tumor (Singh et al., 2004). A number of other markers of GSCs were later identified (Bao et al., 2008; Prager et al., 2019; Shiraki et al., 2017; Son et al., 2009), and markers of progenitor identity such as SOX2 and NES have been used to validate the stemness of these GSC populations. We sought to utilize our cell atlas of glioblastoma tumors to categorize the cell types that could be classified as GSCs based on the expression of commonly used GSC marker genes (see Table S3, hosted on Mendeley Data at [doi: 10.17632/ky8vs4xhp8.1]). Historically, protein expression of these stemness markers along with tumor initiation and serial transplantation have been used as a gold-standard for the identity of cancer stem cell populations, and in our data we observed that there was widespread expression of these markers at the RNA level. We noted that although distinct clusters of progenitor-like cell types including OPCs, radial glia, and intermediate progenitor cells were present in our analysis, progenitor markers such as SOX2 and NES were expressed broadly (Fig 2A). In contrast, PROM1 (CD133) and FUT4 (CD15), markers that have been shown to be sufficient to give rise to ectopic tumors, were very sparsely expressed, as has been previously described (Singh et al., 2004; Son et al., 2009). Surprisingly, we found that almost every known GSC marker gene could be found in a variety of cell types, with all 21 identified cell types expressing at least one marker associated with GSCs and stemness (Fig 2), though whether this transcriptional expression results in protein expression is unknown. Only VGF, a secreted neuropeptide that promotes survival and growth (Wang et al., 2018) was substantially restricted, with the majority of its expression in OPCs. Other markers were expressed across cell types, including classic stem cell markers such as MYC and CD44, L1CAM, a marker that co-opts perivascular interactions (Bao et al., 2008; Er et al., 2018), ITGA6, a regulator of GSC self-renewal identity (Lathia et al., 2010), CD109, a marker of perivascular GSCs (Shiraki et al., 2017), and POSTN, a GSC secreted protein that recruits tumor associated macrophages that promote tumorigenesis (Zhou et al., 2015) (Fig 2B). Although the expression of these transcripts does not guarantee that these proteins are expressed, they suggest that transcriptional programs associated with stemness are broadly expressed, and that activation of the stemness programs indicated by these GSC marker genes can occur in almost any cell type within the tumor.
Figure 2. Glioblastoma Cancer Stem Markers are Expressed in a Variety of Cell Types.

a) Feature plots of selected cancer stem markers. Some stemness genes (such as SOX2 and CD44) are widely expressed, while others (such as PROM1 and FUT4) mark rare populations. b) Heatmap of normalized gene counts for glioblastoma cancer stem cell (GSC) markers with blue corresponding to no expression and red corresponding to 2.5 or more normalized counts within the cell. Many markers are co-expressed, and GSC markers span a variety of cell types (annotated above the heatmap). c) Fraction of cells annotated by cell type (based upon clustering analysis) that comprise GSC marker positive cells (based upon individual cell annotations), organized first by marker. Using markers that have been characterized in primary glioblastoma tumors and exist in tumor bulk populations, GSCs were identified for each tumor (based upon individual cell annotations). The heterogeneous composition of cell types for GSCs within a single is shown on the right. d) The expression of the radial glia gene signature was evaluated to be significantly higher in GBM radial glia-like cells compared to all other cell types (**** = p <0.0001, Student’s two sided t-test). GBM radial glia-like cells were compared to the known molecular signatures of radial glia subtypes. The arrows pointing to outer radial glia (oRG), truncated radial glia (tRG) and ventricular radial glia (vRG) are weighted in their thickness proportional to the relative correlation of GBM developmental radial glia-like cells to each subtype. The graph shows a significantly higher correlation (**** = p <0.0001, Student’s two sided t-test using all 32,000 cell observations) to oRG than to the other subtypes. Network diagram depicts the oRG network (Pollen et al 2015) that is highly correlated (R > 0.30) in GBM single-cell data. Red highlights nodes with > 20 connections, and orange highlights those with greater than 10 connections. The majority of genes in the developmental oRG network are preserved in GBM.
Models of glioblastoma tumor maintenance suggest that each tumor has a population of GSCs that interact with the tumor and the microenvironment to continually give rise to more tumor cells. In order to identify the potential GSC cell types for each tumor, we defined GSCs within our scRNA-seq dataset as any cell (independent of the previous clustering) expressing either PROM1, FUT4 or L1CAM, in conjunction with SOX2, and not expressing TLR4 (which has been shown to be downregulated by GSCs in order to avoid immune surveillance) (Alvarado et al., 2017). To our surprise, we found that each tumor contained putative GSC subsets with at least two different stem cell types, based upon our glioblastoma cell type atlas, with one tumor (SF11232) containing seven types of putative GSCs (Fig 2C). Additionally, we found that the combination of expressed genes that have previously been associated with GSC stemness was unique for each individual tumor (Fig 2). Thus, the cell types that make up glioblastomas and GSCs can be found in various combinations across tumors, but the exact cocktail of stemness markers (as defined by previous studies) co-expressed within a GSC cell type is largely specific to a single individual tumor. We wondered if this stem cell heterogeneity could be inferred from previous studies, and so we explored the IVY glioblastoma repository (Puchalski et al., 2018). Using IVY annotations of cell type markers as well as gene expression and tissue staining data for cancer stem cell markers we observed that individual tumors co-expressed a number of glioblastoma cell type markers, including a variety of GSC markers such as PROM1, FUT4, L1CAM, and SOX2. These results from orthogonal datasets support our hypothesis that a diverse set of GSCs can be found within a single tumor (SFig 3), characterized by heterogeneous marker gene combinations. Our data suggest that stemness programs are heterogeneous, and that multiple cell types may recruit stemness programs, even within a single tumor.
A number of previous studies have shown the potential for a variety of cell types to be transformed into GSCs (Alcantara Llaguno et al., 2015; Friedmann-Morvinski et al., 2012; Weng et al., 2019; Zong et al., 2015). In our analysis, we saw representation of OPC, astrocyte, and neuronal cell types as GSCs. Additionally, radial glia emerged as a distinct cell type within our glioblastoma atlas that expressed GSC marker genes. Radial glia are stem cells of the developing human brain that give rise to neurons and glia in a temporal- and lineage-dependent fashion (Miyata et al., 2001; Noctor et al., 2001) However, radial glia are not believed to be present in the adult human brain (deAzevedo et al., 2003; Sorrells et al., 2018), and have not been identified in studies examining single-cell transcriptomes of the adult human brain (Hodge et al., 2019; Velmeshev et al., 2019) suggesting that developmental programs are reactivated in the tumors. Radial glia have been hypothesized to play a role in other cancers such as ependymoma (Taylor et al., 2005), and FABP7 (a marker of radial glia) expressing cells have been identified in glioblastoma (De Rosa et al., 2012; Mita et al., 2007). Several subtypes of, radial glia have recently been described in prenatal human development, including ventricular radial glia (vRG), outer radial glia (oRG) and truncated radial glia (tRG) based on distinct behavioral, morphological, and transcriptional signatures (Nowakowski et al., 2016; Pollen et al., 2015). We therefore explored the similarity of the developmental transcriptional signatures of radial glia subtypes to radial glia-like tumor cells. We found the highest correlation of radial glia-like tumor cell transcriptional profiles with the network signature of oRG cells. This network was strongly recapitulated in glioblastoma, with the same hub genes PTPRZ1, TNC, LIFR and strong connectivity between validated oRG markers including HOPX, FAM107A, and IL6ST (Fig 2D).
CNV analysis reveals heterogeneity in GSC contributions to individual tumors
In order to model which of the GSC cell types contributes the most to tumors, we sought to use our cell type designations to empirically reconstruct the lineage relationship between tumor cell populations. Copy number variation (CNV) is a hallmark of tumorigenic cells, and is less likely to be present in normal cells. To classify cells as belonging to malignant tumor or normal tissue, the presence/absence of somatic CNVs was assessed with CONICSmat (Muller et al., 2018). CNV analysis was performed on the five most deeply sequenced tumors based upon the transcriptomic data and was validated with exome sequencing and a variety of alternative methods, resulting in a low false-discovery rate (Methods, SFig 4A–D, see Table S4, hosted on Mendeley Data at [doi: 10.17632/ky8vs4xhp8.1]). This analysis highlighted that immune lineage cells and differentiated cells were enriched in the populations of normal cells within the tumors, while progenitor or immature populations such as radial glia, OPCs, and immature astrocytes were enriched in tumorous cells (Fig 3A, SFig 4E). Based upon this CNV analysis, we empirically reconstructed the most parsimonious lineage between CNV events. By exploring the cell types associated with these CNV calls, we find that our observations of heterogeneity are further supported; a variety of cell types can be observed at each arm of the phylogeny including dividing neurons, radial glia, and OPCs. Additionally, progenitor populations including oRG-like cells can be found along the lineage, suggesting that these progenitor populations may be maintaining their cell pool while producing additional tumor cell types. However, there is heterogeneity even at the base of these hierarchies, suggesting that higher resolution analysis may be required to further disentangle the lineage relationships between these presumptive source populations. These analyses indicate that radial glia-like glioblastoma cells, along with other progenitor populations, may serve as tumor propagating cells in glioblastoma.
Figure 3. Copy Number Analysis Demonstrates Enrichment of Progenitor Cell Types in Tumor Cells.

a) Quantification of the proportion of cells by tumor that are designated as normal or tumor cells based upon copy number variation (CNV) analysis. The fraction of all cells is shown by annotated cell type in a stack barchart. b) The fraction of radial glia-like cells annotated as normal or tumor cells, mean with standard deviation is shown. (* = p <0.05, Student’s two sided t-test). c) Reconstructions of the relationship between cells within the tumor are shown in phylogenies. Phylogenies were reconstructed based upon parsimony based upon the CNV calls. On each branch of the phylogeny, proportions of the annotated cell types for each CNV event are shown in horizontal stacked barcharts.
oRG-like cells exhibiting MST behavior are present in Glioblastoma
Outer radial glia cells were initially identified in the developing human brain based on their abundance within the outer subventricular zone and their unique characteristic mitotic behavior (Fietz et al., 2010; Hansen et al., 2010). They undergo mitotic somal translocation (MST), whereby the cell body translocates a distance of 50–100 μm prior to cytokinesis (Hansen et al., 2010; LaMonica et al., 2013). The function of MST is hypothesized to play an important role in establishing an expanded neural stem cell niche in the developing cortex of large brain mammals (Ostrem et al., 2017). There has long been interest in understanding the cell behavior of glioblastoma cells (Beadle et al., 2008; Suzuki et al., 2007). Because we observed oRG signatures in a subpopulation of glioblastoma cells, we used time-lapse imaging of dissociated cells from freshly resected tumors to explore glioblastoma cell behavior (Fig 4A). We observed characteristic MST cell behavior in a subset of cells from glioblastoma tumors (n=5 tumors from different individuals) (Fig 4B). Glioblastoma cells displayed similar somal translocation distances to their human developmental counterparts (Fig 4C), and like prenatal oRG cells, they predominantly divided with a cleavage plane at right angles to the primary process, although a higher number of vertical and oblique divisions were observed in glioblastoma cells than in normal development (Fig 4D–E). Post-staining of cells demonstrating MST behavior confirmed that these cells expressed markers of oRG cells (Fig S5A). This suggests that re-expression of the developmental oRG signature in GSCs is associated with dynamic cell behavior characteristic of prenatal oRG progenitor cells. During development, oRG cells give rise to a transit amplifying progenitor cell population (Hansen et al., 2010). To determine whether oRG-like glioblastoma cells could serve a similar role in glioblastoma, we used time-lapse imaging to trace the fate of daughter cells following oRG cell divisions. We indeed observed instances in which the daughter cells of oRG-like cell divisions also divided (Fig 4F), demonstrating that this cell type is capable of amplifying the proliferative cell population in vitro. This model of amplification and differentiation resembles a pattern previously described in gliomas, where cancer stem cells generate daughter cells that subsequently differentiate into tumor bulk cells (Qin et al., 2017). During brain development, MST behavior enables the stem cell niche to expand during neurogenesis and gliogenesis (Ostrem et al, 2014), and the oRG-like MST events may play a similar role in glioblastoma expansion and invasion.
Figure 4. GBM oRG-like cells undergo mitotic somal translocation and can give rise to proliferative daughter cells.

a) Schematic of the workflow used to set up live imaging analysis of primary tumor resections. Tumors were dissociated and plated on Matrigel, after which they were infected with an adenovirus to express GFP. Live imaging was performed over the course of 72 hours. b) Still images of videos of time-lapse imaging depict a glioblastoma cell undergoing a mitotic somal translocation (MST) as seen by the translocation of the soma followed by cytokinesis. c) Box plot (min to max) shows the somal translocation distance in the observed MSTs. These distances and distribution are comparable to normal development. Distances calculated from 5 biological replicates and 3–8 imaging positions each. d) Another two examples of MST with the cleavage plane annotated to depict the different angles observed. e) Pie chart shows the proportion of horizontal, vertical, and oblique cleavage angles observed (relative to primary fiber) in live imaging analysis. 43 observations were analyzed across 5 biological replicates. f) Still images from live imaging analysis that identifies MST divisions giving rise to proliferative daughter cells in the same frame.
To functionally characterize the oRG-like population in glioblastoma cells, we sought to enrich these cells using fluorescence-activated cell sorting (FACS). PTPRZ1 has been identified as a cell surface marker of the oRG cell population (Pollen et al., 2015) and is a hub gene in the conserved oRG gene network in glioblastoma. PTPRZ1-positive cells purified with FACS from fresh glioblastoma samples displayed MST behaviors, suggesting presence of the oRG-like cell population in the PTPRZ1-positive population (Fig 5A, SFig 5C). We next sought to characterize the role of PTPRZ1 positive oRG-like glioblastoma cells in tumor formation in the context of a human tissue microenvironment by transplanting PTPRZ1-sorted primary tumor cells into human cortical organoids (Linkous et al., 2019; Ogawa et al., 2018) (Fig 5B).
Figure 5. Sorting for PTPRZ1 positive cells enriches for oRG-like cells.

a) Still images of mitotic somal translocations in cells that were sorted for PTPRZ1 expression from a primary tumor. b) Schematic shows the process of transplantation. Primary tumor cells are sorted for PTPRZ1 positive populations or unsorted populations and are sampled with single-cell RNA sequencing and remaining cells are infected with adenovirus with GFP labeling. These cells are placed upon cortical organoids aged between week 6 and 10. After two weeks in the organoid, GFP positive cells are FACS sorted and analyzed with single-cell RNA sequencing. c) Immunofluorescence of organoid (SF12011 transplanted) show GFP positive cells, and a subset of these cells co-express PTPRZ1. d) Single-cell RNA sequencing was performed prior to transplant from 3 primary tumors and 2 weeks after cells were transplanted and FACS sorted from the organoid. Positive sort significantly enriches for radial glia-like cells ( * p-value < 0.05, Welch’s t-test). Stacked barchart depicts proportion of cells that correspond to broad cell types. Both PTPRZ1+ and PTPRZ1− cells give rise to a variety of cell types that do not exist in the original population including differentiated populations of neurons and astrocytes. e) For each subpopulation, the subset of cells that express GSC markers is shown. Each of the pre-transplanted populations express high levels of some of these markers, and the expression decreases after transplant, corresponding to the increase in differentiated cell populations in the post-transplanted tumors. f) Workflow of single-cell sequencing is shown. PTPRZ1 KD and a scrambled control were used to knockdown PTPRZ1 in both primary developing human cortex cells and and primary glioblastoma cells. The resulting gene expression identified a significant overlap between the PTPRZ1 downregulated genes. (* = p-value < 0.05). In both systems, the proportion of radial glia and other progenitor populations (OPC, IPC, dividing progenitors) was also decreased. These changes were accompanied by a significant down-regulation of several outer radial glia marker genes.
Transplanting PTPRZ1-labeled tumor cells into hPSC-derived cortical organoids reveals their tumorigenic and invasive properties
We first sorted primary tumor samples to isolate PTPRZ1 positive cells (SFig 5F) for subsequent scRNA-seq and transplantation experiments. By scRNA-seq, the initial PTPRZ1 positive sorted populations were not uniform for a single cell type, consistent with prior experiments that have noted appreciable heterogeneity in populations previously thought to be homogenous (Croote et al., 2018; Tasic et al., 2016) and our own observations of cell type heterogeneity among GSCs. However, the PTPRZ1 positive population was significantly enriched for radial glia-like cells compared to the PTPRZ1 negative population (Fig 5D). To perform organoid transplants, we first labeled PTPRZ1 positive, negative, and unsorted cell populations with a GFP-expressing adenovirus. We transplanted the cells into cortical organoids at stages of neurogenesis, similar to published transplantation experiments (Linkous et al., 2019; Ogawa et al., 2018). The tumor cells engrafted into the organoids, as visualized by GFP positive cell staining (Fig 5C). Clearing of the organoid and lightsheet imaging showed GFP positive cells migrating into the organoid (SFig 5G), suggesting our approach enabled tumor cells to invade and expand within the organoid. We isolated the GFP positive cells after two weeks (SFig 5H, see Table S5, hosted on Mendeley Data at [doi: 10.17632/ky8vs4xhp8.1]) and again performed scRNA-seq.
Two weeks after transplantation of PTPRZ1 positive, negative, and unsorted cells, the tumor cell populations were composed primarily of either neuronal or astrocytic cells. The similar cell composition of the initial unsorted tumor and the PTRPZ1 enriched post-transplant tumor demonstrated the ability of PTPRZ1 positive cells to give rise to the diversity of cell types originally present in the bulk tumor (Fig 5B–D). Interestingly, the cell types that were derived from the PTPRZ1 negative cells after organoid transplant also strongly resembled those that existed in the parallel unsorted populations, and also were highly correlated to the original glioblastoma clusters we identified from our sequencing of 11 patients (Fig SFig 5I,6A). We further investigated the similarity of the populations produced by PTPRZ1 positive and negative cells by exploring the expression of canonical GSC markers in each of these populations. We found that both PTPRZ1 positive and negative sorted cells expressed GSC markers, consistent with our earlier observation that heterogeneous cell types express stemness markers in glioblastoma (Fig 5E, SFig 6D). Interestingly, the expression of GSC markers uniformly decreased after transplant, which coincided with an increase in differentiated cell types within each population.
To better understand the molecular mechanism of PTPRZ1 signaling in glioblastoma tumor propagation, and to characterize how these cells differ from normal radial glia, we performed in vitro KD of PTRPZ1 in dissociated cell culture of primary developing cortex, primary tumor dissociated cell culture, and PDX dissociated cell culture. After infection with a scrambled hairpin control or shPTPRZ1 virus, cells were collected and single-cell RNA sequencing was performed. Each control/treatment pair was analyzed individually and the radial glia populations were isolated for further examination (Fig 5F). Across both primary and glioblastoma samples, a significant overlap of PTPRZ1 regulated genes was identified. Interestingly, in addition to the targeted PTRPZ1 KD, other key markers of radial glia identity were also down-regulated, suggesting that PTPRZ1 signaling is required in determination of radial glia identity, and this manifested in a decrease in the proportion of both radial glia and other progenitor populations within each cell population sampled. Additionally, genes that are specifically down-regulated in glioblastoma but not primary cells upon KD of PTPRZ1 relate to cholesterol and alcohol biosynthesis (Fig 5F, see Table S6, hosted on Mendeley Data at [doi: 10.17632/ky8vs4xhp8.1]) which have been linked to the progression of glioblastoma (Kambach et al., 2017; Villa et al., 2016).
PTPRZ1 and its ligand, PTN, have been identified as necessary for tumor invasion and viability (Fujikawa et al., 2017; Qin et al., 2017; Shi et al., 2017). We therefore sought to explore if expression of PTPRZ1 is required for the role of oRG-like cells in glioblastoma invasion using genetic and pharmacologic approaches. Previous work has linked PTPRZ1 and PTN with the Rho/Rho-kinase (ROCK) signaling pathway in glioblastoma. This was particularly intriguing to us as the ROCK pathway has been shown to be necessary for MST in human oRG cells during development (Ostrem et al., 2014), suggesting that PTPRZ1 may play a role in tumor invasion by oRG-like cells by mediating MST behavior. Given that the functional significance of key oRG markers such as PTPRZ1 remains unknown, and the role of MST has not been previously described in glioblastoma, we studied the role of PTPRZ1/PTN signaling in oRG cell behavior. We used shRNA mediated knock down of both PTPRZ1 and PTN in oRG cells during normal human development and monitored the impact on MST. We found that knockdown of PTPRZ1 or PTN significantly reduced the length of MST (Fig 6A, SFig 6C). We also observed that knockdown of PTPRZ1 similarly impacted the length of MST in the PDX line. In order to relate these findings to invasive behavior, we performed in vitro invasion assays on PDX tumor samples treated with either control scrambed shRNAs, or PTPRZ1 shRNAs or Rock inhibitor to inhibit MST. Both PTPRZ1 KD and Rock pathway inhibition significantly decreased the invasive behavior of the PDX tumors (Fig 6C, SFig 6D), suggesting a correlation between the inhibition of MST and a decrease in invasion.
Figure 6. PTPRZ1 Promotes MST driven invasiveness of glioblastoma.

a) Short hairpin induced knockdown of PTPRZ1 (**** = p < 0.0001, Student’s two-sided t-test) decrease the length of somal translocation length using 3 biological replicates and 4 technical replicates each in primary samples and in 4 technical replicates of the the DBTRGFL patient derived xenograft line. b) Invasion assays of patient derived xenograft (PDX) line DBTRGFL were performed with control (scrambled shRNA), PTPRZ1 knockdown (shRNA) and Rock Inhibition. Invasions were imaged every 24 hours, and Day 0 and Day 3 are shown. Quantification was performed by calculating how much of the gap was filled. Statistics were performed for both PTPRZ1 knockdown and Rock inhibition, and statistics are showing for Rock inhibition on top and PTPRZ1 knockdown below (* = p <0.05, ** p < 0.01, *** p < 0.001, Student’s two-sided t-test). c) Schematic of the mouse experiments performed in this study. PDX line DBTRGFL was historically generated by sampling primary tumor and propagating as a xenograft in the flank of a mouse. This tumor was then sorted for PTPRZ1 positive cells, and positive and unsorted cells of equal numbers were injected into the mouse. The cells were profiled using single-cell sequencing prior to injection, and resultant tumors were profiled after first emergence of tumor (F1) and after serial transplant (F2). d) Single-cell sequencing was performed on samples prior to and after tumor formation. Each cluster was correlated to the closest broad cell type, and is shown as a proportion of the whole. PTPRZ1+ cells give rise to cell types not present in the initial sort, including astrocytes and upper layer neurons. e) DBTRGFL is labeled with luciferase, and staining of surrounding brain tissue after serial transplantation identifies luciferase positive cells. A subset of these cells are also PTPRZ1 positive. Scale bar = 100 μM.
To explore the tumor propagation capabilities of PTPRZ1+ cells in vivo, we isolated PTRPZ1 positive cells from an existing luciferase labelled PDX line, DBTRGFL, and injected equal numbers of these cells intracranially into the brains of immunocompromised mice. When tumors grew from the PTPRZ1 positively selected cells, we additionally performed serial transplantation of the PTRPZ1 positive cell derived tumors, paired with single-cell RNA sequencing of each set of tumors (first tumor F1, second tumors F2) (SFig 6E–F). Comparing the PTRPZ1 positively sorted cells to the unsorted population prior to injection, we found an enrichment of radial glia-like cells. In both the F1 and F2 tumors we identified luciferase positive tumor cells consisting particularly of astrocytes and neurons that did not exist in the original sort (Fig 6D–E). Moreover, examination of the brain tissue surrounding the F2 tumor showed luciferase positive cells, a subset of which expressed PTRPZ1 (Fig 6F, SFig 6E), indicating that the F2 tumors invaded the surrounding brain tissue and that oRG-like PTPRZ1 positive cells can promote tumor invasion. Together, these results underscore the highly invasive nature of PTPRZ1-positive oRG-like glioblastoma cells, and support their ability to propagate the tumor as one of several GSC cell types.
Discussion
Here, we identify a heterogeneity of GSC cell types within and across glioblastomas. By comparison with data from the developing and adult human brain, we create an atlas of glioblastoma cell types and states, and find that although the exact composition of glioblastomas varies among individuals, similarities in cellular composition exist. Each tumor includes a set of proliferating, differentiated, and immune populations, and the exact mixture of these cell types creates a patient-specific cell type composition of each tumor. Orthogonal to this observation, we note that GSC marker genes are enriched in a variety of cell types. The prevailing models of cancer stem cell biology purport that a single stem cell can initiate and give rise to the remaining tumor, and that this cell emerges from a single cell of origin. To prove the existence of a cancer stem cell under this model, limited dilution studies are the gold standard. In our data, we observe patterns that suggest the cancer stem cells in glioblastoma are more complicated. First, we find evidence of multiple cell populations within a single tumor that have characteristics of cancer stem cell-like populations. Indeed, in our sorting of tumor populations, we find that two (or possibly more) distinct populations are capable of giving rise to heterogeneous tumor populations. Moreover, we note that glioblastomas have difficulty engrafting into mice and only a fraction of attempted primary tumors succeed in engrafting, but that these engraftment rates increase substantially in cortical organoids. These findings support a role for relevant tumor niches that are required for promoting tumor growth, and also for potential interactions between stem-cell like populations. In this model, terminology such as “cancer stem cell-like” may be more appropriate to suggest progenitor populations with unknown lineage relationships to one other, unknown potential to give rise to some or all other tumor populations, and that may require very narrow conditions to be conducive to proliferation.
In our data, the genes that make up each stemness program are very heterogeneous between tumors, indicating that stem cell markers can be expressed by multiple cell types in various combinations. However, these signatures are often very similar between cell types within a tumor. It is likely that the cell type composition of a tumor derives directly from the subtype of GSCs contained within each tumor. For example, the main cell type of GSC in tumor sample SF11215 is a dividing OPC cell, and more than 30% of the cell type composition of the tumor consists of oligodendrocytes, suggesting that the oligodendrocytes are generated from the dividing OPC-like GSCs. In other cases, the cell type composition of the tumor is much more heterogeneous, and corresponds to many more GSC cell types. We have identified a radial glia-like GSC that contributes to the cellular composition and invasive behavior of glioblastoma. During human cortical development, radial glia are the neural stem cells that generate the vast majority of neurons and glia and also give rise to transit amplifying populations. While radial glia are not believed to be present in the normal adult human brain, it is possible that there is a latent or quiescent population that can give rise to GSCs and glioblastoma, or that a neuronal or glial cell de-differentiates into a oRG-like cell to initiate tumors. It is possible the GSCs in glioblastoma, even when heterogeneous, arise from a single progenitor, or multiple lineages may coexist derived from one or more cells of origin. How diverse GSCs relate to one or more cell of origin will require additional study. While the exact relationship among GSCs in glioblastoma is unknown, the secretion of factors such as POSTN that promote a proliferative niche may support crosstalk between GSC populations. Identifying GSCs based on their gene signatures is a first step toward characterizing cellular vulnerabilities that might be exploited for therapeutic purposes. Our work also supports the necessity of personalized genomic medicine to tackle glioblastoma.
Culturing and expanding primary GSCs is essential to experimental characterization and manipulation of the cancer forming cell populations. However, performing xenografts and primary cell culture of glioblastoma has been challenging, largely because a vanishingly small proportion of primary tumors engraft into mice or adhere in vitro. These limitations are possibly related to difficulty replicating intracellular interactions that maintain glioblastoma tumor growth in vivo. Recent advances in the use of cortical organoid models as a substrate for glioblastoma expansion and culture may enable the study of primary tumors that often do not efficiently xenograft in mice. While the reasons for effective engraftment are not entirely understood, these models permit multiple primary tumors to be sorted, experimentally manipulated, and as we show here, lineage traced over time. Using this model, we were able to demonstrate the ability of oRG-like glioblastoma cells marked by PTPRZ1 to give rise to the differentiated cell types of the initial tumor. We additionally used this model to validate our observations from single-cell sequencing that multiple GSC populations can exist within a single tumor, as the fraction depleted of oRG-like cells also gave rise to cell types not present in the initial sorted population. The application of organoids as tumor allografts may enable further functional analysis of GSC populations as well as provide a platform for drug testing.
We describe a “reactivation” of the quintessential behavior of neural stem cells, mitotic somal translocation (MST) in glioblastoma. As this phenomenon is not known to occur outside of development, targeting MST may present a novel therapeutic strategy to cripple oRG-like GSCs. Additionally, characterizing this cell type highlights a potential link between previously described PTPRZ1 positive cell populations that mediate tumor invasion and the oRG-like cell. Although oRG-like cells represent one of a number of GSC cell types we observe in primary glioblastoma tumors, oRG-like MST behavior may account for some aspects of tumor invasion and the oRG-like cells may also give rise to the differentiated neuronal and astrocytic cell types in glioblastoma tumors. The MST behavior is intriguing in light of the aggressive invasive nature of glioblastoma tumors; even after surgical resection, glioblastomas frequently recur at sites distant to the initial tumor. Within the heterogeneity of GSCs in a single glioblastoma tumor, the spatial and temporal roles for each of the GSC populations may be specialized, or they may all act in parallel to promote tumorigenesis. While additional work is required to develop multifaceted targeted therapies that can inhibit tumor growth from each of these GSC cell types, creating an atlas of glioblastoma cell types and correlating them to known developmental trajectories can assist in identifying targets to pursue in glioblastoma drug discovery efforts.
STAR METHODS
LEAD CONTACT AND MATERIALS AVAILABILITY
Further information and requests for resources and reagents should be directed to and will be fulfilled by the Lead Contact, Arnold R. Kriegstein (Arnold.Kriegstein@ucsf.edu). This study did not generate new unique reagents.
EXPERIMENTAL MODEL AND SUBJECT DETAILS
Mouse Transplantation of GBM Cells
All mouse experiments were approved by and performed according to the guidelines of the Institutional Animal Care and Use Committee of the University of California, San Francisco. Dissociated GBM cells from fresh surgical resections were concentrated by centrifugation at 800 × g for 3 min. P2 CD1 mice recipients were anesthetized using hypothermia until pedal reflex disappeared and then were placed on a stereotaxic injection platform. Cells were loaded into a beveled glass micropipette (Drummond Scientific) positioned at 30° from vertical. A single injection was placed into the right cortex using the following coordinates (with regards to Lambda): anterior-posterior (A–P) −1.8mm; medial–lateral (M–L) 2mm. The depth was 0.7mm from the surface of the skin. After injection, transplanted animals were placed on a heating pad until warm and active and were returned to their mothers until weaning age (P21). For immunosuppressive therapy protocol, recipient neonatal mice were treated with anti-CD40L (MR-1), anti-LFA-1 (M17/4), and CTLA4-Ig (BioXCell) as previously described (Pearl et al., 2011). Anti-CD40L, anti LFA-1 and CTLA4-Ig were administered intraperitoneally at a dose of 20 mg/kg on days 0, 2, 4, and 6 after transplantation.
All procedures was carried out under sterile conditions. Mice was anesthetized by intraperitoneal injection of a mixture solution containing ketamine (100mg/kg) and xylazine (7.5mg/kg). The scalp was surgically prepared, and ~20 ul of 0.25% Bupivacaine was injected intra-cutaneous space of the scalp. A skin incision ~10 mm in length was made over the middle frontal to parietal bone. The surface of the skull was exposed, and a small hole was made using a 25-gauge needle 3 mm to the right of the bregma and just in front of the coronal suture. A 26-gauge needle attached to a Hamilton syringe was inserted into the skull hole. The needle was covered with a sleeve that limits the depth of 4mm injection. Cell suspensions in 3 ul was injected very slowly (~1 ul/minute) by free hand and then the needle was removed. The skull surface was swabbed with hydrogen peroxide before the hole is sealed with bone wax to prevent reflux. The scalp was closed with surgical staples. F1 tumors were continued for 69 days (until mouse morbidity) while F2 tumors were harvested after 16 days due to mouse morbidity.
Tumor Collection and Dissociation
We acquired fresh tumor tissue from patients undergoing surgical resection. De-identified samples were provided by the Neurosurgery Tissue Bank at the University of California San Francisco (UCSF). Sample use was approved by the Institutional Review Board (IRB# 11–06160) at UCSF and experiments conform to the principles set out in the WMA Declaration of Helsinki and the Department of Health and Human Services Belmont Report. All patients provided informed written consent. Tumors were collected in media consisting of Leibovitz’s L-15 medium, 4 mg/mL glucose, 100 u/mL Penicillin, 100 ug/mL Streptomycin. Tumor tissues were mechanically and enzymatically dissociated using a papain-based brain tumor dissociation kit (Worthington). The dissociated, single cells were resuspended in GNS (Neurocult NS-A (Stem Cell Tech.), 2 mM L-Glutamine, 100 U/mL Penicillin, 100 ug/mL Streptomycin, N2/B27 supplement (Invitrogen), sodium pyruvate).
Processing of adult human brain tissue for single nucleus RNA sequencing
De-identified snap-frozen post-mortem tissue samples from individuals with no medical history of neurological disease or pathological changes of brain tissue were obtained from the University of Maryland Brain Bank through the NIH NeuroBioBank. Cortical samples encompassing the entire span of the cortex were sectioned on a cryostat to collect 100 um sections for total RNA isolation and nuclei isolation. In case of presence of subcortical white matter, white matter was dissected out before collecting the sections to ensure obtaining all layers of the cortical grey matter. Total RNA from ~10 mg of collected tissue was isolated and used to perform RNA integrity analysis on the Agilent 2100 Bioanalyzer using RNA Pico Chip assay. Only samples with RNA integrity number (RIN) >6.5 were used to perform nuclei isolation and single-nucleus RNA sequencing (snRNA-seq).
iPSC and Organoid Culture
Human induced pluripotent stem cells (iPSCs) from the H28126 line (Pollen 2019) were maintained using feeder-free conditions on Matrigel (BD) coated dishes in mTESR (Stem Cell Technologies) medium. iPSCs were differentiated using a modified Sasai organoid protocol(Kadoshima et al., 2013) for directed telencephalon differentiation. iPSCs were dissociated using Accutase (Stem Cell Technologies) and aggregated into 96 well v-bottom low adhesion plates (S-bio). Aggregates were cultured in media containing Glasgow-MEM, 20% Knockout Serum Replacer, 0.1mM NEAA, 1mM sodium pyruvate, 0.1mM β-ME, 100 U/mL penicillin/streptomycin and supplemented with Rho Kinase, Wnt and TGFβ inhibitors, 20uM Y-27632 (Tocris), 3uM IWR1endo (Cayman), and 5uM SB431542, respectively (Tocris). Rho Kinase inhibitor was removed after 6 days. Media was changed every other day throughout differentiation. After 18 days, organoids were transferred into 6 well low-adhesion plates in media containing DMEM/F12 with 1x Glutamax, 1x N2, 1x Lipid Concentrate, and 100 U/mL penicillin/streptomycin. After five weeks, organoids are matured in media containing DMEM/F12 with Glutamax, 1x N2, 1x Lipid Concentrate, 100 U/mL penicillin/streptomycin, 10x Fetal Bovine Serum (Hyclone), 5ug/ml Heparin and 0.5% Growth factor-reduced Matrigel. After 10 weeks the concentration of Matrigel is increased to 1% and the media is additionally supplemented with 1x B-27.
METHOD DETAILS
Single-Cell RNA Sequencing
Single-cell RNA sequencing was performed either using the Fluidigm C1 system or the 10X Chromium v2 system. For the Fluidigm captures, single cell capture, cDNA synthesis and preamplification was performed as described before(Nowakowski et al., 2017; Pollen et al., 2015; Pollen et al., 2014) using Fluidigm C1 auto-prep system following manufacturer’s protocol. Library preparation was performed using the Illumina Nextera XT library preparation kit. Library concentration quantification was performed using Bioanalyzer (Agilent). Paired-end 100 bp sequencing was performed on the Illumina HiSeq 2500.
10X Chromium v2 captures were performed on dissociated tumor samples with a target capture of 2,000 cells per lane. For each tumor, 2 lanes were used for capture. Library prep was performed using manufacturer instructions (10X) and sequencing was performed on the Illumina HiSeq 2500. A larger number of cells was obtained with the 10X Chromium system, but the overall tumor composition between the two platforms was similar suggesting no additional bias was introduced.
Nuclei isolation and snRNA-seq on the 10X Genomics platform
Single-nuclei sequencing was only used for the reference adult dataset, as published in Velmeshev, et al. 40 mg of sectioned brain tissue was homogenized in 5 mL of RNAase-free lysis buffer (0.32M sucrose, 5 mM CaCl2, 3 mM MgAc2, 0.1 mM EDTA, 10 mM Tris-HCl, 1 mM DTT, 0.1% Triton X-100 in DEPC-treated water) using glass dounce homogenizer (Thomas Scientific, Cat # 3431D76) on ice(Matevossian and Akbarian, 2008). The homogenate was loaded into a 30 mL thick polycarbonate ultracentrifuge tube (Beckman Coulter, Cat # 355631). 9 mL of sucrose solution (1.8 M sucrose, 3 mM MgAc2, 1 mM DTT, 10 mM Tris-HCl in DEPC-treated water) was added to the bottom of the tube with the homogenate and centrifuged at 107,000 g for 2.5 hours at 4 C. Supernatant was aspirated, and nuclei pellet was incubated in 250 uL of DEPC-treated water-based PBS for 20 min on ice before resuspending the pellet. Nuclei were counted using a hemocytometer and diluted to 2,000 nuclei/uL before performing single-nuclei capture on the 10X Genomics Single-Cell 3’ system. Target capture of 3,000 nuclei per sample was used; the 10X capture and library preparation protocol was used without modification. Matched control and ASD samples were loaded on the same 10X chip to minimize potential batch effects. Single-nuclei libraries from individual samples were pulled and sequenced on the Illumina HiSeq 2500 machine, 1 sample per lane (average depth 80,000 reads/nucleus).
snRNA-seq data processing with 10X Genomics CellRanger software and data filtering
For library demultiplexing, fastq file generation and read alignment and UMI quantification, CellRanger software v 1.3.1 was used. CellRanger was used with default parameters, except for using pre-mRNA reference file (ENSEMBL GRCh38) to insure capturing intronic reads originating from pre-mRNA transcripts abundant in the nuclear fraction. Individual expression matrices containing numbers of Unique molecular identifiers (UMIs) per nucleus per gene were filtered to retain nuclei with at least 500 genes expressed and less than 5% of total UMIs originating from mitochondrial and ribosomal RNAs. Genes expressed in less than three nuclei were filtered out. Mitochondrial RNA genes were filtered out as well to exclude transcripts coming from outside the nucleus to avoid biases introduced by nuclei isolation and ultracentrifugation. Individual matrices were combined, UMIs were normalized to the total UMIs per nucleus and log transformed.
Dimensionality reduction, clustering and t-SNE visualization of snRNA-seq data
Filtered log-transformed UMI matrix was used to perform truncated singular value decomposition (SVD) with k=50. Scree plot was generated to select the number of significant principle components (PCs) by localizing the last PC before the explained variance reaches plateau. The significant PCs were used to calculate Jaccard distance-weighted nearest neighbor distances; number of nearest neighbors was assigned to root square of number of nuclei. Resulting graph with Jaccard-weighted edges was used to perform Louvain clustering. To visualize nuclei transcriptomic profiles in two-dimensional space, t-distributed stochastic neighbor embedding (t-SNE) was performed with the selected PCs and combined with cluster annotations.
Cell type annotation and quantification of regional and individual contribution to cell types for snRNA-seq dataset
Cell types were annotated based on expression of known marker genes visualized on the t-SNE plot and by performing unbiased gene marker analysis. For the latter, MAST(Finak et al., 2015) was used to perform differential gene expression analysis by comparing nuclei in each cluster to the rest of nuclei profiles. Genes with FDR<0.05 and log fold change of 1 or more were selected as cell type markers. To get insight into regional enrichment of cell types, numbers of nuclei in each cluster were normalized to the total number of nuclei captured from each region.
Alignment
For C1 captured cells: Trim Galore 3.7 was used to trim 20 bp of adaptor sequencing, and paired-end alignments were performed using HISAT2 to the human reference genome GRCh38. Counts for each cell were performed using subread-1.5.0 function featureCounts. After counts were obtained, normalization to counts per million was performed. For 10X captured cells: The cells were demultiplexed and aligned using the cellranger 2.0 software.
Quality control was performed to further ensure that only high quality single cell data was processed further, and cells with fewer than 1000 genes/cell were removed, as were cells with greater than 10% of their individual transcriptome represented in either mitochondrial or ribosomal transcripts. Only genes expressed in at least 30 cells were carried forward in the analysis.
Clustering Analysis and Correlations to Cell Types
Batch correction was performed to account for the C1 platform and the 10X platform, as well as any variation introduced by day-to-day variability. We used an approach adapted from a recently published method (Peng et al., 2019). For each batch (as defined by day of capture for 10X samples, all C1 samples were considered a single-batch), the counts were normalized to the largest number and then multiplied by the median number of counts per cell for the entire batch. During scaling (using the Seurat v2 ScaleData function, batch was regressed out in the space of variable genes only). Clustering was performed as previously described(Shekhar et al., 2016). Briefly, principal component analysis was performed on the full matrix of expressed genes and cells passing quality control. Significant principal components were used to score each cell and nearest neighbor analysis (RaNN package) was performed with k=10. Jaccard weighted distances were used as the input from this nearest neighbor analysis for Louvain clustering (igraph package) and tSNEs were generated in PCA space.
Correlations to cell type were generated using marker genes of known cell types from developing human single-cell RNA sequencing(Nowakowski et al., 2017) and adult single nuclei (Velmeshev et al, in press). For cluster level analyses, marker genes were assigned a “gene score” based upon the fold change multiplied by the enrichment of the marker in the relevant cluster compared to all others. Correlations were performed between marker sets based upon the intersection of marker genes between the two datasets being compared. Correlations between known clusters and GBM clusters > 0.4 were designated by the best correlation. Correlations between 0.2 and 0.4 were used as a guide, but cluster markers were carefully cross referenced with literature to ensure accurate cell type designations. For correlations < 0.2, literature searches on enriched genes were used to make cell type identifications.
For cell level analyses, each set of cluster markers for radial glia subtypes was defined as a network, and was used as an input for module eigengene calculation by using the loading of the first principal component in the space of this gene set. In heatmaps, positive and negative scores were used, whereas in histogram graphs only positive scores were used. The radial glia gene co-expression network was generated by calculating the correlation outer radial glia marker genes from previous studies(Pollen et al., 2015) in the space of a restricted matrix with only radial glia cells and glioblastoma (GBM) radial glia-like cells. Edges are defined by the strength of the correlation (Pearson’s R), nodes were colored by number of interactions as designated in the legend, and only genes with correlations of R > 0.30 were utilized in the network. Network representation was generated used Cytoscape 3.0(Shannon et al., 2003).
CNV Analysis of Tumor versus Normal Cells
The presence/absence of somatic copy-number alterations (CNVs) was assessed with CONICSmat (Muller et al., 2018). Briefly, raw counts in cells of each patient were scaled to log(CPM/100+1) and centered by the average expression in each cell. Next, the average expression of all genes on each chromosome was calculated in every cell, whereas only genes robustly (log(CPM/100+1))>1) expressed in more than 10 cells were considered. Subsequently, we fit a two-component Gaussian mixture model on the average expression values across all cells for each chromosome. We then only focused on chromosomes with a significant deviation of the log-likelihood of the model compared to a one-component model (likelihood ratio test<0.001) and a difference in Bayesian Inference Criterion (BIC) >300. These chromosomes were considered to have somatic CNVs. For each of these regions we used a cutoff on the posterior probability (pp>0.8) to infer the presence/absence of the respective CNV in a cell. Cell with CNV alterations were classified as tumor cells, whereas cells with statistical probabilities suggesting no CNV alterations were classified as normal cells. Cells that could not be clearly assigned to a genotype (e.g. 0.2<pp<0.8) remained unclassified. In addition, to validate the approach, a number of alternative strategies were used to verify the results. Scanning a 100bp window as has been previously reported (Tirosh et al., 2016) and then using the above strategy verified the calls matched. As in Muller et al (Muller et al., 2018), an empirical FDR was calculated for each sample. Moreover, the approach was validated using expression-based validation of gene signatures as has been previously described (Yuan et al., 2018). Additionally, the calls from CONICSmat were validated by exploring transcriptomic annotation as described in Petti et al (Petti et al., 2018). For three of the samples, the calls were also compared to those from exome sequencing and matched very well. Once CNV status was used to identify tumor and normal cells, these designations were intersected with cell type identity. CNV hierarchies were created using parsimonious explanations of the sequence of CNV events.
Viral Infection and Time-Lapse Imaging of Dissociated Tumor Cells
Dissociated tumor cells were seeded onto matrigel coated glass bottom wells. 24 hours after plating cells were infected with a CMV-adeno-GFP virus (Vector Biolabs) to allow for visualization of cell morphology and behavior. Cell were cultured at 37 °C, 5% CO2, 8% O2, and monitored for GFP and expression (~24–48 h). Cultured cells were then transferred to an inverted Leica TCS SP5 with an on-stage incubator (while streaming 5% CO2, 5% O2, balance N2 into the chamber), and imaged in both the GFP and transmitted light channels using a × 10 objective at 15–20 min intervals for up to 4. Movies were analyzed with Imaris.
Fluorescence Activated Cell Sorting Purification of PTPRZ1 positive Cells
Previously adherently cultured or fresh tumor sample GBM cells were dissociated into a single-cell suspension with Accutase (Innovative Cell Technologies) for 5 minutes or papain (Worthington) by digestion for one hour. In the context of plated cells, we noted that cell viability was higher with Accutase compared to papain, while with tissue it was higher with papain. After digestion, cell suspensions were triturated and placed on top of 4 ml 22% Percoll. Tubes with Percoll and cell suspension were spun at 500g for 10 minutes without break. The supernatant was discarded, and the cell pellet resuspended in HBSS with BSA and glucose (Crouch et al 2018). Cells were then incubated with pTpRZ1 antibody (Atlas Antibodies HPA015103), washed with HBSS with BSA dn glucose and then stained with AlexaFluor488 (Thermo Fisher Scientific). Cells were sorted using a Becton Dickinson FACSAria using 13 psi pressure and 100 μm nozzle aperture. All FACS gates were set using unlabeled cells. Additionally, secondary only controls were used to analyze levels of background staining. Data was analyzed post hoc for enrichment percentages with FlowJo software. Enriched cells were infected with CMV-adeno-GFP virus (Vector Biolabs) for visualization of cell morphology and behavior and either replated for live imaging or directly taken for single-cell sequencing and mouse or organoid transplantations.
Sequencing of PTPRZ1 Knockdown
Primary cells (GW 17, n = 2) and primary tumor samples (n = 2) were dissociated and infected with lentivirus either with a hairpin against PTPRZ1 mRNA or a control hairpin during plating. Cells were maintained in their normal media conditions for 1 week, after which cells were removed from the plate with trypsinization, dissociated into a single-cell suspension, and captured with 10X v2 single-cell as previously described.
Tyramide Signal Amplification for Immunohistochemistry of FFPE Tumor Samples
FFPE slides were deparaffinized through successive immersions in xylene and ethanol. Slides were immersed in xylene twice, 10 minutes each time. Slides were then immersed in 100% ethanol twice, 2 minutes each time, 95% ethanol once for 2 minutes, 70% ethanol once for 2 minutes, 50% ethanol once for 2 minutes. Slides were then rinsed in MilliQ water and immersed in PBS once for 10 minutes.
Invitrogen’s AlexaFluor 488 Tyramide SuperBoost kit (B40943) and AlexaFluor 594 Tyramide SuperBoost kit (B40942) were used according to the manufacturer’s protocol. Samples were blocked in the kit’s blocking buffer for 1hr. Samples were then incubated with primary antibodies diluted in the same blocking buffer overnight at 4C. Slides were rinsed in PBS. Samples were incubated in kit’s secondary antibodies for 1 hr at room temperature. Slides were rinsed in PBS. Samples were then incubated with the tyramide working solution prepared according to manufacturer recommendations for 10 minutes at room temperature. Stop solution prepared according to manufacturer recommendations was added to samples in order to quench tyramide reaction at the end of the 10 minute incubation period. Slides were rinsed in PBS. Samples were incubated in DAPI diluted 1:1000 in kit blocking buffer for 10 minutes. Slides were rinsed in PBS, then mounted in Southern Biotech Fluoromount (0100–01).
Primary antibodies used were Santa Cruz rabbit HOPX antibody (sc-30216) at 1:50, Santa Cruz mouse Ptprz1 antibody (sc-33664) at 1:200, Santa Cruz mouse Sox2 antibody (sc-365823) at 1:200, Cell Signaling Technologies rabbit PDGFR alpha antibody (3174S) at 1:200, Abcam rabbit Glast antibody (ab416) at 1:200, Millipore rabbit Olig2 antibody (AB9610) at 1:200, Abcam mouse Satb2 (ab51502) at 1:100, Agilent mouse CD31 (GA610) at 1:200, Dako mouse KI67 (M724001) at 1:200.
Cortical Slice Culture, Viral Infection, and Time-Lapse Imaging
As previously described (Hansen 2010), human fetal brain tissue was collected at San Francisco General Hospital, with previous patient consent and in strict observance of legal and institutional ethical regulations approved by the UCSF Committee on Human Research (institutional review board), and transported in artificial CSF (ACSF; 125 mm NaCl, 2.5 mm KCl, 1 mm MgCl2, 2 mm CaCl2, 1.25 mm NaH2PO4, 25 mm NaHCO3, 25 mm d-(+)-glucose, bubbled with 95%O2/5%CO2). Brain tissue was embedded in 3% low melting point agarose in ACSF and 250–300 μm coronal vibratome sections were generated. Sections were transferred on Millicell-CM slice culture inserts (Millipore) and cultured in cortical slice culture medium (66% BME, 25% Hanks, 5% FBS, 1% N-2, 1% penicillin, streptomycin and glutamine, all Invitrogen, and 0.66% d-(+)-glucose, Sigma-Aldrich). High titer gfp labeled lentivirus was applied directly to slices that were then cultured at 37°C, 5% CO2, 8% O2 for ~96 h. For time-lapse imaging, cultures were then transferred to an inverted Leica TCS SP5 with an on-stage incubator streaming 5% CO2, 5% O2, balance N2 into the chamber. Slices were imaged for GFP using a 10× objective at 15–30 min intervals for up to 3 d with repositioning of the z-stacks every ~12 h. Movies were analysed with Imaris.
Whole Organoid Immunostaining, clearing and imaging
Human brain organoids were fixed at room temperature for 45 minutes in 4% paraformaldehyde. After fixation, they were washed 3 times in PBS and stored at 4o C. For whole-organoid immunostaining and tissue clearing, the organoids were blocked for 24 hours at room temperature in PBS supplemented with 0.2% gelatin (VWR, 24350.262) and 0.5% Triton X-100 (Millipore Sigma, X100) (PBSGT). Samples were then incubated with Goat anti GFP primary antibody (1:100; Abcam, ab6658) for 7 days at 37 oC at 70 rpm in PBSGT + 1 mg/ml Saponin Quillaja sp (Sigma Aldrich, S4521) (PBSGTS). Following primary antibody incubation, samples were washed 6 times in pBsGT over the course of one day at room temperature. Secondary antibody staining was done using the Alexa Fluor 488 Donkey anti goat antibody (ThermoFisher Scientific, A-11055) and the nucleus was stained using Syto17 dye (ThermoFisher Scientific, S7579). Secondary and nuclear staining was performed at for 1 day at 37C at 70 rpm in PBSGTS. Samples were then washed 6 times in PBSGT over the course of one day at room temperature.
Whole organoid clearing was performed using ScaleCUBIC-1 solution as described in Suzaki et al., 2015(Susaki et al., 2015). Briefly, the solution contained: 25%wt Urea (Millipore Sigma, U5378), 25% wt N,N,N’,N’-Tetrakis(2-hydroxypropyl) ethylenediamine (Tokyo Chemical Industry, T0781) and 15% Triton X-100 dissolved in distilled water. Organoids were incubated in ScaleCUBIC-1 solution overnight at room temperature at 90 rpm.
Whole organoid imaging was performed using a custom made Lattice Light Sheet Microscope (UCSF Biological Imaging Development Center) and the images were deconvoluted using Richardson-Lucy algorithm. Images were then processed using Imaris 9.2 software (Bitplane).
QUANTIFICATION AND STATISTICAL ANALYSIS
Quantification of images was performed with Imaris or ImageJ as described in the relevant methods and figure legends. Statistical analysis for cluster markers and differential gene expression was performed using Seurat v2, the exact statistical test is indicated in the relevant legend and method. Remaining statistical comparisons were calculated using Prism v7 (GraphPad) and are indicated in the relevant figure legends.
DATA AND CODE AVAILABILITY
RNA sequencing data has been deposited at PRJNA579593 and SRP132816 (snRNA-seq). Supplemental tables detailing intermediate analyses have been deposited as Mendeley Data at [doi: 10.17632/ky8vs4xhp8.1].
Supplementary Material
Video 1 (Related to Figure 4). Live time-lapse video microscopy showing dissociated GBM cells labeled with adeno-cmv-gfp. The cell undergoing MST is circled and the direction of the MST shown with the arrow. Daughter cells are also represented on the video. Frames captured every 15 minutes.
Videos 2 & 3 (Related to Figure 4). Live time-lapse video microscopy showing dissociated GBM cells labeled with adeno-cmv-gfp. The cell undergoing MST is circled and the direction of the MST shown with the arrow. The cleavage angle of MST is represented by a line. Daughter cells are also represented on the video. Frames captured every 15 minutes.
Video 4 (Related to Figure 4). Live time-lapse video microscopy showing dissociated GBM cells labeled with adeno-cmv-gfp. The cell undergoing MST is circled in pink and the direction of the MST shown with the arrow. Daughter cells undergoing division are circled in orange and yellow and their respective daughter cells are represented on the video. Frames captured every 15 minutes.
Video 5 (Related to Figure 5). Live time-lapse video microscopy showing in vitro cultured GBM cells enriched for PTPRZ1 by FACS. Cells are labeled with adeno-cmv-gfp. The cell undergoing MST is circled and the direction of the MST shown with the arrow. Daughter cells are represented on the video. Frames captured every 3 minutes.
Video 6 (Related to Figure 5). Microscopy image derived from lightsheet imaging of a cleared cortical organoid being invaded by PDX line DBTRGFL tumor cells labelled with GFP.
KEY RESOURCES TABLE
| REAGENT or RESOURCE | SOURCE | IDENTIFIER |
|---|---|---|
| Antibodies | ||
| Goat anti-GFP | Abcam | ab6658, RRID: AB_305631 |
| Rabbit anti-HOPX | Santa Cruz Biotechnology | sc-30216, RRID: AB_2120833 |
| Mouse anti-PTPRZ1 | Santa Cruz Biotechnology | sc-33664, RRID: AB_2253176 |
| Mouse anti-SOX2 | Santa Cruz Biotechnology | sc-365823, RRID: AB_10842165 |
| Rabbit anti-PTPRZ1 | Atlas Antibodies | HPA015103, RRID: AB_1855946 |
| Rabbit anti-PDGFRA | Cell Signaling | 3174S, RRID: AB_2162345 |
| Rabbit anti-GLAST | Abcam | ab416, RRID: AB_304334 |
| Rabbit anti-OLIG2 | Millipore | AB9610, RRID: AB_570666 |
| Mouse anti-SATB2 | Abcam | ab51502: AB_882445 |
| Mouse anti-CD31 | Agilent | GA610, RRID: AB_2114471 |
| Mouse anti-Ki67 | Dako | M724001, RRID: AB_2631211 |
| Bacterial and Virus Strains | ||
| CMV-adeno-GFP virus | Vector Biolabs | 1060 |
| Chemicals, Peptides, and Recombinant Proteins | ||
| BDNF, 20ng/mL | Millipore Sigma | SRP3014-10 |
| 3-Benzyl-5-((2-nitrophenoxy)methyl)-dihydrofuran-2(3H)-one (3BDO) (Peng et al., 2014), 60uM | Millipore Sigma | SML1687 |
| Rock Inhibitor Y-27632 | Tocris | 1254 |
| IWR-1-endo | Cayman Chemical | 13659 |
| SB431542 | Tocris | 1614 |
| Critical Commercial Assays | ||
| 10X Chromium v2 | 10X Genomics | PN-120237 |
| Deposited Data | ||
| Single-Cell RNA-sequencing | PRJNA579593 | N/A |
| Experimental Models: Cell Lines | ||
| DBTRGFL PDX Line | Brain Tumor Research Center UCSF | N/A |
| Experimental Models: Organisms/Strains | ||
| CD1 Mice | Jackson Laboratory | 003814 |
| Oligonucleotides | ||
| PTPRZ1 qPCR primer F1 | ATC CTG GCA GCA GGT GAC TCA G | N/A |
| PTPRZ1 qPCR primer R1 | CCT CAG CTA GAC CAA TAC GAG AC | N/A |
| Software and Algorithms | ||
| Seurat v2 | Publicly Available | N/A |
Highlights.
Glioblastoma tumors have heterogenous cell and cancer stem cell composition
Glioblastomas re-activate a developmental cell type, outer radial glia
These outer radial glia undergo mitotic somal translocation mediated by PTPRZ1
Outer radial glia in glioblastoma promote tumor invasion through PTPRZ1
Acknowledgments
The authors thank A Shai, K Chiu, K Shekhar, S Wang, W Walantus, M Haeussler, D Shin, M Fogarty, R Santos and members of the A.R.K laboratory for providing resources, technical help and helpful discussions. Glioblastoma biospecimens were provided by the UCSF Neurosurgery Tissue Bank via the UCSF Brain Tumor SPORE Biorepository NIH/NCI P50CA097257 (J Phillips). Mouse experiments were performed using patient derived xenografts from the UCSF Brain Tumor Center Preclinical Therapeutics Core. We thank NIH NeuroBioBank, University of Maryland School of Medicine Brain and Tissue Bank and especially Alexandra LeFevre for help with obtaining tissue samples and sample information. Flow cytometry core at UCSF supported by DRC Center Grant NIH P30 DK063720. EEC was supported by the Pediatric Scientist Development Program, 5K12HD000850-34. Data can be browsed at http://gbm.cells.ucsc.edu. Mouse drawing in Figure 4 was obtained through a Creative Commons v3.0 license, Seans Potato Business [CC BY-SA 3.0 (https://creativecommons.org/licenses/by-sa/3.0)], from Wikimedia Commons. This study was supported by NIH award R35NS097305 to A.R.K., R01NS091544 to D.A.L., and F32NS103266 to A.B. snRNA-seq experimental work has been supported by Simons Foundation Pilot Award 515488 awarded to A.R.K. D.V. was supported by Quantitative Biosciences Institute’s BOLD & BASIC Fellowship.
Footnotes
Publisher's Disclaimer: This is a PDF file of an unedited manuscript that has been accepted for publication. As a service to our customers we are providing this early version of the manuscript. The manuscript will undergo copyediting, typesetting, and review of the resulting proof before it is published in its final form. Please note that during the production process errors may be discovered which could affect the content, and all legal disclaimers that apply to the journal pertain.
Declaration of Interests
The authors declare no competing interests.
REFERENCES
- Alcantara Llaguno SR, Wang Z, Sun D, Chen J, Xu J, Kim E, Hatanpaa KJ, Raisanen JM, Burns DK, Johnson JE, et al. (2015). Adult Lineage-Restricted CNS Progenitors Specify Distinct Glioblastoma Subtypes. Cancer cell 28, 429–440. [DOI] [PMC free article] [PubMed] [Google Scholar]
- Alvarado AG, Thiagarajan PS, Mulkearns-Hubert EE, Silver DJ, Hale JS, Alban TJ, Turaga SM, Jarrar A, Reizes O, Longworth MS, et al. (2017). Glioblastoma Cancer Stem Cells Evade Innate Immune Suppression of Self-Renewal through Reduced TLR4 Expression. Cell Stem Cell 20, 450–461 e454. [DOI] [PMC free article] [PubMed] [Google Scholar]
- Azzarelli R, Simons BD, and Philpott A (2018). The developmental origin of brain tumours: a cellular and molecular framework. Development 145. [DOI] [PMC free article] [PubMed] [Google Scholar]
- Bao S, Wu Q, Li Z, Sathornsumetee S, Wang H, McLendon RE, Hjelmeland AB, and Rich JN (2008). Targeting cancer stem cells through L1CAM suppresses glioma growth. Cancer Res 68, 6043–6048. [DOI] [PMC free article] [PubMed] [Google Scholar]
- Beadle C, Assanah MC, Monzo P, Vallee R, Rosenfeld SS, and Canoll P (2008). The role of myosin II in glioma invasion of the brain. Molecular biology of the cell 19, 3357–3368. [DOI] [PMC free article] [PubMed] [Google Scholar]
- Claes A, Idema AJ, and Wesseling P (2007). Diffuse glioma growth: a guerilla war. Acta neuropathologica 114, 443–458. [DOI] [PMC free article] [PubMed] [Google Scholar]
- Cosset E, Locatelli M, Marteyn A, Lescuyer P, Dall Antonia F, Mor FM, Preynat-Seauve O, Stoppini L, and Tieng V (2019). Human Neural Organoids for Studying Brain Cancer and Neurodegenerative Diseases. Journal of visualized experiments : JoVE. [DOI] [PubMed] [Google Scholar]
- Croote D, Darmanis S, Nadeau KC, and Quake SR (2018). High-affinity allergen-specific human antibodies cloned from single IgE B cell transcriptomes. Science 362, 1306–1309. [DOI] [PubMed] [Google Scholar]
- da Silva B, Mathew RK, Polson ES, Williams J, and Wurdak H (2018). Spontaneous Glioblastoma Spheroid Infiltration of Early-Stage Cerebral Organoids Models Brain Tumor Invasion. SLAS Discov 23, 862–868. [DOI] [PubMed] [Google Scholar]
- Darmanis S, Sloan SA, Croote D, Mignardi M, Chernikova S, Samghababi P, Zhang Y, Neff N, Kowarsky M, Caneda C, et al. (2017). Single-Cell RNA-Seq Analysis of Infiltrating Neoplastic Cells at the Migrating Front of Human Glioblastoma. Cell reports 21, 1399–1410. [DOI] [PMC free article] [PubMed] [Google Scholar]
- De Rosa A, Pellegatta S, Rossi M, Tunici P, Magnoni L, Speranza MC, Malusa F, Miragliotta V, Mori E, Finocchiaro G, et al. (2012). A radial glia gene marker, fatty acid binding protein 7 (FABP7), is involved in proliferation and invasion of glioblastoma cells. PloS one 7, e52113. [DOI] [PMC free article] [PubMed] [Google Scholar]
- deAzevedo LC, Fallet C, Moura-Neto V, Daumas-Duport C, Hedin-Pereira C, and Lent R (2003). Cortical radial glial cells in human fetuses: depth-correlated transformation into astrocytes. Journal of neurobiology 55, 288–298. [DOI] [PubMed] [Google Scholar]
- Di Lullo E, and Kriegstein AR (2017). The use of brain organoids to investigate neural development and disease. Nature reviews Neuroscience 18, 573–584. [DOI] [PMC free article] [PubMed] [Google Scholar]
- Drost J, and Clevers H (2018). Organoids in cancer research. Nature reviews Cancer 18, 407–418. [DOI] [PubMed] [Google Scholar]
- Er EE, Valiente M, Ganesh K, Zou Y, Agrawal S, Hu J, Griscom B, Rosenblum M, Boire A, Brogi E, et al. (2018). Pericyte-like spreading by disseminated cancer cells activates YAP and MRTF for metastatic colonization. Nature cell biology 20, 966–978. [DOI] [PMC free article] [PubMed] [Google Scholar]
- F. D (1874). Nesso fisio-pathologico tra la struttura dei nei materni e la genesi di alcuni tumori maligni. Arch Memori eed Osservazioni di Chirugia Practica 11, 217–226. [Google Scholar]
- Fietz SA, Kelava I, Vogt J, Wilsch-Brauninger M, Stenzel D, Fish JL, Corbeil D, Riehn A, Distler W, Nitsch R, et al. (2010). OSVZ progenitors of human and ferret neocortex are epithelial-like and expand by integrin signaling. Nature neuroscience 13, 690–699. [DOI] [PubMed] [Google Scholar]
- Filbin MG, Tirosh I, Hovestadt V, Shaw ML, Escalante LE, Mathewson ND, Neftel C, Frank N, Pelton K, Hebert CM, et al. (2018). Developmental and oncogenic programs in H3K27M gliomas dissected by single-cell RNA-seq. Science 360, 331–335. [DOI] [PMC free article] [PubMed] [Google Scholar]
- Finak G, McDavid A, Yajima M, Deng J, Gersuk V, Shalek AK, Slichter CK, Miller HW, McElrath MJ, Prlic M, et al. (2015). MAST: a flexible statistical framework for assessing transcriptional changes and characterizing heterogeneity in single-cell RNA sequencing data. Genome biology 16, 278. [DOI] [PMC free article] [PubMed] [Google Scholar]
- Friedmann-Morvinski D, Bushong EA, Ke E, Soda Y, Marumoto T, Singer O, Ellisman MH, and Verma IM (2012). Dedifferentiation of neurons and astrocytes by oncogenes can induce gliomas in mice. Science 338, 1080–1084. [DOI] [PMC free article] [PubMed] [Google Scholar]
- Fujikawa A, Sugawara H, Tanaka T, Matsumoto M, Kuboyama K, Suzuki R, Tanga N, Ogata A, Masumura M, and Noda M (2017). Targeting PTPRZ inhibits stem cell-like properties and tumorigenicity in glioblastoma cells. Scientific reports 7, 5609. [DOI] [PMC free article] [PubMed] [Google Scholar]
- Hansen DV, Lui JH, Parker PR, and Kriegstein AR (2010). Neurogenic radial glia in the outer subventricular zone of human neocortex. Nature 464, 554–561. [DOI] [PubMed] [Google Scholar]
- Hodge RD, Bakken TE, Miller JA, Smith KA, Barkan ER, Graybuck LT, Close JL, Long B, Johansen N, Penn O, et al. (2019). Conserved cell types with divergent features in human versus mouse cortex. Nature 573, 61–68. [DOI] [PMC free article] [PubMed] [Google Scholar]
- Hubert CG, Rivera M, Spangler LC, Wu Q, Mack SC, Prager BC, Couce M, McLendon RE, Sloan AE, and Rich JN (2016). A Three-Dimensional Organoid Culture System Derived from Human Glioblastomas Recapitulates the Hypoxic Gradients and Cancer Stem Cell Heterogeneity of Tumors Found In Vivo. Cancer Res 76, 2465–2477. [DOI] [PMC free article] [PubMed] [Google Scholar]
- Kadoshima T, Sakaguchi H, Nakano T, Soen M, Ando S, Eiraku M, and Sasai Y (2013). Self-organization of axial polarity, inside-out layer pattern, and species-specific progenitor dynamics in human ES cell-derived neocortex. Proceedings of the National Academy of Sciences of the United States of America 110, 20284–20289. [DOI] [PMC free article] [PubMed] [Google Scholar]
- Kambach DM, Halim AS, Cauer AG, Sun Q, Tristan CA, Celiku O, Kesarwala AH, Shankavaram U, Batchelor E, and Stommel JM (2017). Disabled cell density sensing leads to dysregulated cholesterol synthesis in glioblastoma. Oncotarget 8, 14860–14875. [DOI] [PMC free article] [PubMed] [Google Scholar]
- LaMonica BE, Lui JH, Hansen DV, and Kriegstein AR (2013). Mitotic spindle orientation predicts outer radial glial cell generation in human neocortex. Nature communications 4, 1665. [DOI] [PMC free article] [PubMed] [Google Scholar]
- Lathia JD, Gallagher J, Heddleston JM, Wang J, Eyler CE, Macswords J, Wu Q, Vasanji A, McLendon RE, Hjelmeland AB, et al. (2010). Integrin alpha 6 regulates glioblastoma stem cells. Cell Stem Cell 6, 421–432. [DOI] [PMC free article] [PubMed] [Google Scholar]
- Lathia JD, Mack SC, Mulkearns-Hubert EE, Valentim CL, and Rich JN (2015). Cancer stem cells in glioblastoma. Genes & development 29, 1203–1217. [DOI] [PMC free article] [PubMed] [Google Scholar]
- Linkous A, Balamatsias D, Snuderl M, Edwards L, Miyaguchi K, Milner T, Reich B, Cohen-Gould L, Storaska A, Nakayama Y, et al. (2019). Modeling Patient-Derived Glioblastoma with Cerebral Organoids. Cell reports 26, 3203–3211 e3205. [DOI] [PMC free article] [PubMed] [Google Scholar]
- Matevossian A, and Akbarian S (2008). Neuronal nuclei isolation from human postmortem brain tissue. Journal of visualized experiments : JoVE. [DOI] [PMC free article] [PubMed] [Google Scholar]
- Mita R, Coles JE, Glubrecht DD, Sung R, Sun X, and Godbout R (2007). B-FABP-expressing radial glial cells: the malignant glioma cell of origin? Neoplasia 9, 734–744. [DOI] [PMC free article] [PubMed] [Google Scholar]
- Miyata T, Kawaguchi A, Okano H, and Ogawa M (2001). Asymmetric inheritance of radial glial fibers by cortical neurons. Neuron 31, 727–741. [DOI] [PubMed] [Google Scholar]
- Muller S, Cho A, Liu SJ, Lim DA, and Diaz A (2018). CONICS integrates scRNA-seq with DNA sequencing to map gene expression to tumor sub-clones. Bioinformatics 34, 3217–3219. [DOI] [PMC free article] [PubMed] [Google Scholar]
- Muller S, Kohanbash G, Liu SJ, Alvarado B, Carrera D, Bhaduri A, Watchmaker PB, Yagnik G, Di Lullo E, Malatesta M, et al. (2017). Single-cell profiling of human gliomas reveals macrophage ontogeny as a basis for regional differences in macrophage activation in the tumor microenvironment. Genome biology 18, 234. [DOI] [PMC free article] [PubMed] [Google Scholar]
- Neftel C, Laffy J, Filbin MG, Hara T, Shore ME, Rahme GJ, Richman AR, Silverbush D, Shaw ML, Hebert CM, et al. (2019). An Integrative Model of Cellular States, Plasticity, and Genetics for Glioblastoma. Cell. [DOI] [PMC free article] [PubMed] [Google Scholar]
- Noctor SC, Flint AC, Weissman TA, Dammerman RS, and Kriegstein AR (2001). Neurons derived from radial glial cells establish radial units in neocortex. Nature 409, 714–720. [DOI] [PubMed] [Google Scholar]
- Nowakowski TJ, Bhaduri A, Pollen AA, Alvarado B, Mostajo-Radji MA, Di Lullo E, Haeussler M, Sandoval-Espinosa C, Liu SJ, Velmeshev D, et al. (2017). Spatiotemporal gene expression trajectories reveal developmental hierarchies of the human cortex. Science 358, 1318–1323. [DOI] [PMC free article] [PubMed] [Google Scholar]
- Nowakowski TJ, Pollen AA, Sandoval-Espinosa C, and Kriegstein AR (2016). Transformation of the Radial Glia Scaffold Demarcates Two Stages of Human Cerebral Cortex Development. Neuron 91, 1219–1227. [DOI] [PMC free article] [PubMed] [Google Scholar]
- Ogawa J, Pao GM, Shokhirev MN, and Verma IM (2018). Glioblastoma Model Using Human Cerebral Organoids. Cell reports 23, 1220–1229. [DOI] [PMC free article] [PubMed] [Google Scholar]
- Omuro A, and DeAngelis LM (2013). Glioblastoma and other malignant gliomas: a clinical review. Jama 310, 1842–1850. [DOI] [PubMed] [Google Scholar]
- Ostrem B, Di Lullo E, and Kriegstein A (2017). oRGs and mitotic somal translocation - a role in development and disease. Current opinion in neurobiology 42, 61–67. [DOI] [PMC free article] [PubMed] [Google Scholar]
- Ostrem BE, Lui JH, Gertz CC, and Kriegstein AR (2014). Control of outer radial glial stem cell mitosis in the human brain. Cell reports 8, 656–664. [DOI] [PMC free article] [PubMed] [Google Scholar]
- Ozawa T, Riester M, Cheng YK, Huse JT, Squatrito M, Helmy K, Charles N, Michor F, and Holland EC (2014). Most human non-GCIMP glioblastoma subtypes evolve from a common proneural-like precursor glioma. Cancer cell 26, 288–300. [DOI] [PMC free article] [PubMed] [Google Scholar]
- Patel AP, Tirosh I, Trombetta JJ, Shalek AK, Gillespie SM, Wakimoto H, Cahill DP, Nahed BV, Curry WT, Martuza RL, et al. (2014). Single-cell RNA-seq highlights intratumoral heterogeneity in primary glioblastoma. Science 344, 1396–1401. [DOI] [PMC free article] [PubMed] [Google Scholar]
- Peng YR, Shekhar K, Yan W, Herrmann D, Sappington A, Bryman GS, van Zyl T, Do MTH,Regev A, and Sanes JR (2019). Molecular Classification and Comparative Taxonomics of Foveal and Peripheral Cells in Primate Retina. Cell 176, 1222–1237 e1222. [DOI] [PMC free article] [PubMed] [Google Scholar]
- Petti AA, Williams SR, Miller CA, Fiddes IT, Srivatsan SN, Chen DY, Fronick CC, Fulton RS, Church DM, and Ley TJ (2018). Mutation detection in thousands of acute myeloid leukemia cells using single cell RNA-sequencing. 434746. [Google Scholar]
- Pollen AA, Nowakowski TJ, Chen J, Retallack H, Sandoval-Espinosa C, Nicholas CR, Shuga J, Liu SJ, Oldham MC, Diaz A, et al. (2015). Molecular identity of human outer radial glia during cortical development. Cell 163, 55–67. [DOI] [PMC free article] [PubMed] [Google Scholar]
- Pollen AA, Nowakowski TJ, Shuga J, Wang X, Leyrat AA, Lui JH, Li N, Szpankowski L, Fowler B, Chen P, et al. (2014). Low-coverage single-cell mRNA sequencing reveals cellular heterogeneity and activated signaling pathways in developing cerebral cortex. Nature biotechnology 32, 1053–1058. [DOI] [PMC free article] [PubMed] [Google Scholar]
- Prager BC, Xie Q, Bao S, and Rich JN (2019). Cancer Stem Cells: The Architects of the Tumor Ecosystem. Cell Stem Cell 24, 41–53. [DOI] [PMC free article] [PubMed] [Google Scholar]
- Puchalski RB, Shah N, Miller J, Dalley R, Nomura SR, Yoon JG, Smith KA, Lankerovich M, Bertagnolli D, Bickley K, et al. (2018). An anatomic transcriptional atlas of human glioblastoma. Science 360, 660–663. [DOI] [PMC free article] [PubMed] [Google Scholar]
- Qin EY, Cooper DD, Abbott KL, Lennon J, Nagaraja S, Mackay A, Jones C, Vogel H, Jackson PK, and Monje M (2017). Neural Precursor-Derived Pleiotrophin Mediates Subventricular Zone Invasion by Glioma. Cell 170, 845–859 e819. [DOI] [PMC free article] [PubMed] [Google Scholar]
- Shannon P, Markiel A, Ozier O, Baliga NS, Wang JT, Ramage D, Amin N, Schwikowski B, and Ideker T (2003). Cytoscape: a software environment for integrated models of biomolecular interaction networks. Genome research 13, 2498–2504. [DOI] [PMC free article] [PubMed] [Google Scholar]
- Shekhar K, Lapan SW, Whitney IE, Tran NM, Macosko EZ, Kowalczyk M, Adiconis X, Levin JZ, Nemesh J, Goldman M, et al. (2016). Comprehensive Classification of Retinal Bipolar Neurons by Single-Cell Transcriptomics. Cell 166, 1308–1323 e1330. [DOI] [PMC free article] [PubMed] [Google Scholar]
- Shi Y, Ping YF, Zhou W, He ZC, Chen C, Bian BS, Zhang L, Chen L, Lan X, Zhang XC, et al. (2017). Tumour-associated macrophages secrete pleiotrophin to promote PTPRZ1 signalling in glioblastoma stem cells for tumour growth. Nature communications 8, 15080. [DOI] [PMC free article] [PubMed] [Google Scholar]
- Shiraki Y, Mii S, Enomoto A, Momota H, Han YP, Kato T, Ushida K, Kato A, Asai N, Murakumo Y, et al. (2017). Significance of perivascular tumour cells defined by CD109 expression in progression of glioma. The Journal of pathology 243, 468–480. [DOI] [PubMed] [Google Scholar]
- Singh SK, Hawkins C, Clarke ID, Squire JA, Bayani J, Hide T, Henkelman RM, Cusimano MD, and Dirks PB (2004). Identification of human brain tumour initiating cells. Nature 432, 396–401. [DOI] [PubMed] [Google Scholar]
- Son MJ, Woolard K, Nam DH, Lee J, and Fine HA (2009). SSEA-1 is an enrichment marker for tumor-initiating cells in human glioblastoma. Cell Stem Cell 4, 440–452. [DOI] [PMC free article] [PubMed] [Google Scholar]
- Sorrells SF, Paredes MF, Cebrian-Silla A, Sandoval K, Qi D, Kelley KW, James D, Mayer S,Chang J, Auguste KI, et al. (2018). Human hippocampal neurogenesis drops sharply in children to undetectable levels in adults. Nature 555, 377–381. [DOI] [PMC free article] [PubMed] [Google Scholar]
- Susaki EA, Tainaka K, Perrin D, Yukinaga H, Kuno A, and Ueda HR (2015). Advanced CUBIC protocols for whole-brain and whole-body clearing and imaging. Nat Protoc 10, 1709–1727. [DOI] [PubMed] [Google Scholar]
- Suzuki SO, McKenney RJ, Mawatari SY, Mizuguchi M, Mikami A, Iwaki T, Goldman JE, Canoll P, and Vallee RB (2007). Expression patterns of LIS1, dynein and their interaction partners dynactin, NudE, NudEL and NudC in human gliomas suggest roles in invasion and proliferation. Acta neuropathologica 113, 591–599. [DOI] [PubMed] [Google Scholar]
- Tasic B, Menon V, Nguyen TN, Kim TK, Jarsky T, Yao Z, Levi B, Gray LT, Sorensen SA, Dolbeare T, et al. (2016). Adult mouse cortical cell taxonomy revealed by single cell transcriptomics. Nature neuroscience 19, 335–346. [DOI] [PMC free article] [PubMed] [Google Scholar]
- Taylor MD, Poppleton H, Fuller C, Su X, Liu Y, Jensen P, Magdaleno S, Dalton J, Calabrese C, Board J, et al. (2005). Radial glia cells are candidate stem cells of ependymoma. Cancer cell 8, 323–335. [DOI] [PubMed] [Google Scholar]
- Tirosh I, Venteicher AS, Hebert C, Escalante LE, Patel AP, Yizhak K, Fisher JM, Rodman C, Mount C, Filbin MG, et al. (2016). Single-cell RNA-seq supports a developmental hierarchy in human oligodendroglioma. Nature 539, 309–313. [DOI] [PMC free article] [PubMed] [Google Scholar]
- Velmeshev D, Schirmer L, Jung D, Haeussler M, Perez Y, Mayer S, Bhaduri A, Goyal N, Rowitch DH, and Kriegstein AR (2019). Single-cell genomics identifies cell type-specific molecular changes in autism. Science 364, 685–689. [DOI] [PMC free article] [PubMed] [Google Scholar]
- Venteicher AS, Tirosh I, Hebert C, Yizhak K, Neftel C, Filbin MG, Hovestadt V, Escalante LE, Shaw ML, Rodman C, et al. (2017). Decoupling genetics, lineages, and microenvironment in IDH-mutant gliomas by single-cell RNA-seq. Science 355. [DOI] [PMC free article] [PubMed] [Google Scholar]
- Villa GR, Hulce JJ, Zanca C, Bi J, Ikegami S, Cahill GL, Gu Y, Lum KM, Masui K, Yang H, et al. (2016). An LXR-Cholesterol Axis Creates a Metabolic Co-Dependency for Brain Cancers. Cancer cell 30, 683–693. [DOI] [PMC free article] [PubMed] [Google Scholar]
- Wang X, Prager BC, Wu Q, Kim LJY, Gimple RC, Shi Y, Yang K, Morton AR, Zhou W, Zhu Z, et al. (2018). Reciprocal Signaling between Glioblastoma Stem Cells and Differentiated Tumor Cells Promotes Malignant Progression. Cell Stem Cell 22, 514–528 e515. [DOI] [PMC free article] [PubMed] [Google Scholar]
- Weng Q, Wang J, Wang J, He D, Cheng Z, Zhang F, Verma R, Xu L, Dong X, Liao Y, et al. (2019). Single-Cell Transcriptomics Uncovers Glial Progenitor Diversity and Cell Fate Determinants during Development and Gliomagenesis. Cell Stem Cell. [DOI] [PMC free article] [PubMed] [Google Scholar]
- Yuan J, McLendon HM, Frattini V, Bush EC, Boyett DM, Samanamud J, Ceccarelli M, Dovas A, Zanazzi G, Canoll P, et al. (2018). Single-cell transcriptome analysis of lineage diversity in high-grade glioma. Genome Med 10, 57. [DOI] [PMC free article] [PubMed] [Google Scholar]
- Zhou W, Ke SQ, Huang Z, Flavahan W, Fang X, Paul J, Wu L, Sloan AE, McLendon RE, Li X, et al. (2015). Periostin secreted by glioblastoma stem cells recruits M2 tumour-associated macrophages and promotes malignant growth. Nature cell biology 17, 170–182. [DOI] [PMC free article] [PubMed] [Google Scholar]
- Zong H, Parada LF, and Baker SJ (2015). Cell of origin for malignant gliomas and its implication in therapeutic development. Cold Spring Harb Perspect Biol 7. [DOI] [PMC free article] [PubMed] [Google Scholar]
Associated Data
This section collects any data citations, data availability statements, or supplementary materials included in this article.
Supplementary Materials
Video 1 (Related to Figure 4). Live time-lapse video microscopy showing dissociated GBM cells labeled with adeno-cmv-gfp. The cell undergoing MST is circled and the direction of the MST shown with the arrow. Daughter cells are also represented on the video. Frames captured every 15 minutes.
Videos 2 & 3 (Related to Figure 4). Live time-lapse video microscopy showing dissociated GBM cells labeled with adeno-cmv-gfp. The cell undergoing MST is circled and the direction of the MST shown with the arrow. The cleavage angle of MST is represented by a line. Daughter cells are also represented on the video. Frames captured every 15 minutes.
Video 4 (Related to Figure 4). Live time-lapse video microscopy showing dissociated GBM cells labeled with adeno-cmv-gfp. The cell undergoing MST is circled in pink and the direction of the MST shown with the arrow. Daughter cells undergoing division are circled in orange and yellow and their respective daughter cells are represented on the video. Frames captured every 15 minutes.
Video 5 (Related to Figure 5). Live time-lapse video microscopy showing in vitro cultured GBM cells enriched for PTPRZ1 by FACS. Cells are labeled with adeno-cmv-gfp. The cell undergoing MST is circled and the direction of the MST shown with the arrow. Daughter cells are represented on the video. Frames captured every 3 minutes.
Video 6 (Related to Figure 5). Microscopy image derived from lightsheet imaging of a cleared cortical organoid being invaded by PDX line DBTRGFL tumor cells labelled with GFP.
Data Availability Statement
RNA sequencing data has been deposited at PRJNA579593 and SRP132816 (snRNA-seq). Supplemental tables detailing intermediate analyses have been deposited as Mendeley Data at [doi: 10.17632/ky8vs4xhp8.1].