Abstract
Purpose
Vascular disrupting therapy of cancer has become a promising approach not only to regress tumor growth directly but also to boost the delivery of chemotherapeutics in the tumor. An imaging approach to monitor the changes in tumor vascular permeability, therefore, has important applications for monitoring of vascular disrupting therapies.
Methods
Mice bearing CT26 subcutaneous colon tumors were injected intravenously with 150 kD dextran (Dex150, diameter, d~ 20 nm, 375 mg/kg), tumor necrosis factor-alpha (TNF-α; 1 μg per mouse), or both (n = 3 in each group). The Z-spectra were acquired before and 2 h after the injection, and the chemical exchange saturation transfer (CEST) signals in the tumors as quantified by asymmetric magnetization transfer ratio (MTRasym) at 1 ppm were compared.
Results
The results showed a significantly stronger CEST contrast enhancement at 1 ppm (ΔMTRasym = 0.042 ± 0.002) in the TNF-α-treated tumors than those by Dex150 alone (ΔMTRasym = 0.000 ± 0.005, P = 0.0229) or TNF-α alone (ΔMTRasym = 0.002 ± 0.004, P = 0.0264), indicating that the TNF-α treatment strongly augmented the tumor uptake of 150 kD dextran. The MRI findings were verified by fluorescence imaging and immunofluorescence microscopy.
Conclusions
High molecular weight dextrans can be used as safe and sensitive CEST MRI contrast agents for monitoring tumor response to vascular disrupting therapy and, potentially, for developing dextran-based theranostic drug delivery systems.
Keywords: CEST, dextran, MRI, permeability, vascular disrupting therapy
1 |. INTRODUCTION
There is great interest in the development of tumor vascular-targeting therapies, either by normalizing the vasculature,1,2 inhibiting the production of neovessels (anti‐angiogenesis),3–5 or destroying existing vessels (vascular disrupting therapy).6,7 For instance, combretastatin A4 phosphate (CA4P),8 is now being investigated in phase II/III clinical trials for advanced ovarian cancer, Non‐small cell lung cancer (NSCLC), and anaplastic thyroid cancer.9,10 In addition to being used in stand-alone manner, vascular-targeting therapy can also be an attractive strategy to enhance the drug delivery to hypo-permeable tumors. It has been shown that an increased efficacy of traditional chemotherapeutic agents or nanoparticles can be achieved when a vascular-targeting therapy is used as a co-treatment.3,4,11,12 Considering the heterogeneity of tumors, and thus the heterogeneous responses to interventions, clinical outcomes would benefit greatly from imaging approaches that can monitor the tumor response during and after treatment.13 Several MRI methods are being used for the evaluation of tumor responses to anti-vascular therapies, including dynamic contrast-enhanced MRI (DCE-MRI),14,15 diffusion-weighted imaging.16,17 intravoxel incoherent motion diffusion-weighted imaging,18 and 19F MRI.19,20 Clinically, DCE-MRI is considered particularly useful in assessing the changes in perfusion and permeability in the tumor bed.21,22 However, concerns have recently been raised about its frequent and repetitive use on patients due to Gd deposition in tissues.23,24 Therefore, the development of alternative MR molecular imaging modalities for monitoring tumor response is needed.
In a recent study,25 we proposed to assess tumor vascular permeability using nonlabeled dextrans as imaging probes that can be detected by an emerging approach called chemical exchange saturation transfer (CEST) MRI,26–29 and named it dexCEST. Dextran is a family of natural polysaccharides that have CEST MRI contrast originating from hydroxyl protons, enabling detection without the need for chemical modification with radioactive or metallic labels. Moreover, dextrans are polymers composed of tens to thousands of glucose units, providing a greatly boosted sensitivity for in vivo applications, such as imaging of prostate-specific membrane antigen.30 Because dextrans are available in a variety of different molecular sizes, dexCEST MRI has the potential to characterize differential vascular permeability of tumors to particles in different size ranges.25 Dextrans are available in clinical-grade for intravenous injection, which have a proven safety profile,31 allowing repeated use without fear of accumulation and toxicity. Hence, dexCEST MRI potentially is a safe and translatable molecular imaging method.
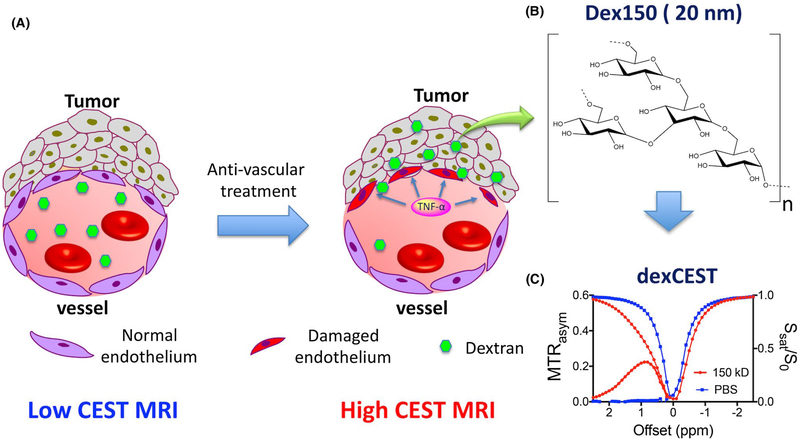
In the present study, we aimed to explore the potential application of dexCEST MRI for monitoring of changes in vascular permeability in response to vascular disrupting therapies. In this first demonstration, we adapted a well-documented vascular disrupting agent, tumor necrosis factor-alpha (TNF-α),6,7 as the model treatment. Systemic administration of high-dose TNF-α results in selective destruction of tumor-associated vessels, but not those of normal tissues.32 As a result, the administration of TNF-α can greatly increase the pore size of the tumor-associated vessels, resulting in a markedly enhanced tumor uptake of macromolecules33 and nanoparticles7 (Figure 1A). We hypothesized that high molecular weight (MW) dextrans, such as 150 kD (Dex150, diameter, d~ 20 nm; Figure 1B), whose particle size is larger than the cut-off of the vessel pore size of “normal” tumors, can be used to detect the response of blood vessels to a treatment.
FIGURE 1.
Illustration of using dexCEST MRI to monitor the tumor responses to antivascular therapies. A, Schematic of the effect of antivascular therapies such as TNF-α on the extravasation of dextran molecules. The picture on the left shows a “normal” vessel around tumor cells, consisting of endothelial cells but lacking pericyte coverage. While it has greater permeability than healthy vessels, molecules larger than the pore size cannot easily pass. Upon TNF-α treatment, as shown in the picture on right, tumor endothelial cells are selectively damaged by TNF-α, resulting in an enormous augmentation of vessel permeability and strong extravasation of large molecules in the tumor. B, Chemical structure of Dex150. C, CEST characteristics of Dex150 in PBS as shown by the Z spectrum and MTRasym plot of 3.6 mg/mL mM Dex150 (20 mM per glucose unit or 24 μM per dextran molecule, in 10 mM PBS, pH = 7.3). CEST MRI was performed using a 4-s-long CW radiofrequency pulse (B1 = 3.6 μT) at 37°C
2 |. METHODS
2.1 |. Chemicals
Dex150 was purchased from Sigma (St. Louis, MO) and fluorescein-labeled 150 kD dextran (Dex150-FITC) were purchased from Invitrogen-Life Technologies (Carlsbad, CA).
2.2 |. Animals
All animal studies were approved by the institutional animal care and use committee of Johns Hopkins University. Mice bearing subcutaneous CT26 colon tumors were prepared using a standard procedure described previously.7,34 In brief, 5 × 10⁵ CT26 cells were injected subcutaneously into the right flank of female BALB/c mice (female, 6 weeks old, Harlan Breeders) and grown for ~14 days to reach a size of > 350 mm3.
2.3 |. MRI
In vitro CEST images were acquired on a 9.4T Bruker Avance system equipped with a 15 mm sawtooth radiofrequency coil using the previously published protocol.29,35,36 In brief, a modified RARE sequence (repetition time = 6.0 s, effective echo time = 43.2 ms, RARE factor = 16, slice thickness = 0.7 mm, field of view = 14 × 14 mm, matrix size = 128 × 128 with partial FT acceleration to 128 × 64, resolution = 0.11 × 0.11 mm2, and number of averages = 2) including a magnetization transfer (MT) module (1 CW pulse, B = 3.6 μT [150 Hz], 3 s) was used to acquire CEST-weighted images from −4 ppm to 4 ppm (step = 0.2 ppm) around the water resonance (0 ppm),36 total acquisition time = 32.8 min (including M0 image). The absolute water resonance frequency shift was measured using the modified WAter Saturation Shift Reference (WASSR) method37 using a Lorentzian model.36,38 The same parameters as in CEST imaging were used except repetition time = 1.5 s, tsat = 500 ms, B1 = 0.5 μT (21.3 Hz) and the saturation frequency swept from −1 ppm to 1 ppm (step = 0.1 ppm), total acquisition time = 2.1 min.
In vivo MR studies were carried out on a Biospec 11.7T horizontal MRI scanner equipped with a 23 mm mouse brain volume coil. MR images were acquired before and 2 h after the intravenous injection of, (A) Dex150 (100 μL in saline solution, 375 mg/kg body weight); (B) TNF-α (1 μg per mouse, 10 μg/mL in phosphate buffered saline (PBS) containing 0.1% (w/v) bovine serum albumin) as described previously.7 or (C) Dex150 and TNF-α (total injection volume = 200 μL). Three mice were randomly selected for each group. Full Z spectra were acquired by sweeping the saturation offsets from −3 ppm to +3 ppm (step size 0.2 ppm) using a fat-suppressed RARE sequence with a continuous wave presaturation pulse of B1 = 1.8 μT and 3 s with acquisition parameters: TR/TE = 5000/5 ms, RARE factor = 10, number of averages = 2, slice number = 1, slice thickness = 1 mm, matrix size = 64 × 64 with partial FT acceleration to 64 × 40, field of view = 25 mm × 25 mm2, total acquisition time = 20.7 min. It should be noted that a weaker B1 (i.e., 1.8 μT) was used for in vivo studies than that used for in vitro studies (i.e., 3.6 μT) to reduce the unwanted saturation caused by the MT effect.25,30 To correct B0 inhomogeneity, WASSR-based B0 maps (acquisition time = 2.1 min) were acquired before and after CEST acquisition as described previously.25,30
Data were processed using custom-written MATLAB scripts. After correcting for B0 inhomogeneity, the CEST contrast was quantified by the asymmetric magnetization transfer ratio (MTRasym) = (S−Δω – S+Δω)/S0 at 1 ppm, where S[−Δω, +Δω] are the water signal intensity in the presence of saturation pulses at offsets ±Δω, and S0 is the water signal intensity in the absence of saturation pulses.
2.4 |. Fluorescence imaging
Both in vivo and ex vivo fluorescence imaging was performed and analyzed with a Spectrum/CT IVIS® in vivo imaging system using the Living Image® software (PerkinElmer, Waltham, MA). For in vivo and ex vivo fluorescence imaging, mice (n = 3) were first injected with either Dex150-FITC (200 mg/kg body weight) alone or the combination of Dex150-FITC and TNF-α (1 μg per mouse). Fluorescence images were acquired at 2 h after the injection. Fluorescence signal (exc/emi = 492/518 nm) was quantified as radiant efficiency.
2.5 |. Immunofluorescence microscopy
For immunofluorescent staining of CD31, CD31 rat anti-mouse mAb (Life Technologies, Inc.), and Alexa Fluor® 594 goat anti-rabbit IgG (H+L) antibody (Life Technologies, Inc.) were used as primary and secondary antibodies, respectively. Briefly, sections were blocked with 10% goat bovine serum albumin for 30 min, followed by overnight incubation at 4 °C with the primary antibody and 45 min at 4 °C with the secondary antibody. After each step slides were washed with PBS. Fluorescent images were taken with a Zeiss Axiovert 200 base microscope.
2.6 |. Statistical analysis
The data were expressed as means ± standard deviation and analyzed by a 2-tailed unpaired Student’s t test. Differences were considered significant when P < 0.05.
3 |. RESULTS
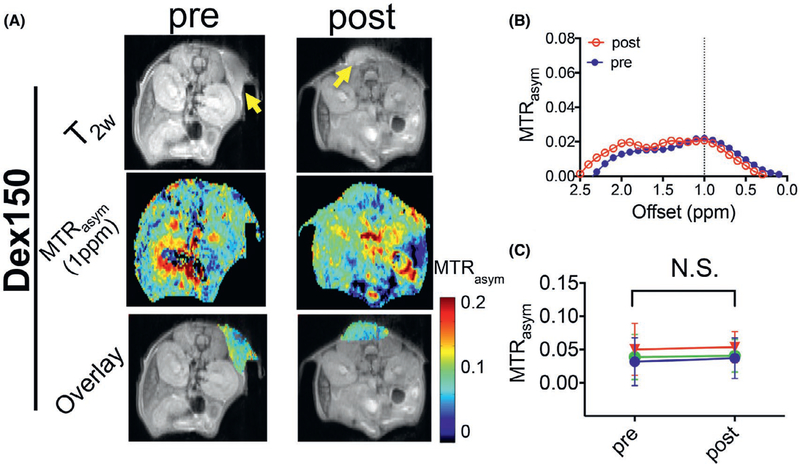
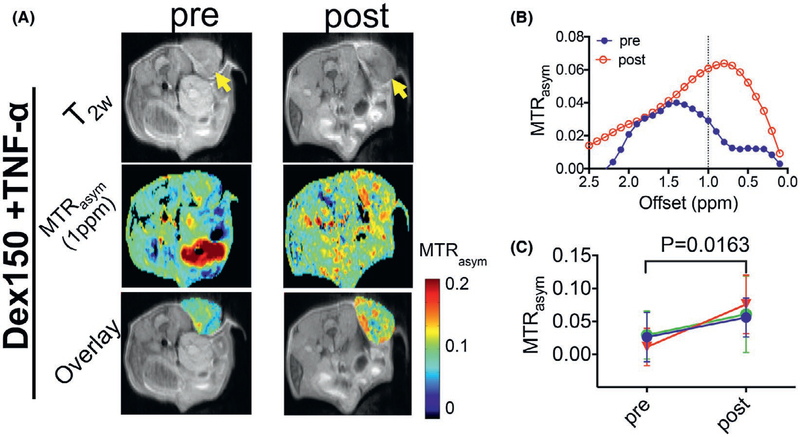
Based on the previous reports on the plasma half-life time of Dex150,39,40 we chose 2 h to assess the post-injection contrast enhancement. As shown in Figure 2, the injection of Dex150 alone generated negligible contrast enhancement in the tumor, with the mean MTRasym (1 ppm) = 0.035 ± 0.014 and 0.034 ± 0.018, for before and after the injection, respectively (P = 0.9757, paired 2-tailed Student’s t test, n = 3), indicating that the Dex150 has limited permeability to the vasculature in untreated tumors. In contrast, in mice treated with TNF-α (Figure 3), Dex150 could result in a significant CEST contrast enhancement in the tumor, with the mean MTRasym (1 ppm) = 0.022 ± 0.010 and 0.064 ± 0.010, for before and after the injection, respectively (P = 0.0163, paired Student’s t test, n = 3), which equals to a relative 190% increase. The comparison of MTRasym plots pre- and postinjection of Dex150 clearly revealed the contrast enhancement pattern similar to that of Dex150 in solution with the maximum contrast occurring at around 1 ppm (Figure 3B).
FIGURE 2.
DexCEST contrast enhancement in CT26 tumors before and 2 h after the administration of Dex150. A, From top to bottom, T2w anatomical images with tumors indicated by the yellow arrows (top), dexCEST parametric maps (middle), and overlaid images showing the dexCEST signal within the tumors (bottom) of the representative mice before and 2 h after the injection of Dex150. B, Corresponding MTRasym plots before and after injection. C, Mean pre- and post-dexCEST contrast in the tumors (n = 3)
FIGURE 3.
DexCEST contrast enhancement in CT26 tumors before and 2 h after the administration of Dex150 and TNF-α. A, From top to bottom, T2w anatomical images with tumors indicated by the yellow arrows (top), dexCEST parametric maps (middle), and overlaid images showing the dexCEST signal within the tumors (bottom) of the representative mice before and 2 h after the injection of Dex150 and TNF-α. B, Corresponding MTRasym plots before and after injection. C, Mean pre- and post-dexCEST contrast in the tumors (n = 3)
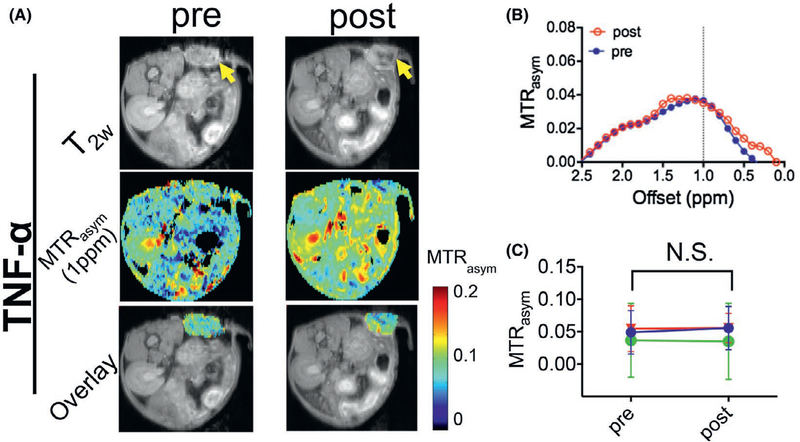
To confirm the increases in CEST contrast were not induced by the effect of TNF-α, we also measured the CEST contrast before and after the injection of TNF-α alone. As shown in Figure 4, the injection of TNF-α alone did not generate detectable CEST contrast enhancement, i.e., the mean MTRasym (1 ppm) = 0.042 ± 0.008 and 0.043 ± 0.011 before and after the injection, respectively (P = 0.8310, paired 2-tailed Student’s t test, n = 3). It should be noted that there was a noticeable variation in the background (preinjection) CEST MRI signal, likely attributable to both the individual difference, such as the size and status of tumors, and variation of MRI parameters (e.g., B1) for scans performed on different days.
FIGURE 4.
DexCEST contrast enhancement in CT26 tumors before and 2 h after the administration of TNF-α. A, From top to bottom, T2w anatomical images with tumors indicated by the yellow arrows (top), dexCEST parametric maps (middle), and overlaid images showing the dexCEST signal within the tumors (bottom) of the representative mice before and 2 h after the injection of Dex150 and TNF-α. B, Corresponding MTRasym plots before and after injection. C, Mean pre- and post-dexCEST contrast in the tumors (n = 3)
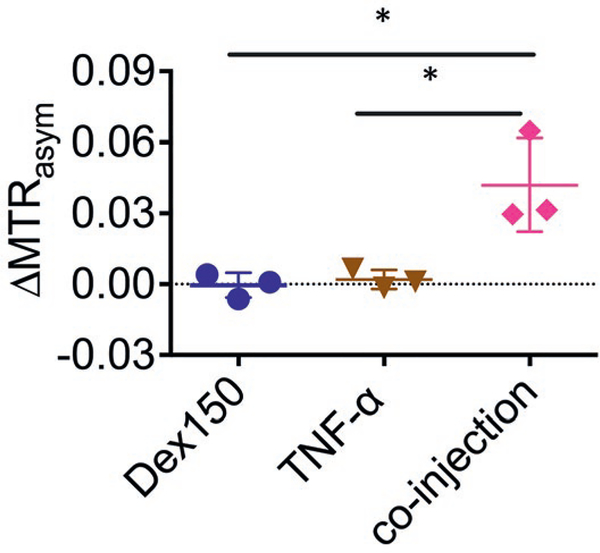
Figure 5 summarized the average CEST contrast enhancement (quantified by ΔMTRasym at 1 ppm) in each group. The results showed that the average CEST contrast enhancement in the TNF-α + Dex150 group was 0.042 ± 0.002, which was significantly higher than that by either Dex150 alone (ΔMTRasym = 0.000 ± 0.005, P = 0.0229, unpaired 2-tailed Student’s t test, n = 3), or TNF-α alone (ΔMTRasym = 0.002 ± 0.004, P = 0.0264, unpaired 2-tailed Student’s t test, n = 3).
FIGURE 5.
Comparison of CEST signal changes in mice injected with Dex150, TNF-α, and the combination of Dex150 and TNF-α (n = 3 each group)
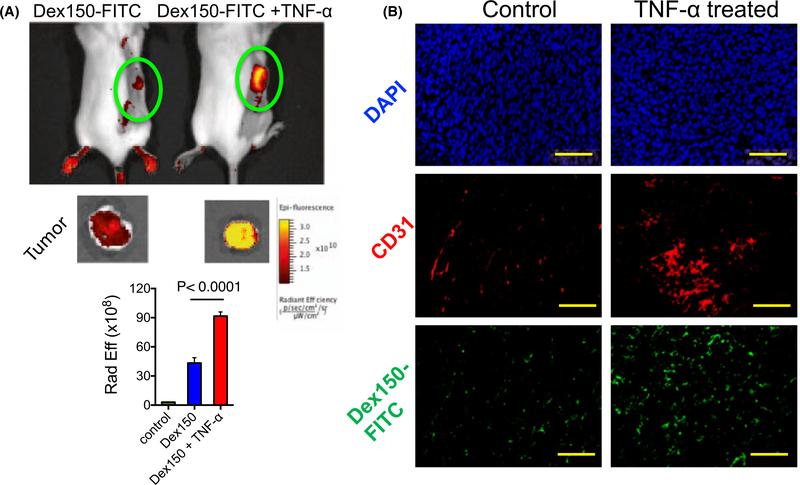
To validate the MRI findings, we performed fluorescence imaging on mice injected with the fluorescence labeled dextran, Dex150-FITC. As shown in Figure 6A, both in vivo and ex vivo fluorescence imaging results revealed that injection of TNF-α markedly augmented the tumor uptake of Dex150-FITC as revealed by the stronger fluorescence signal in these tumors. The extravasation of Dex150-FITC into the tumor extravascular space was confirmed by immunohistochemistry of the tumor sections (Figure 6B), in which the co-localization of blood vessels (anti-CD31, red) and Dex150-FITC (green) clearly shows that dextrans passed into tumor parenchyma upon the treatment with TNF-α.
FIGURE 6.
Fluorescence validation. A, Fluorescence imaging of Dex150-FITC in the tumor. The top panel shows the images of 2 representative mice, with and without TNF-α treatment, respectively, at 2 h after Dex150-FITC injection; the middle panel is the corresponding ex vivo images of excised tumors; and the bottom panel is the bar plot of the average fluorescence intensities in the tumors receiving saline, Dex150 and Dex150+TNF-α, respectively. B, Fluorescence microscopic images of DAPI (top), CD31 (middle) and Dex150 (bottom), respectively
4 |. DISCUSSION
We demonstrated that dexCEST MRI can be used as a noninvasive imaging tool to monitor the changes in the tumor permeability in response to a vascular disrupting agent, exemplified by TNF-α. These results suggest that dexCEST MRI has potential as a new image-guidance tool for monitoring the tumor response to vascular-disrupting therapy and most likely also cancer stroma-depleting therapy.41 One important application of these 2 types of therapy is to boost the efficacy of chemotherapy by increasing the drug delivery in otherwise hypo-permeable solid tumors.3,4,11,12 The dextran-based MRI method is expected to be useful because many drugs are in the macromolecular size range (i.e., monocolonal antibodies) and nano-size range (nanomedicine). Thus, using large size dextrans (e.g., Dex150 ~ 20 nm) as the MRI agents allows the direct monitoring of the changes in tumor permeability in the large size range, providing an indispensable advantage over the conventional Gd-based contrast agent (e.g., Gd-DTPA, MW = 547, d < 1 nm). We, therefore, expect that dexCEST MRI can greatly facilitate the preclinical development and clinical implementation of vascular- and stroma-targeting therapies in a personalized medicine manner.
The dexCEST MRI method uses only high MW natural dextrans as imaging probes, which eliminates the need for paramagnetic metals such as Gd. Therefore, upon translations, it is expected to allow frequent use on patients without serious safety concerns.42,43 Dextran has been used in the clinic as an injectable agent for more than 6 decades, with a well-proven safety profile even at very high doses.31 This outstanding safety profile will greatly accelerate the speed of translating the proposed technology and protocol to the clinic. Second, the sensitivity of high MW dextrans is higher than that of small molecules. According to our previous study,25 the detectability (defined as the minimal concentration of a contrast agent to generate 5% signal change) of Dex150 at physiological pH is only 3.2 μM per dextran molecule (3 mM per glucose), indicating an approximately 1000 times higher sensitivity enhancement as compared to its monomer glucose.
One potential application of the proposed dexCEST MRI is to optimize the time window to administer chemotherapeutic agents after an antivascular treatment is given in each individual patient. Consistent with previous studies,44,45 our results showed that the enhanced permeability in tumor vasculature, hence the tumor uptake of dextrans, is highly time-dependent. High MW dextrans have a long plasma lifetime, which will allow repetitive CEST MRI assessments over a prolonged period of time after a single injection. For example, our results showed that the dexCEST enhanced-MRI could be acquired at 2 h after the injection of Dex150. It has been shown that high MW dextrans (e.g., 150 kD) can remain in the blood circulation for hours.40,46 In principle, the circulating high MW dextrans will be permeable to tumor only after the pore size of the tumor vasculature is increased to be sufficiently large. This thus makes high MW dextrans more powerful than some radioactive imaging agents that may have short half-lives. As a result, simply by observing the change of the CEST MRI signal in the tumor at different time points after a single injection, one can determine when the vascular disrupting treatment starts to be effective. Thus, dexCEST MRI has potential as a novel noninvasive tool for determining the optimal time window of vascular disrupting treatments, at which the enhancement of the tumor uptake of chemotherapeutic agents, especially nanoparticles, can be maximized.
One potential drawback in the application of CEST signal of hydroxyl proton is its relatively small chemical shift (~ 1 ppm) that can be possibly ‘contaminated’ by endogenous CEST species. Using a dynamic CEST MRI acquisition scheme can measure specifically the changes in dexCEST signal at 1 ppm by normalizing the background CEST signal generated by endogenous molecules.25 Thus, the background OH signals in the tissue are subtracted and will not cause errors in the MRI quantification of tumor uptake of dextrans. However, this method requires the subject staying still in the scanner for a long time. As a practical alternative, in our study we used another much simpler steady state imaging scheme, in which the pre- and post-dexCEST contrast were compared. Our results clearly showed that this steady state imaging scheme could reliably detect the enhancement of dextran uptake in the tumor, providing a practical way to assess the treatment responses. However, imaging at 2 time points with a long delay between scans (i.e., 2 h) may substantially increase the difficulty for quantitatively assessing the changes in vascular permeability. For instance, multislice acquisitions and co-registration in the postprocessing are required to match the images pre- and postinjection for removing the background CEST signal accurately.
One of the potential challenges for clinical application of dexCEST MRI is the quantification in rather heterogeneous tumors, where tissue T1 and pH may be greatly variable and confound CEST quantification. To overcome the confounding effect of T1, a quantitative analysis method called AREX47 can be used, which has been demonstrated to effectively compensate for the T1 effect.38,47 However, our results (Figure 4) showed that neither the treatment of TNF-α nor the injection of dextrans led to a significant change in the endogenous CEST contrast, suggesting that there was no T1 change that would have caused endogenous CEST to change. Therefore, we did not use the AREX method in our study. Moreover, a recent study by Zu et al48 showed that MTRasym is less dependent on T1 at low magnetic fields when high B1 pulses are used, suggesting T1 compensation methods may not be necessary in the clinical applications of dexCEST. As shown in our previous study, the dexCEST contrast dramatically increases when pH decreases from pH 8.0 to pH 6.5 due to the fact that the decreased water exchange rate of OH at the lower pH is in the intermediate to fast exchange regime and favorable for CEST contrast enhancement.49,50 While this dependency on pH may complicate accurate quantification of dexCEST due to the presence of compartments with different pHs, considering that tumors often have an acidic extracellular tumor microenvironment,51–53 a higher contrast enhancement at acidic pH is an advantage for applications in tumors.
5 |. CONCLUSIONS
In summary, we developed a novel MRI method for monitoring the changes in the tumor vascular permeability upon anti-vascular treatment and illustrate this for TNF-α application. In this approach, natural high MW dextrans are used as imaging agents that can be detected by CEST MRI without the need for synthetic labeling. Our results suggest that dexCEST MRI has the potential to facilitate the preclinical development and clinical implementation of vascular- and stroma- targeting therapies in a personalized medicine manner.
Acknowledgments
Funding information
This work was supported by NIH grants R21CA215860, R01EB015032, P41EB024495, and The Virginia and D.K. Ludwig Fund for Cancer Research.
REFERENCES
- 1.Chauhan VP, Stylianopoulos T, Martin JD, et al. Normalization of tumour blood vessels improves the delivery of nanomedicines in a size-dependent manner. Nat Nanotechnol. 2012;7:383–388. [DOI] [PMC free article] [PubMed] [Google Scholar]
- 2.Jain RK. Normalization of tumor vasculature: an emerging concept in antiangiogenic therapy. Science. 2005;307:58–62. [DOI] [PubMed] [Google Scholar]
- 3.Folkman J Anti-angiogenesis: new concept for therapy of solid tumors. Ann Surg. 1972;175:409–416. [DOI] [PMC free article] [PubMed] [Google Scholar]
- 4.Shojaei F Anti-angiogenesis therapy in cancer: current challenges and future perspectives. Cancer Lett. 2012;320:130–137. [DOI] [PubMed] [Google Scholar]
- 5.Ma J, Chen CS, Blute T, Waxman DJ. Antiangiogenesis enhances intratumoral drug retention. Cancer Res. 2011;71:2675–2685. [DOI] [PMC free article] [PubMed] [Google Scholar]
- 6.Siemann DW. The unique characteristics of tumor vasculature and preclinical evidence for its selective disruption by tumor-vasculardisrupting agents. Cancer Treat Rev. 2011;37:63–74. [DOI] [PMC free article] [PubMed] [Google Scholar]
- 7.Qiao Y, Huang X, Nimmagadda S, et al. A robust approach to enhance tumor-selective accumulation of nanoparticles. Oncotarget. 2011;2:59–68. [DOI] [PMC free article] [PubMed] [Google Scholar]
- 8.Dark GG, Hill SA, Prise VE, Tozer GM, Pettit GR, Chaplin DJ. Combretastatin A-4, an agent that displays potent and selective toxicity toward tumor vasculature. Cancer Res. 1997;57:1829–1834. [PubMed] [Google Scholar]
- 9.Porcu E, Bortolozzi R, Basso G, Viola G. Recent advances in vascular disrupting agents in cancer therapy. Future Med Chem. 2014;6:1485–1498. [DOI] [PubMed] [Google Scholar]
- 10.Ji YT, Liu YN, Liu ZP. Tubulin colchicine binding site inhibitors as vascular disrupting agents in clinical developments. Curr Med Chem. 2015;22:1348–1360. [DOI] [PubMed] [Google Scholar]
- 11.Cesca M, Bizzaro F, Zucchetti M, Giavazzi R. Tumor delivery of chemotherapy combined with inhibitors of angiogenesis and vascular targeting agents. Front Oncol. 2013;3:259. [DOI] [PMC free article] [PubMed] [Google Scholar]
- 12.Tozer GM. Measuring tumour vascular response to antivascular and antiangiogenic drugs. Br J Radiol. 2003;76(Spec No 1):S23–S35. [DOI] [PubMed] [Google Scholar]
- 13.Mason RP, Zhao D, Liu L, Trawick ML, Pinney KG. A perspective on vascular disrupting agents that interact with tubulin: preclinical tumor imaging and biological assessment. Integr Biol (Camb). 2011;3:375–387. [DOI] [PMC free article] [PubMed] [Google Scholar]
- 14.Nathan P, Zweifel M, Padhani AR, et al. Phase I trial of combretastatin A4 phosphate (CA4P) in combination with bevacizumab in patients with advanced cancer. Clin Cancer Res. 2012;18:3428–3439. [DOI] [PubMed] [Google Scholar]
- 15.O’Connor JP, Jackson A, Parker GJ, Roberts C, Jayson GC. Dynamic contrast-enhanced MRI in clinical trials of antivascular therapies. Nat Rev Clin Oncol. 2012;9:167–177. [DOI] [PubMed] [Google Scholar]
- 16.Padhani AR, Liu G, Mu-Koh D, et al. Diffusion-weighted magnetic resonance imaging as a cancer biomarker: consensus and recommendations. Neoplasia. 2009;11:102–125. [DOI] [PMC free article] [PubMed] [Google Scholar]
- 17.Thoeny HC, Ross BD. Predicting and monitoring cancer treatment response with diffusion-weighted MRI. J Magn Reson Imaging. 2010;32:2–16. [DOI] [PMC free article] [PubMed] [Google Scholar]
- 18.Shi C, Liu D, Xiao Z, et al. Monitoring tumor response to anti-vascular therapy using non-contrast intravoxel incoherent motion diffusion-weighted MRI. Cancer Res. 2017;77:3491–3501. [DOI] [PubMed] [Google Scholar]
- 19.Zhao D, Chang CH, Kim JG, Liu H, Mason RP. In vivo near-infrared spectroscopy and magnetic resonance imaging monitoring of tumor response to combretastatin A-4-phosphate correlated with therapeutic outcome. Int J Radiat Oncol Biol Phys. 2011;80:574–581. [DOI] [PMC free article] [PubMed] [Google Scholar]
- 20.Colliez F, Fruytier A-C, Magat J, et al. Monitoring combretastatin A4-induced tumor hypoxia and hemodynamic changes using endogenous MR contrast and DCE-MRI. Magn Reson Med. 2016;75:866–872. [DOI] [PubMed] [Google Scholar]
- 21.Salem A, O’Connor J. Assessment of tumor angiogenesis: dynamic contrast-enhanced MR imaging and beyond. Magn Reson Imaging Clin N Am. 2016;24:45–56. [DOI] [PubMed] [Google Scholar]
- 22.Ferl GZ, Port RE. Quantification of antiangiogenic and antivascular drug activity by kinetic analysis of DCE-MRI data. Clin Pharmacol Ther. 2012;92:118–124. [DOI] [PubMed] [Google Scholar]
- 23.Boyd AS, Zic JA, Abraham JL. Gadolinium deposition in nephrogenic fibrosing dermopathy. J Am Acad Dermatol. 2007;56:27–30. [DOI] [PubMed] [Google Scholar]
- 24.Malayeri AA, Brooks KM, Bryant LH, et al. National Institutes of Health perspective on reports of gadolinium deposition in the brain. J Am Coll Radiol. 2016;13:237–241. [DOI] [PMC free article] [PubMed] [Google Scholar]
- 25.Li Y, Qiao Y, Chen H, et al. Characterization of tumor vascular permeability using natural dextrans and CEST MRI. Magn Reson Med. 2018;79:1001–1009. [DOI] [PMC free article] [PubMed] [Google Scholar]
- 26.Goffeney N, Bulte JW, Duyn J, Bryant LH Jr, van Zijl PC. Sensitive NMR detection of cationic-polymer-based gene delivery systems using saturation transfer via proton exchange. J Am Chem Soc. 2001;123:8628–8629. [DOI] [PubMed] [Google Scholar]
- 27.Ward KM, Aletras AH, Balaban RS. A new class of contrast agents for MRI based on proton chemical exchange dependent saturation transfer (CEST). J Magn Reson. 2000;143:79–87. [DOI] [PubMed] [Google Scholar]
- 28.van Zijl PC, Yadav NN. Chemical exchange saturation transfer (CEST): what is in a name and what isn’t? Magn Reson Med. 2011;65:927–948. [DOI] [PMC free article] [PubMed] [Google Scholar]
- 29.Liu H, Jablonska A, Li Y, et al. Label-free CEST MRI detection of citicoline-liposome drug delivery in ischemic stroke. Theranostics. 2016;6:1588–1600. [DOI] [PMC free article] [PubMed] [Google Scholar]
- 30.Liu G, Banerjee SR, Yang X, et al. A dextran-based probe for the targeted magnetic resonance imaging of tumours expressing prostate-specific membrane antigen. Nat Biomed Eng. 2017;1: 977–982. [DOI] [PMC free article] [PubMed] [Google Scholar]
- 31.Dubick MA, Wade CE. A review of the efficacy and safety of 7.5% NaCl/6% dextran 70 in experimental animals and in humans. J Trauma. 1994;36:323–330. [DOI] [PubMed] [Google Scholar]
- 32.Lejeune FJ. Clinical use of TNF revisited: improving penetration of anti-cancer agents by increasing vascular permeability. J Clin Invest. 2002;110:433–435. [DOI] [PMC free article] [PubMed] [Google Scholar]
- 33.Folli S, Épèlegrin A, Chalandon Y, et al. Tumor-necrosis factor can enhance radio-antibody uptake in human colon carcinoma xenografts by increasing vascular permeability. Int J Cancer. 1993;53:829–836. [DOI] [PubMed] [Google Scholar]
- 34.Agrawal N, Bettegowda C, Cheong I, et al. Bacteriolytic therapy can generate a potent immune response against experimental tumors. Proc Natl Acad Sci U S A. 2004;101:15172–15177. [DOI] [PMC free article] [PubMed] [Google Scholar]
- 35.Liu G, Ali MM, Yoo B, Griswold MA, Tkach JA, Pagel MD. PARACEST MRI with improved temporal resolution. Magn Reson Med. 2009;61:399–408. [DOI] [PMC free article] [PubMed] [Google Scholar]
- 36.Liu G, Gilad AA, Bulte JW, van Zijl PC, McMahon MT. High-throughput screening of chemical exchange saturation transfer MR contrast agents. Contrast Media Mol Imaging. 2010;5: 162–170. [DOI] [PMC free article] [PubMed] [Google Scholar]
- 37.Kim M, Gillen J, Landman BA, Zhou J, van Zijl PC. Water saturation shift referencing (WASSR) for chemical exchange saturation transfer (CEST) experiments. Magn Reson Med. 2009;61:1441–1450. [DOI] [PMC free article] [PubMed] [Google Scholar]
- 38.Ryoo D, Xu X, Li Y, et al. Detection and quantification of hydrogen peroxide in aqueous solutions using chemical exchange saturation transfer. Anal Chem. 2017;89:7758–7764. [DOI] [PMC free article] [PubMed] [Google Scholar]
- 39.Dreher MR, Liu W, Michelich CR, Dewhirst MW, Yuan F, Chilkoti A. Tumor vascular permeability, accumulation, and penetration of macromolecular drug carriers. J Natl Cancer Inst. 2006;98:335–344. [DOI] [PubMed] [Google Scholar]
- 40.Mehvar R, Shepard TL. Molecular-weight-dependent pharma-cokinetics of fluorescein-labeled dextrans in rats. J Pharm Sci. 1992;81:908–912. [DOI] [PubMed] [Google Scholar]
- 41.Matsumura Y Cancer stromal targeting (CAST) therapy. Adv Drug Deliv Rev. 2012;64:710–719. [DOI] [PubMed] [Google Scholar]
- 42.Schmiedl U, Ogan M, Paajanen H, et al. Albumin labeled with Gd-DTPA as an intravascular, blood pool-enhancing agent for MR imaging: biodistribution and imaging studies. Radiology. 1987;162(Pt 1):205–210. [DOI] [PubMed] [Google Scholar]
- 43.Wu X, Feng Y, Jeong EK, Emerson L, Lu ZR. Tumor characterization with dynamic contrast enhanced magnetic resonance imaging and biodegradable macromolecular contrast agents in mice. Pharm Res. 2009;26:2202–2208. [DOI] [PMC free article] [PubMed] [Google Scholar]
- 44.Watanabe N, Niitsu Y, Umeno H, et al. Toxic effect of tumor necrosis factor on tumor vasculature in mice. Cancer Res. 1988;48:2179–2183. [PubMed] [Google Scholar]
- 45.Aicher KP, Dupon JW, White DL, et al. Contrast-enhanced magnetic resonance imaging of tumor-bearing mice treated with human recombinant tumor necrosis factor alpha. Cancer Res. 1990;50:7376–7381. [PubMed] [Google Scholar]
- 46.Mehvar R, Robinson MA, Reynolds JM. Molecular weight dependent tissue accumulation of dextrans: in vivo studies in rats. J Pharm Sci. 1994;83:1495–1499. [DOI] [PubMed] [Google Scholar]
- 47.Zaiss M, Xu J, Goerke S, et al. Inverse Z-spectrum analysis for spillover-, MT-, and T1 -corrected steady-state pulsed CEST-MRI–application to pH-weighted MRI of acute stroke. NMR Biomed. 2014;27:240–252. [DOI] [PMC free article] [PubMed] [Google Scholar]
- 48.Zu Z Towards the complex dependence of MTRasym on T1w in amide proton transfer (APT) imaging. NMR Biomed. 2018;31:e3934. [DOI] [PMC free article] [PubMed] [Google Scholar]
- 49.Chan KW, McMahon MT, Kato Y, et al. Natural D-glucose as a biodegradable MRI contrast agent for detecting cancer. Magn Reson Med. 2012;68:1764–1773. [DOI] [PMC free article] [PubMed] [Google Scholar]
- 50.Rerich E, Zaiss M, Korzowski A, Ladd ME, Bachert P. Relaxation-compensated CEST-MRI at 7 T for mapping of creatine content and pH–preliminary application in human muscle tissue in vivo. NMR Biomed. 2015;28:1402–1412. [DOI] [PubMed] [Google Scholar]
- 51.Zhang X, Lin Y, Gillies RJ. Tumor pH and its measurement. J Nucl Med. 2010;51:1167–1170. [DOI] [PMC free article] [PubMed] [Google Scholar]
- 52.Liu G, Li Y, Sheth VR, Pagel MD. Imaging in vivo extracellular pH with a single paramagnetic chemical exchange saturation transfer magnetic resonance imaging contrast agent. Mol Imaging. 2012;11:47–57. [PMC free article] [PubMed] [Google Scholar]
- 53.Jones KM, Randtke EA, Yoshimaru ES, et al. Clinical translation of tumor acidosis measurements with AcidoCEST MRI. Mol Imaging Biol. 2017;19:617–625. [DOI] [PMC free article] [PubMed] [Google Scholar]


