Abstract
Background
Liver cancer is a common malignant tumor with poor prognosis. The present study sought to identify potential signatures that can predict the prognosis of patients with liver cancer.
Material/Methods
The RNA sequencing (RNA-seq) and clinical information of liver cancer patients were obtained from the Cancer Genome Atlas (TCGA) database. Differentially expressed long noncoding RNAs (lncRNAs), microRNAs (miRNAs), and messenger RNAs (mRNAs) were identified between liver cancer and adjacent normal tissues. After predicting lncRNA–miRNA and miRNA–mRNA pairs using online databases, the competing endogenous RNA (ceRNA) networks were constructed. Furthermore, the prognostic value of these differentially expressed genes was evaluated using univariate and multivariate Cox regression analyses.
Results
After constructing the ceRNA network, 2 lncRNAs small nucleolar RNA host gene 1 (SNHG1) and chromosome 2 open reading frame 48 (C2orf48) with the most nodes were identified. Correlation analysis revealed that SNHG1 was correlated with miR-195 and C2orf48 was correlated with miR-195 and miR-93. High expression of SNHG1, C2orf48, and miR-93 can contribute to poorer clinical outcomes compared to low expression. Furthermore, low miR-195 expression was correlated with shorter survival time than was high expression. SNHG1 and C2orf48 were closely associated with histology grade. Univariate and multivariate Cox regression analyses confirmed that SNHG1 and C2orf48 are risk factors for liver cancer.
Conclusions
Our findings revealed that SNHG1 and C2orf48 possess potential prognostic value and should be considered as possible biomarkers for predicting clinical outcomes for patients with liver cancer.
MeSH Keywords: Gene Regulatory Networks; Liver Neoplasms; Prognosis; RNA, Long Noncoding
Background
Liver cancer is a common malignant tumor, with a 15–17% 5-year survival rate [1,2]. The prognosis of patients with liver cancer is poor due to the high frequency of postoperative recurrence and metastasis [3]. Surgery is still the main treatment strategy. However, liver cancer patients are usually diagnosed at advanced stages, so they often miss the optimal opportunity for surgical resection [4]. Furthermore, liver cancer is highly resistant to conventional chemotherapy and radiation therapy [5–7]. Currently, clinicopathologic prognostic factors include TNM stage, tumor size, microvascular invasion, tumor rupture, underlying cirrhosis, and multifocality [8]. In addition to these traditional clinical prognostic factors, genetic biomarkers are novel indicators of liver cancer diagnosis and prognosis [9]. Molecular biomarkers can help predict patient prognosis [10,11], but there is still a lack of biomarkers for clinical management of liver cancer. Therefore, it is necessary to adopt a comprehensive approach to identify novel tumor biomarkers and explore potential molecular mechanisms.
A large number of noncoding RNAs (ncRNAs), such as miRNAs with 22–25 nucleotides and lncRNAs with over 200 nucleotides, play significant regulatory roles in many diseases, including cancers [12,13]. miRNAs can regulate the expression of target genes at the post-transcriptional level [14]. According to the ceRNA hypothesis, lncRNA acts as a “sponge” of miRNAs, indirectly regulating mRNA function [15]. Genomic profiling of liver cancer using the TCGA database [13] has identified some dysregulated ncRNAs associated with poor prognosis. For example, overexpression of lncRNA HOXD-AS1 competitively binds to miR-130a-3p, which prevents SOX4 from undergoing miRNA-mediated degradation, thereby activating EZH2 and MMP2 expression and promoting liver cancer metastasis [16]. lncRNA MIR31HG inhibits liver cancer proliferation and metastasis via sponging miR-575 to modulate ST7L expression [17]. However, there is incomplete understanding of the role of lncRNAs and miRNAs in liver cancer based on high-throughput detection.
In the present study, using RNA-seq data from TCGA, we constructed the ceRNA regulatory networks. Furthermore, our findings revealed that SNHG1 and C2orf48 are potential biomarkers for predicting clinical outcomes for patients with liver cancer.
Material and Methods
Data processing
The clinical information and RNA-seq data (level 3) of patients with liver cancer were retrieved from the TCGA-Liver Hepatocellular Carcinoma database (TCGA-LIHC; https://tcga-data.nci.nih.gov/tcga/). The RNA-seq data are based on the Illumina HiSeq RNA-seq and Illumina HiSeq miRNA-seq platforms. After removing patients with incomplete clinical information, a total of 389 patients with liver cancer were included in our study. The clinical information included age, sex, histologic grade, clinical stage, risk factors, and neoplasm status.
The gene expression profiles, miRNA data, and clinical information were also downloaded from the TCGA database. The raw RNA-seq reads, including mRNAs, miRNAs, and lncRNAs, were preprocessed and normalized with the trimmed mean of M-values (TMM) method.
Differential expression analysis
The differentially expressed analysis was performed using edgeR package in R [18]. The mRNAs, miRNAs, and lncRNAs with false discovery rate (FDR) <0.05 and |log2 fold change (FC)| ≥2 were considered to be differentially expressed. Volcano plots were plotted using the ggplot2 package in R. The heat map was generated using the pheatmap package in R.
Construction of the ceRNA network
Firstly, differentially expressed lncRNA–miRNA relationships were predicted by miRcode (http://www.mircode.org/) [19]. Then, differentially expressed miRNA targeted mRNA prediction was performed based on TargetScan (http://www.targetscan.org/), miRTarBase (http://mirtarbase.mbc.nctu.edu.tw/) and miRDB (http://www.mirdb.org/) [20,21]. Only differentially expressed mRNAs mentioned by the above 3 databases were considered as targeted differentially expressed mRNAs. After that, the ceRNA network was constructed by matching lncRNA–miRNA and miRNA–mRNA relationships. Finally, the ceRNA network was visualized using the Cytoscape software in R (version 3.5.1; https://cytoscape.org/) [22].
Functional enrichment analysis of differentially expressed mRNAs in the ceRNA network
To explore potential biological processes enriched by differentially expressed mRNAs in the ceRNA network, gene ontology (GO) analysis was performed using the Database for Annotation, Visualization and Integrated Discovery (DAVID) package in R. The GO terms include biological process (BP), cellular component (CC), and molecular function (MF). Furthermore, we accessed the Kyoto Encyclopedia of Genes and Genomes (KEGG) using the ClusterProfiler package in R [23]. P value <0.05 was considered significantly enriched.
Statistical analysis
The correlation between the expression level of lncRNA SNHG1 and patient survival time was assessed by univariate and multivariate Cox regression analysis. Overall survival analysis of differentially expressed mRNAs, miRNAs, and lncRNAs was performed with the Kaplan-Meier method using the survival package in R [24]. P value <0.05 was considered statistically significant.
Results
Identification of differentially expressed mRNAs, miRNAs, and lncRNAs for liver cancer
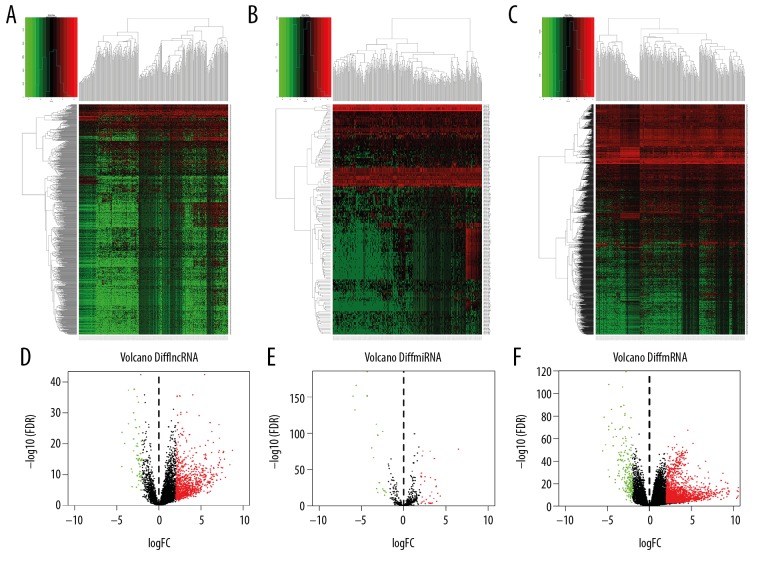
Differential expression analyses of mRNAs, miRNAs, and lncRNAs were performed by comparing liver cancer and normal tissues using the TCGA-LIHC cohort, with FDR <0.05 and |log2FC| ≥2 as the thresholds. There were 1014 upregulated and 57 downregulated lncRNAs, there were 222 upregulated and 28 downregulated miRNAs, and 1717 upregulated and 205 downregulated mRNAs were identified for liver cancer tissues. The heat map clearly displayed the differential expression patterns of lncRNAs, miRNAs, and mRNAs in liver cancer, as shown in Figure 1A–1C. Volcano plots show the distribution of these differentially expressed lncRNAs, miRNAs, and mRNAs in Figure 1D–1F.
Figure 1.
Differentially expressed lncRNAs, miRNAs, and mRNAs in liver cancer. (A–C) Heat maps demonstrate differential expression of lncRNAs, miRNAs, and mRNAs in liver cancer. X axis stands for differentially expressed lncRNAs, miRNAs, and mRNAs and Y axis represents the samples. The expression values are shown in line with the color scale. (D–F) Volcano plots show the differential expression of lncRNAs, miRNAs, and mRNAs in liver cancer. X axis denotes the mean expression differences of lncRNAs, miRNAs, and mRNAs in liver cancer, and Y axis stands for log-transformed FDR values.
ceRNA network construction
After identification of the differentially expressed lncRNAs, miRNAs, and mRNAs in liver cancer, lncRNA–miRNA and miRNA–mRNA relationships were predicted using online databases. lncRNAs can interact with miRNAs through miRNA-response elements (MREs). We first predicted 649 lncRNA–miRNA relationship pairs using the miRcode database, and the miRDB, miRTarBase, and TargetScan databases were used to predict the mRNA targets of miRNAs. Based on integration of results from these 3 databases, 242 common differentially expressed mRNAs were identified (Figure 2).
Figure 2.
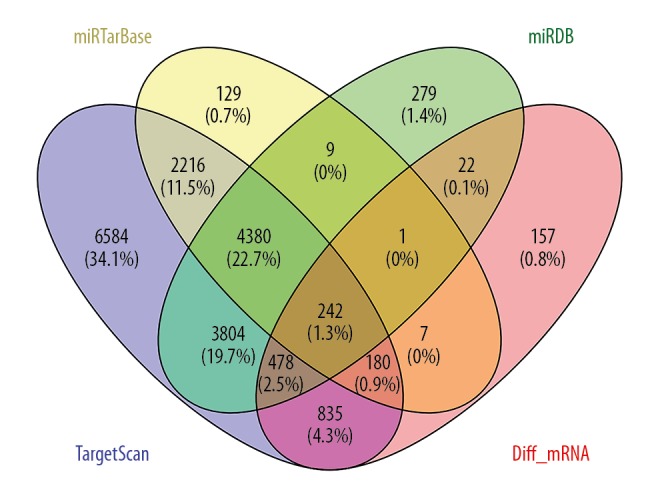
Venn diagram showing 242 common mRNAs. We identified 242 common mRNAs by the intersection of TargetScan, miRTarBase, miRDB and differentially expressed mRNAs.
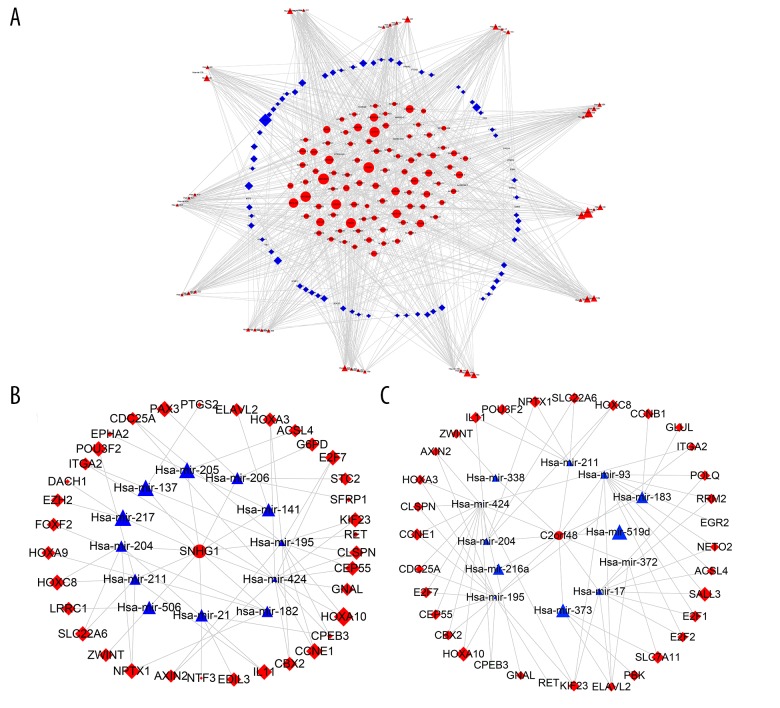
After matching lncRNA–miRNA and miRNA–mRNA relationships, the lncRNA–miRNA–mRNA ceRNA network was built and visualized using Cytoscape (version 3.5.1). There were 94 lncRNAs, 94 mRNAs, and 57 miRNAs in the ceRNA regulatory network (Figure 3A). Then, we extracted the 2 lncRNAs (SNHG1 and C2orf48) with the most nodes in the ceRNA network. In the ceRNA network, SNHG1 had 13 nodes and C2orf48 had 12 nodes. Differential expression analysis results showed that SNHG1 (logFC=2.424595645; p value=3.00E-24; FDR=3.20E-22) and C2orf48 (logFC=2.157457859; p value=5.50E-13; FDR=8.42E-12) were both upregulated in liver cancer tissues (logFC=2.424595645; p value=3.00E-24; FDR=3.20E-22). The SNHG1-regulatory and C2orf48-regulatory ceRNA sub-networks were established. In the SNHG1-regulatory ceRNA sub-network, there were 10 upregulated and 2 downregulated miRNAs, and 28 upregulated and 7 downregulated mRNAs (Figure 3B). In the C2orf48-regulatory ceRNA sub-network, there were 10 upregulated and 2 downregulated miRNAs, and 30 upregulated and 3 downregulated mRNAs (Figure 3C).
Figure 3.
lncRNA-miRNA-mRNA ceRNA regulatory network and sub-networks for liver cancer. (A) The ceRNA regulatory network. (B) SNHG1-centric ceRNA sub-network. (C) C2orf48-centric ceRNA sub-network. Oval represents lncRNAs, triangle stands for miRNAs and diamond denotes mRNAs. Red indicates upregulated genes and green represents downregulated genes.
Functional enrichment analysis
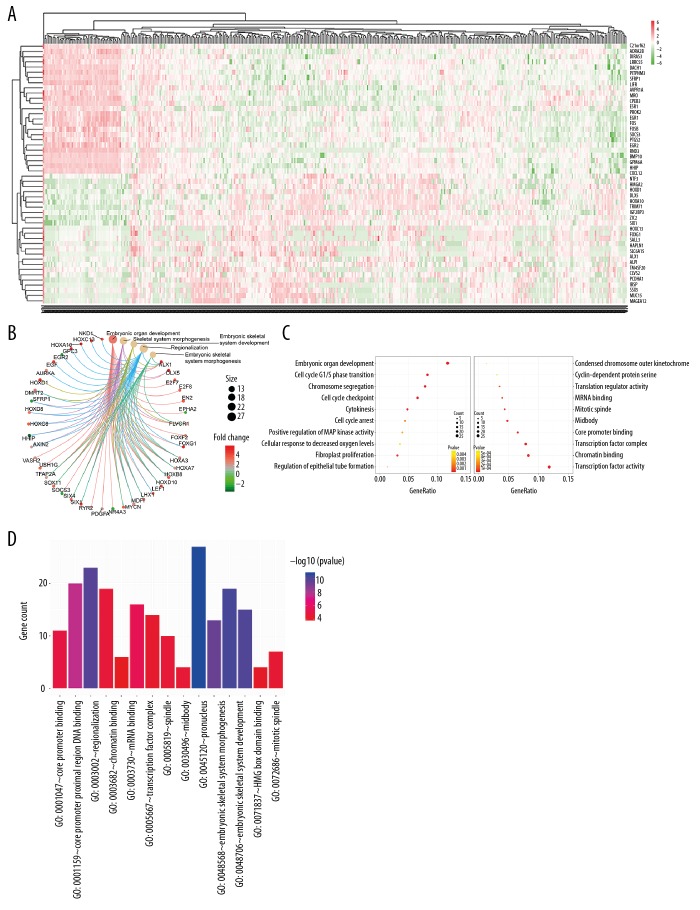
To further explore potential biological processes and pathways enriched by differentially expressed mRNAs in the ceRNA network, functional enrichment analyses were performed. The top 50 mRNAs with the largest fold change are shown in Figure 4A. The top 5 GO terms enriched by differentially expressed mRNAs – embryonic organ development, embryonic skeletal system development, embryonic skeletal system morphogenesis, regionalization and skeletal system morphogenesis – were visualized (Figure 4B). Moreover, the top 5 CC, MF, and BP terms were embryonic organ development, skeletal system morphogenesis, embryonic skeletal system development, regionalization, embryonic skeletal system morphogenesis, transcription factor complex, midbody, pronucleus, mitotic spindle, spindle, core promoter proximal region DNA binding, core promoter binding, chromatin binding, HMG box domain binding, and mRNA binding (Figure 4C, 4D). Moreover, we performed KEGG enrichment analysis of differentially expressed mRNAs in the ceRNA network. The results revealed that these mRNAs were mainly enriched in pathways closely related with liver cancer: cell cycle, pathways in cancer, microRNAs in cancer, p53 signaling pathway, hepatitis B, progesterone-mediated oocyte maturation, PI3K-Akt signaling pathway, transcriptional misregulation in cancer, MAPK signaling pathway, and viral carcinogenesis (Figure 5).
Figure 4.
GO analysis results. (A) The heat map showing the top 50 differentially expressed mRNAs with the largest fold change. (B) The top 5 GO terms enriched by differentially expressed mRNAs. Size of circle represents the number of enriched genes and the expression values are shown in line with the color scale. (C) The cellular component, molecular function, and biological process terms. (D) The top 5 cellular component, molecular function, and biological process terms. GO categories with p value <0.05 were considered statistically significant.
Figure 5.
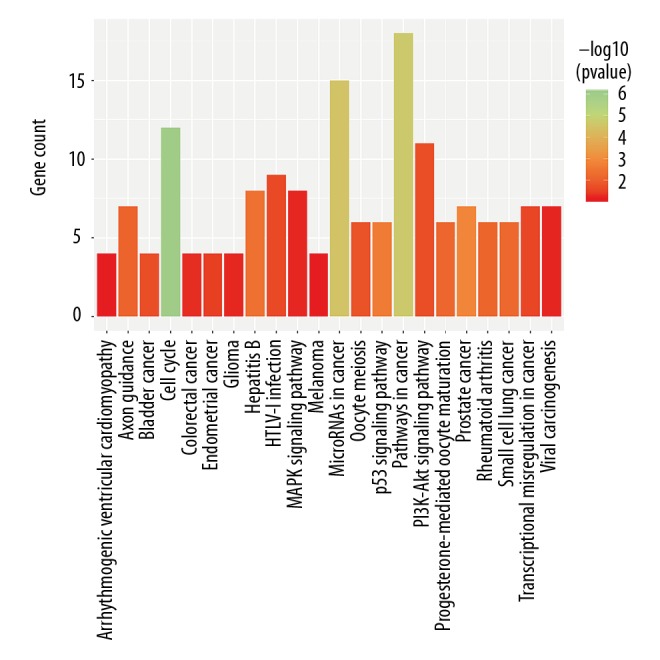
KEGG enrichment analysis results. KEGG pathways with p value <0.05 were considered statistically significant.
Correlations between specific signatures (SNHG1 and C2orf48) and overall survival in liver cancer
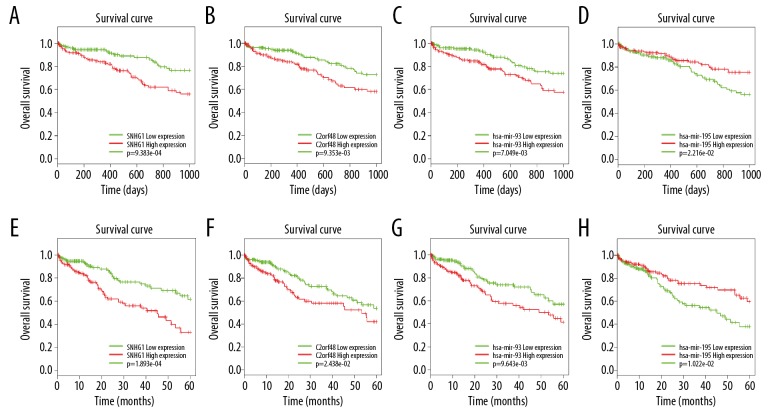
Kaplan-Meier curves were produced to determine the relationships between the differentially expressed mRNAs, lncRNAs, and miRNAs in the ceRNA network. In Figure 6, the high expression of lncRNAs (SNHG1, C2orf48) had shorten survival time than the low expression in 3-year and 5-year survival analysis (Figure 6A–6D). The 2 miRNAs – hsa-miR-195 and hsa-miR-93 – were related to overall survival. High hsa-miR-93 expression was associated with worse clinical outcomes than was low expression in 3-year and 5-year survival analysis (Figure 6E, 6F). hsa-miR-195 expressed at a low level was associated with shorter survival time than was high expression in 3-year and 5-year survival analysis (Figure 6G, 6H).
Figure 6.
Kaplan-Meier survival curves for 3-year and 5-year. (A, B) SNHG1; (C, D) C2orf48; (E, F) hsa-miR-93; (G, H) hsa-miR-195. Log-rank method was used to assess the survival differences between the 2 groups. X axis is overall survival time and Y axis represents survival function.
Upregulated SNHG1 and C2orf48 were associated with clinicopathological characteristics of liver cancer
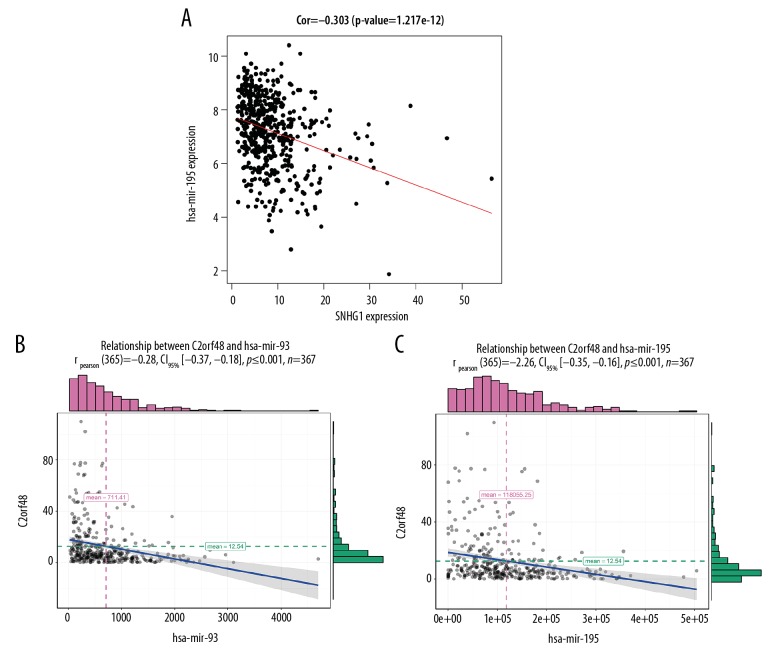
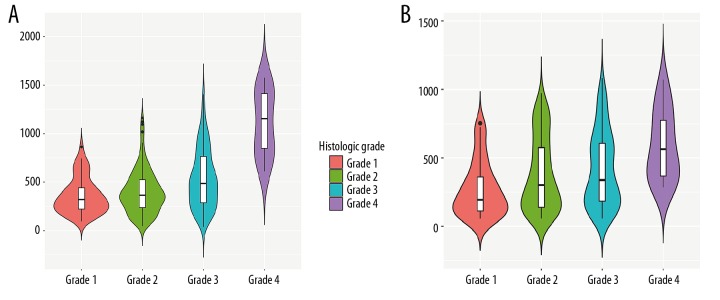
Correlation analysis showed that SNHG1 had a negative correlation with miR-195 (correlation coefficient =−0.303 and p value=1.217e12) (Figure 7A). In addition, C2orf48 had a negative correlation with miR-195 and miR-93 (correlation coefficient=−0.28 and p value ≤0.001; correlation coefficient=−0.26 and p value ≤0.001, respectively) (Figure 7B, 7C). We also found that SNHG1 and C2orf48 were both associated with histologic grade (Figure 8). Table 1 shows the relationship between SNHG1 and clinical features of patients with liver cancer in TCGA. The results showed that SNHG1 expression was closely correlated with histologic grade (p<0.001). Table 2 demonstrates that C2orf48 expression was correlated with histologic grade of liver cancer (p value=0.0385). These results revealed that upregulated SNHG1 and C2orf48 were significantly associated with clinicopathological characteristics of liver cancer.
Figure 7.
Correlation analysis. (A) Correlation between SNHG1 and miR-195. (B) Correlation between C2orf48 and miR-195. (C) Correlation between C2orf48 and miR-93.
Figure 8.
(A, B) Violin plots showing the associations between 2 lncRNAs (SNHG1 and C2orf48) and histologic grade.
Table 1.
The relationship between SNHG1 and clinical features of patients with liver cancer in TCGA-LIHC cohort.
| Clinical features | Cases (n) | SNHG1 expression | P value | |
|---|---|---|---|---|
| Low (n) | High (n) | |||
| SNHG1 expression | 389 | 195 | 194 | |
| Age (years) | 0.05984838 | |||
| ≤60 | 173 | 77 | 96 | |
| >60 | 216 | 118 | 98 | |
| Sex | 0.4990236 | |||
| Male | 254 | 131 | 123 | |
| Female | 135 | 64 | 71 | |
| Histologic grade | p<0.001 | |||
| G1 | 57 | 37 | 20 | |
| G2 | 190 | 110 | 80 | |
| G3 | 129 | 46 | 83 | |
| G4 | 13 | 2 | 11 | |
| Clinical stage | 0.316 | |||
| I | 185 | 86 | 99 | |
| II | 96 | 48 | 48 | |
| IIII | 98 | 54 | 44 | |
| IV | 10 | 7 | 3 | |
| Risk factors | 0.405 | |||
| Alcohol consumption | 104 | 48 | 56 | |
| Non-alcohol consumption | 285 | 147 | 138 | |
| Neoplasm status | 0.503 | |||
| Tumor free | 244 | 126 | 118 | |
| With tumor | 145 | 69 | 76 | |
Table 2.
The relationship between C2orf48 and clinical features of patients with liver cancer in TCGA-LIHC cohort.
| Clinical features | Cases (n) | C2orf48 expression | P value | |
|---|---|---|---|---|
| Low (n) | High (n) | |||
| SNHG1 expression | 389 | 195 | 194 | |
| Age (years) | 0.6439 | |||
| ≤60 | 178 | 86 | 92 | |
| >60 | 211 | 108 | 103 | |
| Sex | 0.1734 | |||
| Male | 259 | 136 | 123 | |
| Female | 130 | 58 | 72 | |
| Histologic grade | 0.0385* | |||
| G1 | 57 | 35 | 22 | |
| G2 | 189 | 100 | 89 | |
| G3 | 128 | 54 | 74 | |
| G4 | 15 | 5 | 10 | |
| Clinical stage | 0.3056 | |||
| I | 185 | 83 | 102 | |
| II | 99 | 54 | 45 | |
| IIII | 95 | 52 | 43 | |
| IV | 10 | 5 | 5 | |
| Risk factors | 0.7579 | |||
| Alcohol consumption | 108 | 52 | 56 | |
| Non-alcohol consumption | 281 | 142 | 139 | |
| Neoplasm status | 0.2228 | |||
| Tumor free | 244 | 128 | 116 | |
| With tumor | 145 | 66 | 79 | |
p value<0.05.
SNHG1 and C2orf48 appear to be risk factors for liver cancer
To investigate whether SNHG1 and C2orf48 are independent risk factors for liver cancer, we performed univariate and multivariate analyses. The results showed that SNHG1 expression was positively associated with liver cancer (HR (95% CI): 0.721 (0.459–0.893); p value=0.032 (Table 3). C2orf48 (HR (95% CI): 1.298 (0.936–1.8), p value=0.041) was associated with prognosis of liver cancer patients (Table 4). Therefore, our results suggest that SNHG1 and C2orf48 are risk factors for liver cancer.
Table 3.
Univariate and multivariate analyses of clinicopathological characteristics and SNHG1 with overall survival for liver cancer patients in TCGA-LIHC cohort.
| Characteristics | Univariate analysis | Multivariate analysis | ||
|---|---|---|---|---|
| HR (95% CI) | P value | HR (95% CI) | P value | |
| Sex (Male vs. Female) | 0.95 (0.732–1.233) | 0.701 | ||
| Age, years (≥median vs. <median) | 1.248 (0.964–1.617) | 0.093 | ||
| Neoplasm status (tumor free vs. with tumor) | 1.498 (1.151–1.949) | 0.003** | 1.401 (1.071–1.832) | 0.014* |
| Risk factors (alcohol consumption vs. non-alcohol consumption) | 1.114 (0.828–1.499) | 0.476 | ||
| Histologic grade (G1+G2 vs. G3+G4) | 1.227 (0.841–1.79) | 0.289 | ||
| Clinical stage (stage I+II vs. stage III+IV) | 1.523 (1.173–1.975) | 0.002** | 1.421 (1.089–1.855) | 0.012* |
| SNHG1 (≥median vs. <median) | 0.819 (0.63–1.065) | 0.014* | 0.721 (0.459–0.893) | 0.032* |
HR – hazard ratio; CI – confidence interval.
p value <0.05;
p value <0.01.
Table 4.
Univariate and multivariate analyses of clinicopathological characteristics and C2orf48 with overall survival for liver cancer patients in TCGA-LIHC cohort.
| Characteristics | Univariate analysis | Multivariate analysis | ||
|---|---|---|---|---|
| HR (95% CI) | P value | HR (95% CI) | P value | |
| Sex (Male vs. Female) | 0.817 (0.603–1.107) | 0.192 | ||
| Age, years (≥median vs. <median) | 1.402 (1.033–1.903) | 0.03* | 1.331 (0.973–1.822) | 0.074 |
| Neoplasm status (tumor free vs. with tumor) | 1.745 (1.277–2.385) | <0.001*** | 1.59 (1.154–2.19) | 0.005** |
| Risk factors (alcohol consumption vs. non-alcohol consumption) | 1.06 (0.759–1.48) | 0.734 | ||
| Histologic grade (G1+G2 vs. G3+G4) | 1.316 (0.853–2.03) | 0.215 | ||
| Clinical stage (stage I+II vs. stage III+IV) | 1.566 (1.151–2.131) | 0.004** | 1.328 (0.965–1.828) | 0.032* |
| C2orf48 (≥median vs. <median) | 1.406 (1.039–1.902) | 0.027* | 1.298 (0.936–1.8) | 0.041* |
HR – hazard ratio; CI – confidence interval.
p value<0.05;
p value<0.01;
p value<0.001.
Discussion
Liver cancer is a common malignant cancer worldwide, but there are no currently known prognostic biomarkers. In our study, we identified SNHG1 and C2orf48 as risk factors for liver cancer based on analysis of the TCGA-LIHC cohort [25].
In the present study, using RNA-seq data of liver cancer, differentially expressed mRNAs, miRNAs, and lncRNAs were identified. After matching the relationship pairs of lncRNA–miRNA and miRNA–mRNA, we constructed the ceRNA network. SNHG1 and C2orf48 with the most nodes were selected to construct the ceRNA sub-networks. KEGG enrichment analysis revealed that the differentially expressed mRNAs in the network were mainly involved in the following pathways: cell cycle, pathways in cancer, microRNAs in cancer, p53 signaling pathway, hepatitis B, PI3K-Akt signaling pathway, transcriptional misregulation in cancer, MAPK signaling pathway, and viral carcinogenesis. It has been confirmed that hepatitis B infection increases the risk of liver cancer [26,27]. Furthermore, the p53 signaling pathway, PI3K-Akt signaling pathway, and MAPK signaling pathway play critical roles in liver cancer [28–30]. Therefore, pathways enriched by differentially expressed mRNAs are closely correlated with liver cancer.
SNHG1 has been confirmed to be associated with large tumor size, poor differentiation, and aggressive BCLC stage. Moreover, highly expressed SNHG1 predicts poor outcomes of patients with liver cancer [31–34]. Our results are consistent with previous studies. In the present study, we found that high SNHG1 expression was associated with worse prognosis than was low expression in 3-year and 5-year survival times. Additionally, we found that the expression level of SNHG1 was only correlated with histologic grade. Univariate and multivariate analyses results suggested that SNHG1 is an independent risk factor for liver cancer. In addition, miR-195 was downregulated in the ceRNA network. Correlation analysis confirmed that SNHG1 had a negative correlation with miR-195, suggesting there is a regulatory relationship between SNHG1 and miR-195. Previous research has reported that miR-195 is downregulated in liver cancer and is inversely correlated with liver tumor size [35–37]. As a tumor suppressor, miR-195 can inhibit liver cancer cell proliferation and migration [35–37]. Consistent with previous research, our results revealed that low-level expression of miR-195 contributed to shorter survival time compared with high expression in 3-year and 5-year follow-up.
The function of lncRNA C2orf48 in liver cancer remains unclear. In this study, we found that C2orf48 was highly expressed in liver cancer, and the 3-year and 5-year overall survival analyses suggested that highly expressed C2orf48 was associated with shorter survival time compared with low expression. We analyzed the relationship between C2orf48 and clinical features with liver cancer patients in the TCGA-LIHC cohort. We found that C2orf48 was correlated with histologic grade of liver cancer, and C2orf48 expression had a positive correlation with histologic grade, which suggests that overexpressed C2orf48 can lead to progression of liver cancer. A previous study has reported that C2orf48 is associated with overall survival in oral squamous cell carcinoma [38]. Intriguingly, it has been confirmed that C2orf48 is significantly associated with liver cancer patient prognosis [39], and this is consistent with our results. Univariate and multivariate analyses showed that C2orf48 is a risk factor for liver cancer.
In the ceRNA regulatory network, we found C2orf48–miR-93 and C2orf48–miR-195 relationship pairs. The correlation analysis revealed that C2orf48 had a negative correlation with miR-93 and miR-195. Therefore, we inferred that miR-195 could be simultaneously regulated by C2orf48 and SNHG1. miR-93 promotes cell proliferation, invasion, and metastasis in liver cancer [40–42]. In the present study, miR-93 was upregulated in liver cancer, and survival analyses confirmed that high miR-93 expression contributes to worse clinical outcomes than its low expression in 3-year and 5-year follow-up.
Taken together, our results show that SNHG1 and C2orf48 are potential biomarkers for predicting clinical outcomes for liver cancer patients. Furthermore, our results suggest that miR-195 is regulated by SNHG1 and C2orf48, and miR-93 is targeted by C2orf48. However, our conclusions need to be verified by further research.
Conclusions
Our results show that SNHG1 and C2orf48 are differentially expressed in liver cancer tissues. Based on the ceRNA network, SNHG1-miR-195 and C2orf48-miR-93 relationships were identified. Survival analysis results revealed that SNHG1 and C2orf48 were correlated with prognosis of liver cancer patients. Univariate and multivariate Cox regression analyses showed that SNHG1 and C2orf48 could be risk factors for liver cancer. Therefore, our findings suggest that SNHG1 and C2orf48 are potential biomarkers for predicting clinical outcomes for patients with liver cancer.
Abbreviations
- RNA-seq
RNA sequencing
- TCGA
the Cancer Genome Atlas
- ncRNAs
noncoding RNAs
- miRNAs
microRNAs
- lncRNAs
long noncoding RNAs
- mRNAs
messenger RNAs
- DAVID
database for annotation, visualization and integrated discovery
- FC
fold change
- GO
gene ontology
- BP
biological process
- CC
cellular component
- MF
molecular function
- KEGG
Kyoto Encyclopedia of Genes and Genomes
- HR
hazard ratio
- CI
confidence interval
- SNHG1
small nucleolar RNA host gene 1
- C2orf48
chromosome 2 open reading frame 48
Footnotes
Source of support: This work was funded by the Natural Science Foundation of Fujian Province (2018J01269, 2019J01198), the Science and Technology Program of Fujian Province (2018Y2003), and the Financial Special Fund of Fujian Province (2016-490)
Conflicts of interest
None.
References
- 1.Zhu CP, Wang AQ, Zhang HH, et al. Research progress and prospects of markers for liver cancer stem cells. World J Gastroenterol. 2015;21:12190–96. doi: 10.3748/wjg.v21.i42.12190. [DOI] [PMC free article] [PubMed] [Google Scholar]
- 2.Miller KD, Goding Sauer A, Ortiz AP, et al. Cancer statistics for Hispanics/Latinos, 2018. Cancer J Clin. 2018;68:425–45. doi: 10.3322/caac.21494. [DOI] [PubMed] [Google Scholar]
- 3.Rao CV, Asch AS, Yamada HY. Frequently mutated genes/pathways and genomic instability as prevention targets in liver cancer. Carcinogenesis. 2017;38:2–11. doi: 10.1093/carcin/bgw118. [DOI] [PMC free article] [PubMed] [Google Scholar]
- 4.Cheng Z, Li X, Ding J. Characteristics of liver cancer stem cells and clinical correlations. Cancer Lett. 2016;379:230–38. doi: 10.1016/j.canlet.2015.07.041. [DOI] [PubMed] [Google Scholar]
- 5.Ahmed KA, Caudell JJ, El-Haddad G, et al. Radiosensitivity differences between liver metastases based on primary histology suggest implications for clinical outcomes after stereotactic body radiation therapy. Int J Radiat Oncol Biol Phys. 2016;95:1399–404. doi: 10.1016/j.ijrobp.2016.03.050. [DOI] [PMC free article] [PubMed] [Google Scholar]
- 6.Teo JY, Allen JC, Ng DCE, et al. Prospective study to determine early hypertrophy of the contra-lateral liver lobe after unilobar, Yttrium-90, selective internal radiation therapy in patients with hepatocellular carcinoma. Surgery. 2018;163:1008–13. doi: 10.1016/j.surg.2017.10.014. [DOI] [PubMed] [Google Scholar]
- 7.Li M, Bu W, Ren J, et al. Enhanced synergism of thermo-chemotherapy for liver cancer with magnetothermally responsive nanocarriers. Theranostics. 2018;8:693–709. doi: 10.7150/thno.21297. [DOI] [PMC free article] [PubMed] [Google Scholar]
- 8.Goh BK, Teo JY, Chan CY, et al. Importance of tumor size as a prognostic factor after partial liver resection for solitary hepatocellular carcinoma: Implications on the current AJCC staging system. J Surg Oncol. 2016;113:89–93. doi: 10.1002/jso.24099. [DOI] [PubMed] [Google Scholar]
- 9.Huang YL, Ning G, Chen LB, et al. Promising diagnostic and prognostic value of E2Fs in human hepatocellular carcinoma. Cancer Manag Res. 2019;11:1725–40. doi: 10.2147/CMAR.S182001. [DOI] [PMC free article] [PubMed] [Google Scholar]
- 10.Song YZ, Li X, Li W, et al. Integrated genomic analysis for prediction of survival for patients with liver cancer using The Cancer Genome Atlas. World J Gastroenterol. 2018;24:3145–54. doi: 10.3748/wjg.v24.i28.3145. [DOI] [PMC free article] [PubMed] [Google Scholar]
- 11.Sia D, Villanueva A, Friedman SL, Llovet JM. Liver cancer cell of origin, molecular class, and effects on patient prognosis. Gastroenterology. 2017;152:745–61. doi: 10.1053/j.gastro.2016.11.048. [DOI] [PubMed] [Google Scholar]
- 12.Qiu L, Tang Q, Li G, Chen K. Long non-coding RNAs as biomarkers and therapeutic targets: Recent insights into hepatocellular carcinoma. Life Sci. 2017;191:273–82. doi: 10.1016/j.lfs.2017.10.007. [DOI] [PubMed] [Google Scholar]
- 13.Huo X, Han S, Wu G, et al. Dysregulated long noncoding RNAs (lncRNAs) in hepatocellular carcinoma: Implications for tumorigenesis, disease progression, and liver cancer stem cells. Mol Cancer. 2017;16:165. doi: 10.1186/s12943-017-0734-4. [DOI] [PMC free article] [PubMed] [Google Scholar]
- 14.Zhang K, Zhang X, Cai Z, et al. A novel class of microRNA-recognition elements that function only within open reading frames. Nat Struct Mol Biol. 2018;25:1019–27. doi: 10.1038/s41594-018-0136-3. [DOI] [PMC free article] [PubMed] [Google Scholar]
- 15.Zhao L, Hu K, Cao J, et al. lncRNA miat functions as a ceRNA to upregulate sirt1 by sponging miR-22-3p in HCC cellular senescence. Aging (Albany NY) 2019;11(17):7098–22. doi: 10.18632/aging.102240. [DOI] [PMC free article] [PubMed] [Google Scholar]
- 16.Wang H, Huo X, Yang XR, et al. STAT3-mediated upregulation of lncRNA HOXD-AS1 as a ceRNA facilitates liver cancer metastasis by regulating SOX4. Mol Cancer. 2017;16:136. doi: 10.1186/s12943-017-0680-1. [DOI] [PMC free article] [PubMed] [Google Scholar]
- 17.Yan S, Tang Z, Chen K, et al. Long noncoding RNA MIR31HG inhibits hepatocellular carcinoma proliferation and metastasis by sponging microRNA-575 to modulate ST7L expression. J Exp Clin Cancer Res. 2018;37:214. doi: 10.1186/s13046-018-0853-9. [DOI] [PMC free article] [PubMed] [Google Scholar]
- 18.Robinson MD, McCarthy DJ, Smyth GK. edgeR: A Bioconductor package for differential expression analysis of digital gene expression data. Bioinformatics. 2010;26:139–40. doi: 10.1093/bioinformatics/btp616. [DOI] [PMC free article] [PubMed] [Google Scholar]
- 19.Jeggari A, Marks DS, Larsson E. miRcode: A map of putative microRNA target sites in the long non-coding transcriptome. Bioinformatics. 2012;28:2062–63. doi: 10.1093/bioinformatics/bts344. [DOI] [PMC free article] [PubMed] [Google Scholar]
- 20.Wang X. miRDB: A microRNA target prediction and functional annotation database with a wiki interface. RNA. 2008;14:1012–17. doi: 10.1261/rna.965408. [DOI] [PMC free article] [PubMed] [Google Scholar]
- 21.Wang Z, Liu Y. Predicting functional microRNA-mRNA interactions. Methods Mol Biol. 2017;1580:117–26. doi: 10.1007/978-1-4939-6866-4_10. [DOI] [PubMed] [Google Scholar]
- 22.Shannon P, Markiel A, Ozier O, et al. Cytoscape: A software environment for integrated models of biomolecular interaction networks. Genome Res. 2003;13:2498–504. doi: 10.1101/gr.1239303. [DOI] [PMC free article] [PubMed] [Google Scholar]
- 23.Yu G, Wang LG, Han Y, He QY. clusterProfiler: An R package for comparing biological themes among gene clusters. Omics. 2012;16:284–87. doi: 10.1089/omi.2011.0118. [DOI] [PMC free article] [PubMed] [Google Scholar]
- 24.Mihaly Z, Kormos M, Lanczky A, et al. A meta-analysis of gene expression-based biomarkers predicting outcome after tamoxifen treatment in breast cancer. Breast Cancer Res Treat. 2013;140:219–32. doi: 10.1007/s10549-013-2622-y. [DOI] [PubMed] [Google Scholar]
- 25.Jiao Y, Li Y, Lu Z, Liu Y. High trophinin-associated protein expression is an independent predictor of poor survival in liver cancer. Dig Dis Sci. 2019;64:137–43. doi: 10.1007/s10620-018-5315-x. [DOI] [PubMed] [Google Scholar]
- 26.Liu Z, Dai X, Wang T, et al. Hepatitis B virus PreS1 facilitates hepatocellular carcinoma development by promoting appearance and self-renewal of liver cancer stem cells. Cancer Lett. 2017;400:149–60. doi: 10.1016/j.canlet.2017.04.017. [DOI] [PubMed] [Google Scholar]
- 27.Liu X, Baecker A, Wu M, et al. Interaction between tobacco smoking and hepatitis B virus infection on the risk of liver cancer in a Chinese population. Int J Cancer. 2018;142:1560–67. doi: 10.1002/ijc.31181. [DOI] [PMC free article] [PubMed] [Google Scholar]
- 28.Tang B, Liang W, Liao Y, et al. PEA15 promotes liver metastasis of colorectal cancer by upregulating the ERK/MAPK signaling pathway. Oncol Rep. 2019;41:43–56. doi: 10.3892/or.2018.6825. [DOI] [PMC free article] [PubMed] [Google Scholar] [Retracted]
- 29.Lin Q, Ling YB, Chen JW, et al. Circular RNA circCDK13 suppresses cell proliferation, migration and invasion by modulating the JAK/STAT and PI3K/AKT pathways in liver cancer. Int J Oncol. 2018;53:246–56. doi: 10.3892/ijo.2018.4371. [DOI] [PubMed] [Google Scholar]
- 30.Dhar D, Antonucci L, Nakagawa H, et al. Liver cancer initiation requires p53 onhibition by CD44-enhanced growth factor signaling. Cancer Cell. 2018;33:1061–77. doi: 10.1016/j.ccell.2018.05.003. [DOI] [PMC free article] [PubMed] [Google Scholar]
- 31.Zhang H, Zhou D, Ying M, et al. Expression of long non-coding RNA (lncRNA) small nucleolar RNA host gene 1 (SNHG1) exacerbates hepatocellular carcinoma through suppressing miR-195. Med Sci Monit. 2016;22:4820–29. doi: 10.12659/MSM.898574. [DOI] [PMC free article] [PubMed] [Google Scholar] [Retracted]
- 32.Gao S, Xu X, Wang Y, et al. Diagnostic utility of plasma lncRNA small nucleolar RNA host gene 1 in patients with hepatocellular carcinoma. Mol Med Rep. 2018;18:3305–13. doi: 10.3892/mmr.2018.9336. [DOI] [PMC free article] [PubMed] [Google Scholar]
- 33.Zhu Q, Yang H, Cheng P, Han Q. Bioinformatic analysis of the prognostic value of the lncRNAs encoding snoRNAs in hepatocellular carcinoma. Biofactors. 2019;45:244–52. doi: 10.1002/biof.1478. [DOI] [PubMed] [Google Scholar]
- 34.Zhang M, Wang W, Li T, et al. Long noncoding RNA SNHG1 predicts a poor prognosis and promotes hepatocellular carcinoma tumorigenesis. Biomed Pharmacother. 2016;80:73–79. doi: 10.1016/j.biopha.2016.02.036. [DOI] [PubMed] [Google Scholar]
- 35.Liu D, Zhu Y, Pang J, et al. Knockdown of long non-coding RNA MALAT1 inhibits growth and motility of human hepatoma cells via modulation of miR-195. J Cell Biochem. 2018;119:1368–8. doi: 10.1002/jcb.26297. [DOI] [PubMed] [Google Scholar]
- 36.He M, Zhang W, Dong Y, et al. Pro-inflammation NF-kappaB signaling triggers a positive feedback via enhancing cholesterol accumulation in liver cancer cells. J Exp Clin Cancer Res. 2017;36:15. doi: 10.1186/s13046-017-0490-8. [DOI] [PMC free article] [PubMed] [Google Scholar]
- 37.Ding J, Huang S, Wang Y, et al. Genome-wide screening reveals that miR-195 targets the TNF-alpha/NF-kappaB pathway by down-regulating IkappaB kinase alpha and TAB3 in hepatocellular carcinoma. Hepatology. 2013;58:654–66. doi: 10.1002/hep.26378. [DOI] [PubMed] [Google Scholar]
- 38.Li S, Chen X, Liu X, et al. Complex integrated analysis of lncRNAs-miRNAs-mRNAs in oral squamous cell carcinoma. Oral Oncol. 2017;73:1–9. doi: 10.1016/j.oraloncology.2017.07.026. [DOI] [PubMed] [Google Scholar]
- 39.Yue C, Ren Y, Ge H, et al. Comprehensive analysis of potential prognostic genes for the construction of a competing endogenous RNA regulatory network in hepatocellular carcinoma. Onco Targets Ther. 2019;12:561–76. doi: 10.2147/OTT.S188913. [DOI] [PMC free article] [PubMed] [Google Scholar]
- 40.Raskob GE, van Es N, Verhamme P, et al. Edoxaban for the treatment of cancer-associated venous thromboembolism. N Engl J Med. 2018;378:615–24. doi: 10.1056/NEJMoa1711948. [DOI] [PubMed] [Google Scholar]
- 41.Xue X, Wang X, Zhao Y, et al. Exosomal miR-93 promotes proliferation and invasion in hepatocellular carcinoma by directly inhibiting TIMP2/TP53INP1/CDKN1A. Biochem Biophys Res Commun. 2018;502:515–21. doi: 10.1016/j.bbrc.2018.05.208. [DOI] [PubMed] [Google Scholar]
- 42.Ji C, Liu H, Yin Q, et al. miR-93 enhances hepatocellular carcinoma invasion and metastasis by EMT via targeting PDCD4. Biotechnol Lett. 2017;39:1621–29. doi: 10.1007/s10529-017-2403-5. [DOI] [PubMed] [Google Scholar]


