

Abstract
PURPOSE
Children’s Oncology Group (COG) AALL0331 tested whether intensified postinduction therapy that improves survival in children with high-risk B-cell acute lymphoblastic leukemia (ALL) would also improve outcomes for those with standard-risk (SR) ALL.
PATIENTS AND METHODS
AALL0331 enrolled 5,377 patients between 2005 and 2010. All patients received a 3-drug induction with dexamethasone, vincristine, and pegaspargase (PEG) and were then classified as SR low, SR average, or SR high. Patients with SR-average disease were randomly assigned to receive either standard 4-week consolidation (SC) or 8-week intensified augmented Berlin-Frankfurt-Münster (BFM) consolidation (IC). Those with SR-high disease were nonrandomly assigned to the full COG-augmented BFM regimen, including 2 interim maintenance and delayed intensification phases.
RESULTS
The 6-year event-free survival (EFS) rate for all patients enrolled in AALL0331 was 88.96% ± 0.46%, and overall survival (OS) was 95.54% ± 0.31%. For patients with SR-average disease, the 6-year continuous complete remission (CCR) and OS rates for SC versus IC were 87.8% ± 1.3% versus 89.1% ± 1.2% (P = .52) and 95.8% ± 0.8% versus 95.2% ± 0.8% (P = 1.0), respectively. Those with SR-average disease with end-induction minimal residual disease (MRD) of 0.01% to < 0.1% had an inferior outcome compared with those with lower MRD and no improvement with IC (6-year CCR: SC, 77.5% ± 4.8%; IC, 77.1% ± 4.8%; P = .71). At 6 years, the CCR and OS rates among 635 nonrandomly treated patients with SR-high disease were 85.55% ± 1.49% and 92.97% ± 1.08%, respectively.
CONCLUSION
The 6-year OS rate for > 5,000 children with SR ALL enrolled in AALL0331 exceeded 95%. The addition of IC to treatment for patients with SR-average disease did not improve CCR or OS, even in patients with higher MRD, in whom it might have been predicted to provide more value. The EFS and OS rates are excellent for this group of patients with SR ALL, with particularly good outcomes for those with SR-high disease.
INTRODUCTION
Acute lymphoblastic leukemia (ALL) is the most common childhood malignancy. Clinical trials have improved event-free survival (EFS) and overall survival (OS) for the National Cancer Institute (NCI) standard-risk (SR) subgroup of patients (age 1-9.99 years; initial WBC < 50,000/μL) by adding postinduction intensification blocks, which improved survival in patients with NCI high-risk (HR) disease.1-7 Patients in the predecessor Children’s Cancer Group (CCG) 1991 SR ALL trial with a good early morphologic response to induction chemotherapy had a 5-year EFS of 90.7% and OS of 96.0%.8 Given these data, it is important to balance attempts to improve outcome with treatment intensification against risk of additional toxicities.
With the development of improved risk stratification, Children’s Oncology Group (COG) AALL0331 was designed to test graduated intensifications in children with NCI SR B-cell ALL (B-ALL), with the goal of improving EFS and OS without unacceptable added toxicity.9 Patients received a 3-drug, 4-week dexamethasone-based induction and were risk stratified at the end of induction therapy into SR-low, SR-average, and SR-high subgroups based on presence of favorable or unfavorable sentinel somatic genetic lesions, early response assessed by both bone marrow morphology and end-induction minimal residual disease (MRD), and presence of CNS leukemia at diagnosis.9-13 Patients with SR-average disease were randomly assigned to receive the standard 4-week low-intensity oral consolidation regimen from CCG 1991 or the augmented consolidation shown to improve EFS of patients with HR ALL in CCG 1882 and 1961.7,8,14 Patients with SR-high ALL were nonrandomly assigned to receive full augmented postinduction therapy with 2 interim maintenance (IM) and delayed intensification (DI) phases, whereas those with SR-low disease received the CCG/COG SR ALL backbone with or without intensified pegaspargase (PEG) therapy.7,8,15 This report describes the overall outcome of COG AALL0331, the results of the SR-average random assignment, and the outcome for patients with SR-high disease. SR-low results will be reported separately.
PATIENTS AND METHODS
Patients with newly diagnosed SR B-ALL were eligible for AALL0331. CNS status was defined based on CSF obtained before beginning therapy as CNS1 (no blasts on cytospin), CNS2 (CSF WBC < 5/μL with blasts on cytospin), or CNS3 (CSF WBC ≥ 5/μL with blasts on cytospin and/or clinical signs of CNS involvement). Traumatic lumbar punctures were evaluated with the Steinherz/Bleyer algorithm to determine CNS2 or 3.16 AALL0331 was approved by the NCI Central Institutional Review Board and the institutional review boards of participating institutions. Informed consent for study participation was obtained from a parent or guardian before starting protocol therapy in accordance with US Department of Health and Human Services guidelines, with a second consent for postinduction random assignment.
Induction Therapy and Risk Group Stratification
Eligible patients received a 3-drug induction with intrathecal (IT) cytarabine on day 1; weekly intravenous (IV) vincristine (VCR) for 4 doses; oral dexamethasone for 28 days; 1 dose of intramuscular PEG on day 4, 5, or 6; and IT methotrexate (MTX) for 2 to 4 doses (Table 1). Bone marrow (BM) aspiration was performed on days 8 and 15 (if the day-8 marrow was M2/M3) to determine response by local morphology, and MRD testing was performed at day 29 using flow cytometry at 1 of 2 COG reference laboratories.17 Rapid early response (RER) was defined as < 5% BM blasts (M1) by day 15 based on local morphologic interpretation and an M1 BM with MRD < 0.1% at day 29. Slow early responders (SERs) had an M2 (5%-25%) or M3 (> 25%) BM on day 15 and/or positive MRD (≥ 0.1% to < 1%) at day 29. For patients with M3 marrow at day 29, induction was considered to have failed, and they were taken off protocol therapy. Patients with an M2 marrow or an M1 marrow with MRD ≥ 1% at day 29 received an extended induction with 2 additional weeks of therapy and continued on study as SERs if they achieved day-43 M1 marrow and MRD < 1%. Those not achieving these criteria were removed from protocol therapy. All patients were initially required to have central testing for triple trisomies of chromosomes 4, 10, and 17 (TT) and BCR-ABL1, ETV6-RUNX1, or KMT2A rearrangement (KMT2A-R) using fluorescence in situ hybridization; this practice was performed at approved local laboratories, with central review after 2007.
TABLE 1.
Overview of Therapy for AALL0331

After induction, patients were classified into 1 of 3 risk groups: SR low (RER, CNS1, and favorable cytogenetics of TT or ETV6-RUNX1 fusion), SR average (no unfavorable genetic features [BCR-ABL1, KMT2A-R, or hypodiploidy with < 44 chromosomes], RER, and CNS1 or 2 [patients with favorable genetics who were RERs and CNS2]), or SR high (KMT2A-R and RER, anyone with CNS3 at diagnosis, and SERs by morphology or MRD, along with a subset of patients with defined steroid pretreatment; Fig 1). Patients with overt testicular leukemia were not eligible. Patients with BCR-ABL1 fusion or hypodiploidy did not continue to receive therapy after induction. Patients with Down syndrome were included in the random assignment.
FIG 1.

CONSORT diagram. *Incorrect consent/missing informed consent at study entry (12), incorrect diagnosis (12), incorrect timing to the start of therapy (12), no/insufficient samples (11), no testicular exam prior to enrollment (5), ineligible for classification study (4), received prior therapy before enrolling on this study (3), IRB record issues (3), started therapy prior to enrolling on classification study (2), samples not sent to an approved cytogenetics lab (2), no CNS status determined at enrollment (2), no repeat diagnostic marrow within a week prior to enrollment (1), no signature on the short consent in patient’s native language (1). COG, Children’s Oncology Group; HR, high risk; IA, IC with AIM and ADI; IS, IC and standard IM/DI; LRA, low-risk with additional doses of pegaspargase; LRS, low-risk standard; LTFU, lost to follow-up; SA, SC with AIM and ADI; SMN, second malignant neoplasm; SS, SC and standard DI/IM.
Risk-Adjusted Postinduction Therapy
Patients with SR-low disease were randomly assigned to regimens with or without 4 additional doses of PEG at approximately 3-week intervals, with the backbone of standard consolidation (SC) and initially standard IM with weekly oral MTX. After the amendment (described in “Amendments That Changed Protocol Therapy”), the IM backbone changed to IV escalating MTX. All patients with SR-low disease received standard DI and maintenance (Table 1).
Patients with SR-average disease were randomly assigned initially in a 2-by-2 factorial design to 1 of 4 treatment regimens: SS (SC and standard IM and DI), SA (SC with intensified IM [AIM] and DI [ADI]), IS (intensified consolidation [IC] and standard IM/DI), and IA (IC, AIM, and ADI). IC was identical to the augmented Berlin-Frankfurt-Münster (BFM) consolidation used in COG AALL0232,18 AIM was identical to the Capizzi-style escalating IV MTX and PEG, and DI incorporated additional doses of VCR and PEG, as used in CCG 1961 and AALL0232.14,18
Patients with SR-high disease were nonrandomly assigned to receive full augmented BFM therapy, as administered in CCG 1961, including IC, AIM1, ADI1, AIM2, ADI2, and maintenance.14 CNS3 patients underwent 18-Gy cranial irradiation. In all arms of AALL0331, the length of therapy from the start of IM1 was 2 years for girls and 3 years for boys.
Amendments That Changed Protocol Therapy
In 2008, the results of CCG 1991 became available, showing that escalating IV MTX without leucovorin rescue improved EFS compared with standard IM with oral MTX.8 AALL0331 amendment 2C replaced the oral MTX IM phase with escalating IV MTX for all patients with SR-average disease. This change affected evaluation of the IM intensification question but retained the SR-average randomized question between standard and augmented consolidation (SS IV [SC] v IS IV [IC]). All patients with SR-average disease received IM with IV escalating MTX and standard DI. This amendment also changed dexamethasone administration in DI to discontinuous dosing (days 1-7 and 15-21), rather than a continuous schedule (days 1-21), because of increased rates of osteonecrosis in AALL0232 with continuous dexamethasone during DI.18
When the results of AALL0232 demonstrated that high-dose MTX was superior to Capizzi MTX,18 amendment 7 (May 2011) changed therapy for patients with SR-high disease who had not yet begun maintenance cycle 2. They then received an additional IM phase with high-dose MTX.
Toxicity Assessment
Adverse events and clinically significant laboratory findings were collected using NCI Common Terminology Criteria for Adverse Events (CTCAE; version 3.0) until December 2010, when the reporting was changed to version 4.0 and prior CTCAE (version 3.0) data were mapped to CTCAE (version 4.0). Additional reporting was done through the NCI Adverse Event Expedited Reporting System. Required reporting included all nonhematologic nontargeted toxicities of grade ≥ 3, all hematologic and nonhematologic toxicities that resulted in hospitalization or delay in therapy of ≥ 1 week, all nontargeted CNS toxicities of grade ≥ 2, peripheral neuropathies of any grade, and all cases of osteonecrosis (avascular necrosis) of grade ≥ 1 confirmed by imaging.
Statistical Analysis
Patients were randomly or nonrandomly assigned to postinduction therapy based on end-induction risk assignment. EFS was defined as time from enrollment to first event (induction failure, death during induction, death in remission, relapse, or second malignant neoplasm) or date of last contact for those who were event free. OS was calculated as time from enrollment to death or last contact for those who were alive. CCR was defined as time from random assignment to first event (relapse, death in remission, or second malignant neoplasm) or last contact for those who were event free. The SR-average random assignment (1:1 using permuted blocks) was designed to enroll 1,450 patients, with the aim of a 5% improvement in CCR from 86% to 91% (relative hazard rate, 0.6253; 4-year minimum follow-up, α = 5% [1-sided test]; expected event horizon, 147). The upper efficacy stopping boundaries used the α(time)2 spending function. The lower futility boundaries were based on testing the alternative hypothesis at the 0.005 level.19 The cumulative power to detect a difference by the last (fourth) interim analysis was 89.6%. If a difference of that relative hazard size exists, there is an approximately 43% chance of stopping at the second interim analysis and approximately 73% chance of stopping at the third interim analysis. The event horizon was achieved, and the randomization results were released by the data monitoring committee. A total of 594 patients with SR-high disease enrolled during this time would allow estimation of 6-year CCR and OS rates, with a maximum standard error of 2.1%. Survival rates were estimated using the Kaplan-Meier method, with standard errors of Peto et al.20 Survival curves were compared using the log-rank test. Cumulative incidence rates were computed using the cumulative incidence function for competing risks, and comparisons between groups were conducted using the K-sample test.21,22 Comparison of proportions used the χ2 test or Fisher’s exact test. All analyses were performed using SAS software (version 9.4; SAS Institute, Cary, NC). Graphics were generated using R software (version 3.0.1; http://www.r-project.org).
RESULTS
Patients
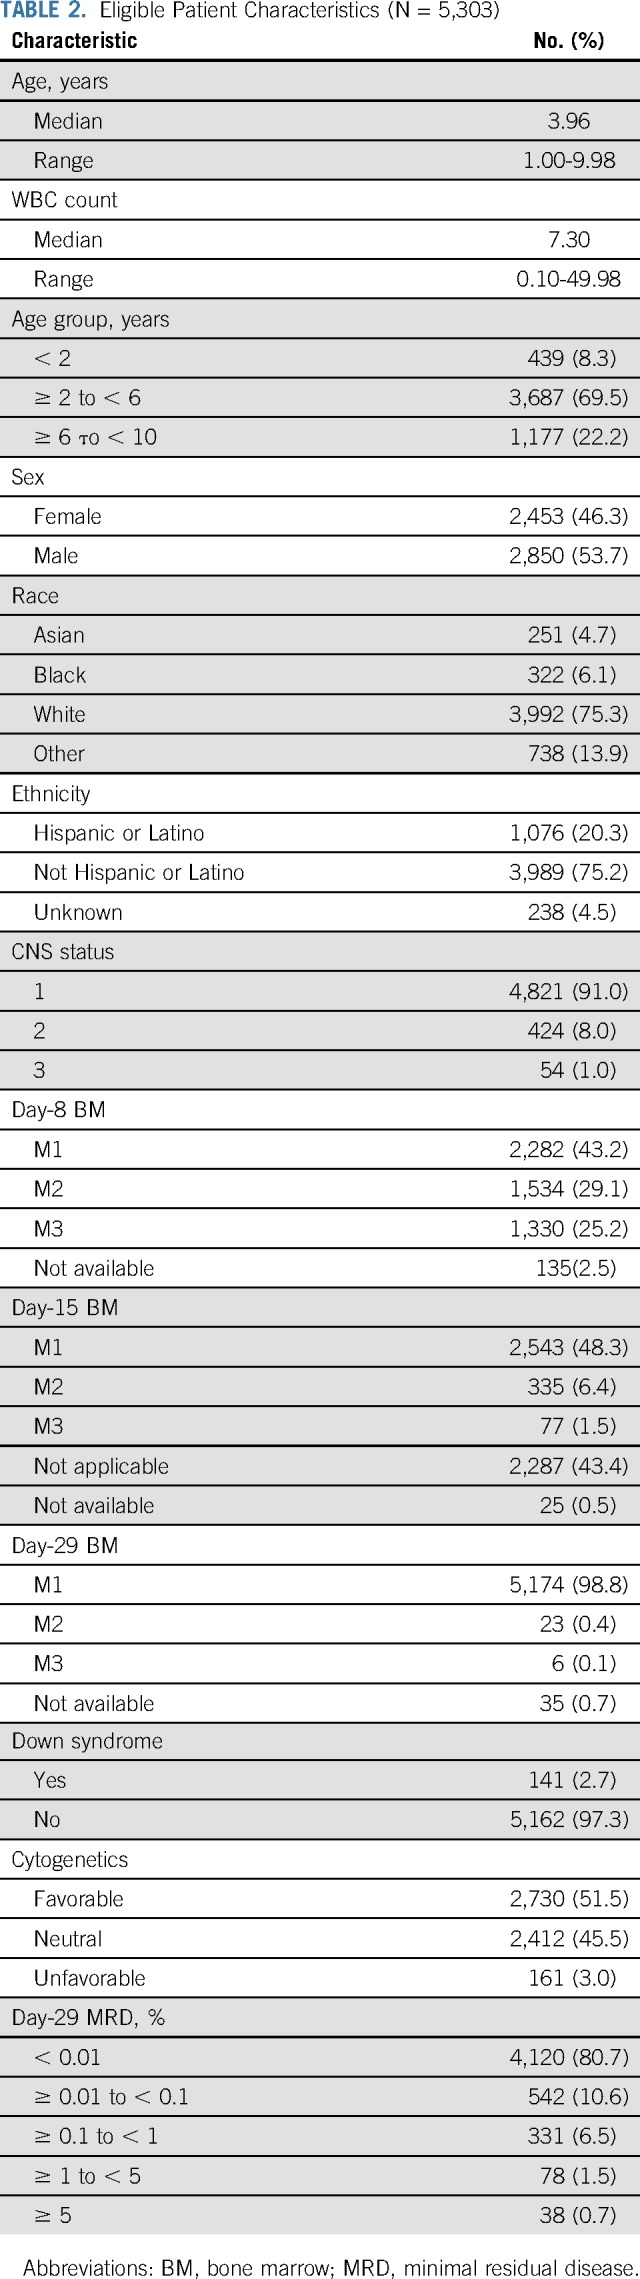
AALL0331 enrolled 5,377 patients between April 2005 and May 2010. Data current as of June 30, 2017, are included in this report. Seventy patients were ineligible, 4 were not evaluable for induction, and 259 were not evaluable for postinduction therapy (very HR [VHR] feature, n = 131; death during induction, n = 25; induction failures, n = 39; Fig 1). A total of 5,303 patients were eligible and evaluable for induction, with 5,044 eligible and evaluable for postinduction therapy; 1,052 patients ended protocol-directed therapy at the end of induction, most (86%) because they refused further protocol therapy; 3,992 patients continued with postinduction therapy (SR low, n = 1,857; SR average, n = 1,500; and SR high, n = 635). Characteristics of the 5,303 eligible and evaluable patients are listed in Table 2. Median age was 3.96 years, and 54% were boys; 91% of patients were CNS1, 8% CNS2, and 1% CNS3; median WBC was 7,300/μL.
TABLE 2.
Eligible Patient Characteristics (N = 5,303)
Overall Outcome
Twenty-five patients died during induction (0.47%). Of the remaining 5,278 patients, 5,171 (98.0%) had an M1 marrow at day 29. For all eligible and evaluable patients in AALL0331, the 6-year EFS and OS rates were 88.96% ± 0.46% and 95.54% ± 0.31%, respectively (Fig 2). Ten-year outcomes were similar: EFS, 87.28% ± 1.03% and OS, 94.33% ± 0.72%. The 6-year cumulative incidence of isolated CNS relapse was 2.04% ± 0.20%, isolated BM relapse was 4.47% ± 0.29%, and combined relapse was 0.84% ± 0.13%.
FIG 2.

Event-free survival (EFS) and overall survival (OS; 6-year EFS, 88.96% ± 0.46%; 6-year OS, 95.54% ± 0.31%).
IC Does Not Improve Outcome in SR-Average B-ALL
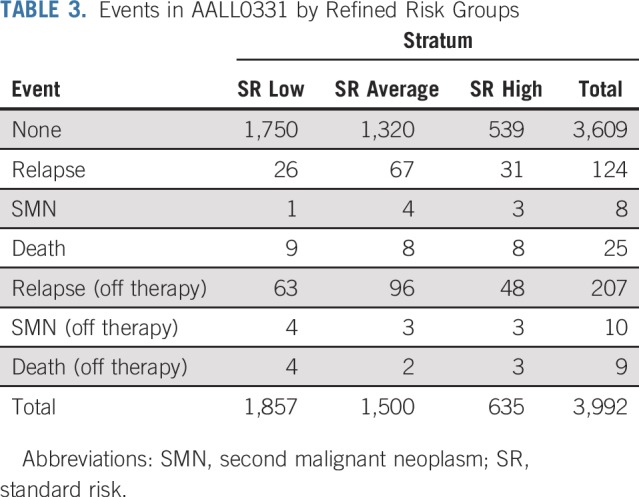
A total of 1,500 patients with SR-average disease were randomly assigned, 745 to SC and 755 to IC. The 6-year CCR rate for those randomly assigned to SC was 87.8% ± 1.3%, as compared with 89.1% ± 1.2% for those randomly assigned to IC (P = .52; Fig 3A). These patients had 180 events (Table 3), including 163 relapses, 7 second malignancies, and 10 deaths in remission. The 6-year OS rate was 95.78% ± 0.79% with SC and 95.15% ± 0.83% with IC (P = 1.0; Fig 3B). The 6-year CCR rates for SC versus IC before amendment 2C were 86.10% ± 1.68% versus 89.69% ± 1.45% (P = .086) and 91.06% ± 1.94% versus 87.96% ± 2.19% (P = .15) after amendment 2C.
FIG 3.

Random assignment of patients in standard-risk average (SR-average) group by consolidation regimen. Comparison of (A) complete continuous remission (CCR; 6-year CCR for standard consolidation [SC], 87.8% ± 1.3% v 89.1% ± 1.2% for intensive consolidation [IC]; P = .52) and (B) overall survival (OS) rates (6-year OS, 95.78% ± 0.79% for SC v 95.15% ± 0.83% for IC; P = 1.0).
TABLE 3.
Events in AALL0331 by Refined Risk Groups
Newer data from COG have refined the definition of SR-average B-ALL as follows: patients with day-8 peripheral blood MRD < 1% and end-induction MRD < 0.01%; this definition was used in the recent COG AALL0932 trial (ClinicalTrials.gov identifier NCT01190930). The impact of SC versus IC was reassessed using this refined definition (n = 540 patients), with overall SR-average 6-year CCR and OS rates of 91.23% ± 1.31% and 97.49% ± 0.72%, respectively. IC also provided no benefit to this subgroup, with a 6-year CCR rate for SC versus IC of 90.8% ± 1.9% versus 91.6% ± 1.8% (P = .99) and 6-year OS rate of 97.62% ± 1.01% with SC versus 97.36% ± 1.03% with IC (P = .655; Appendix Figs A1A and A1B, online only). The 6-year CCR rates using the refined definition for SC versus IC before amendment 2C were 88.48% ± 3.13% versus 93.46% ± 2.33% (P = .31) and 92.78% ± 2.35% versus 90.05% ± 2.63% (P = .35) after amendment 2 (Appendix Figs A2A and A2B, online only).
Because they were considered SR average in the AALL0331 classification system, but not in the refined AALL0932 classification system, we looked specifically at the outcome of those with SR-average disease with end-induction MRD of 0.01% to < 0.1%. As expected, this group (n = 179) had a less favorable outcome than those with MRD < 0.01%, with 6-year CCR and OS rates of 77.25% ± 3.39% and 91.42% ± 2.25%, respectively. However, there was no benefit for IC in this subset, with a 6-year CCR of 77.46% ± 4.79% for SC versus 77.07% ± 4.80% for IC (P = .71).
The 6-year cumulative incidences of isolated CNS, BM, and combined relapses for the SR-average group were 3.09% ± 0.45%, 5.18% ± 0.59%, and 1.2% ± 0.29%, respectively. There was no significant difference in these rates based on SC versus IC (isolated CNS, 3.91% ± 0.88% v 3.62% ± 0.84%; P = .82; isolated BM, 5.88% ± 1.08% v 4.69% ± 0.96%; P = .50; combined, 1.48% ± 0.56% v 1.03% ± 0.46%; P = .53).
The IC regimen was associated with significantly more hematologic and infectious toxicities, with an incidence of grade 3 to 4 neutropenia in SC of 12.7%, compared with 62% (P < .0001) in the IC regimen. Similarly, the incidence of febrile neutropenia was 2.8% with SC versus 29% with IC (P < .0001); incidence of other infections was 4.7% versus 23% (P < .0001). However, there was no excess nonrelapse mortality, with 2 deaths in the SC group and 1 death in the IC group.
Patients With SR-High Disease Fare Well With Augmented BFM Therapy
Among 635 patients with SR-high disease nonrandomly assigned to receive augmented BFM therapy, the 6-year CCR rate was 85.55% ± 1.49% and 6-year OS rate was 92.97% ± 1.08% (Figs 4A and 4B). These patients had 96 events (Table 3).
FIG 4.

In standard-risk high (SR-high) group, (A) complete continuous remission (CCR; 6-year CCR, 85.55% ± 1.49%) and (B) overall survival (OS) rates (6-year OS, 92.97% ± 1.08%).
For patients classified as SERs because of day-29 MRD ≥ 0.1%, the 6-year CCR and OS rates were 80.42% ± 2.28% and 90.52% ± 1.68%, respectively. Patients who were CNS3 had 6-year CCR and OS rates of 84.43% ± 6.53% and 92.86% ± 4.61%, respectively. For patients with SR-high disease, the 6-year cumulative incidence of isolated CNS relapse was 2.73% ± 0.65%; isolated BM relapse, 7.38% ± 1.06%; and combined relapse, 0.65% ± 0.32%.
Nonrelapse Mortality
An additional 25 deaths in remission occurred among 3,992 patients (0.63%) during postinduction protocol therapy, 5 during IC (SR high), 2 during IM (SR low), 7 during DI (standard DI, n = 6; ADI, n = 1), 1 during ADI2 (SR high), 1 during IM2 (SR high), and 9 during maintenance.
DISCUSSION
Patients with NCI SR ALL comprise two thirds of children with B-ALL.23 Although intensifications that improve outcome for those with NCI HR disease often improve EFS and OS for those at SR, the morbidity of intensified treatment must be balanced with the overall high cure rate in patients with SR disease.1,2,4,6,24-31 For this reason, COG has elected to treat patients at SR with a 3-drug induction and allocate intensive blocks of postinduction therapy based on the risk of relapse, now defined by sentinel somatic genetic abnormalities and early treatment response.9,10 The United Kingdom group has taken a similar approach,30 but most other major groups in high-income countries worldwide administer a 4-drug induction, intensive consolidation, and high-dose MTX to most children with ALL.32,33
This report describes results of a strategy to study postinduction treatment intensification among > 5,000 children with SR B-ALL. Overall outcomes were outstanding, with 10-year EFS and OS rates of 87.28% ± 1.03% and 94.33% ± 0.72%, respectively. Surprisingly, the intensive augmented BFM consolidation that COG has found to be highly effective in improving outcome of patients at HR7,14 did not improve EFS or OS for the children with SR-ALL and RER to therapy (the SR-average group) studied here. This is an important result, indicating that many children can be spared the toxicities associated with IC without compromising a survival benefit. These results also have implications for treatment of children with ALL in low- or middle-income countries.
Another important finding of this study is that patients with SR-average disease with low-level end-induction MRD (≥ 0.01% to < 0.1%) had an inferior outcome compared with those with MRD < 0.01%.10,13,17,34 Moreover, IC did not improve this outcome, potentially because these patients only received 1 aspect of the augmented BFM regimen, whereas those with SR-high disease received multiple intensifications. Notably, the outcome of patients with SR-high disease with MRD ≥ 0.1%, whose treatment was intensified beyond consolidation, was at least as good as that of the patients with SR-average disease with low-level MRD randomly assigned to IC. On the basis of these results, COG now treats all patients with day-29 MRD ≥ 0.01% with several intensified phases of postinduction therapy.
Several treatment amendments occurred during the study that may have influenced results. In 2008, after the outcome results of CCG 1991 were unblinded, the AALL0331 IM phase was amended for patients with SV-average disease to include escalating IV MTX rather than weekly oral MTX.8 Interestingly, there was a trend toward better EFS and OS in those with SV-average disease in the IC arm before amendment 2A, but no such trend remained after amendment 2A.
One important difference between AALL0331 and the CCG 1991 trial is that the patients with SR-low and SR-average disease in AALL0331 received only 1 IM phase, as compared with 2 IM phases in CCG 1991.8 Because of the MRD data used for risk group classification in AALL0331, it is hard to definitively compare results; however, the outcome for patients with SR-low and SR-average disease in AALL0331 was quite favorable with this approach.
Although patients with SR-high disease had a favorable outcome with the augmented BFM therapy administered postinduction in COG AALL0331, this outcome was inferior to that in the rest of the patients at SR. Almost all of the patients with SR-high disease would now be treated with even more intensive therapy, including high-dose MTX with leucovorin rescue.18
In summary, patients with newly diagnosed NCI SR ALL and rapid response to induction did not benefit from a 2-month postinduction phase of IC therapy. On the basis of these results, along with those from CCG 1991, the current COG treatment of patients with end-induction MRD < 0.01% includes SC and 2 IM phases with escalating IV MTX and VCR that flank DI.8 Patients with SR ALL who respond more slowly to induction have excellent outcomes treated postinduction with full augmented BFM-based therapy. The current COG approach to these latter patients is treatment on HR or VHR protocols. Taken together, these results suggest that further intensifying conventional therapy will not improve cure rates and that novel approaches are needed.
ACKNOWLEDGMENT
M.L.L. is the University of California San Francisco Benioff Chair of Children’s Health and Deborah and Arthur Ablin Endowed Chair in Pediatric Molecular Oncology. S.P.H. is the Jeffrey E. Perelman Distinguished Chair in the Department of Pediatrics at the Children’s Hospital of Philadelphia.
Appendix
FIG A1.

Standard-risk average group: limited to those with day-8 minimal residual disease (MRD) < 1% and day-29 MRD < 0.01% by consolidation regimen. (A) Complete continuous remission (CCR; 6-year CCR for standard consolidation [SC] v intensified consolidation [IC], 90.8% ± 1.9% v 91.6% ± 1.8%; P = .99) and (B) overall survival (OS) rates (6-year OS for SC v IC, 97.62% ± 1.01% v 97.36% ± 1.03%; P = .655).
FIG A2.

Standard-risk average group (6-year complete continuous remission [CCR] limited to those with day-8 minimal residual disease [MRD] < 1% and day-29 MRD < 0.01%) by (A) consolidation regimen before amendment 2C (88.48% ± 3.13% v 93.46% ± 2.33%; P = .31) and (B) consolidation regimen after amendment 2C (92.78% ± 2.35% v 90.05% ± 2.63%; P = .35).
Footnotes
Presented in abstract form at the 55th Annual Meeting of the American Hematology Society, New Orleans, LA, December 7-13, 2013; 27th Annual Meeting of the American Society of Pediatric Hematology/Oncology (ASPHO), Chicago, IL, May 14-17, 2014; and 29th ASPHO Annual Meeting, Minneapolis, MN, May 11-14, 2016.
Supported by Grants No. U10 CA98543, U10 CA98413, U10 CA180886, 1U24-CA196173, U10CA180886, and U10 CA180899 from the National Institutes of Health and by St Baldrick’s Foundation.
AUTHOR CONTRIBUTIONS
Conception and design: Kelly W. Maloney, Meenakshi Devidas, Leonard A. Mattano, Alison M. Friedmann, Michael J. Borowitz, Nina Kadan-Lottick, Mignon L. Loh, Yousif H. Matloub, David T. Marshall, Linda C. Stork, Elizabeth A. Raetz, Stephen P. Hunger, William L. Carroll, Naomi J. Winick
Provision of study material or patients: David T. Marshall, Naomi J. Winick
Collection and assembly of data: Kelly W. Maloney, Meenakshi Devidas, Leonard A. Mattano, Alison M. Friedmann, Patrick Buckley, Michael J. Borowitz, Andrew J. Carroll, Julie M. Gastier-Foster, Nyla A. Heerema, Nina Kadan-Lottick, Mignon L. Loh, Brent Wood, Stephen P. Hunger
Data analysis and interpretation: Kelly W. Maloney, Meenakshi Devidas, Cindy Wang, Leonard A. Mattano, Alison M. Friedmann, Michael J. Borowitz, Julie M. Gastier-Foster, Nina Kadan-Lottick, Mignon L. Loh, Linda C. Stork, Elizabeth A. Raetz, Brent Wood, Stephen P. Hunger, William L. Carroll, Naomi J. Winick
Manuscript writing: All authors
Final approval of manuscript: All authors
Accountable for all aspects of the work: All authors
AUTHORS' DISCLOSURES OF POTENTIAL CONFLICTS OF INTEREST
Outcome in Children With Standard-Risk B-Cell Acute Lymphoblastic Leukemia: Results of Children’s Oncology Group Trial AALL0331
The following represents disclosure information provided by authors of this manuscript. All relationships are considered compensated unless otherwise noted. Relationships are self-held unless noted. I = Immediate Family Member, Inst = My Institution. Relationships may not relate to the subject matter of this manuscript. For more information about ASCO's conflict of interest policy, please refer to www.asco.org/rwc or ascopubs.org/journal/jco/site/ifc.
Open Payments is a public database containing information reported by companies about payments made to US-licensed physicians (Open Payments).
Meenakshi Devidas
Honoraria: PSI, Novartis
Leonard A. Mattano
Stock and Other Ownership Interests: Pfizer, Pfizer (I), Amgen, Amgen (I), Monsanto, Monsanto (I)
Consulting or Advisory Role: Pfizer, Pfizer (I), Novartis, Melinta Therapeutics (I), Melinta Therapeutics
Michael J. Borowitz
Research Funding: Becton Dickinson
Travel, Accommodations, Expenses: Beckman Coulter
Julie M. Gastier-Foster
Research Funding: Bristol-Myers Squibb (Inst), Incyte (Inst)
Nina Kadan-Lottick
Consulting or Advisory Role: Medtronic (I), Boston Scientific (I)
Mignon L. Loh
Consulting or Advisory Role: MediSix Therapeutics
Yousif H. Matloub
Employment: Takeda
David T. Marshall
Leadership: First String Research
Stock and Other Ownership Interests: First String Research
Consulting or Advisory Role: Isoray Medical
Elizabeth A. Raetz
Research Funding: Pfizer (Inst)
Brent Wood
Honoraria: Amgen, Seattle Genetics, AbbVie, Janssen
Research Funding: Amgen (Inst), Seattle Genetics (Inst), Pfizer (Inst), Juno Therapeutics (Inst), BiolineRx (Inst), Biosight (Inst), Stemline Therapeutics (Inst)
Travel, Accommodations, Expenses: Amgen
Stephen P. Hunger
Stock and Other Ownership Interests: Amgen, Merck (I), Amgen (I), Pfizer (I)
Honoraria: Amgen
Consulting or Advisory Role: Novartis
William L. Carroll
Other Relationship: Amgen
No other potential conflicts of interest were reported.
REFERENCES
- 1.Hunger SP, Lu X, Devidas M, et al. Improved survival for children and adolescents with acute lymphoblastic leukemia between 1990 and 2005: A report from the Children’s Oncology Group. J Clin Oncol. 2012;30:1663–1669. doi: 10.1200/JCO.2011.37.8018. [DOI] [PMC free article] [PubMed] [Google Scholar]
- 2.Gaynon PS, Bleyer WA, Steinherz PG, et al. Modified BFM therapy for children with previously untreated acute lymphoblastic leukemia and unfavorable prognostic features: Report of Children’s Cancer Study Group study CCG-193P. Am J Pediatr Hematol Oncol. 1988;10:42–50. doi: 10.1097/00043426-198821000-00009. [DOI] [PubMed] [Google Scholar]
- 3.Eden OB, Harrison G, Richards S, et al. Long-term follow-up of the United Kingdom Medical Research Council protocols for childhood acute lymphoblastic leukaemia, 1980-1997. Leukemia. 2000;14:2307–2320. doi: 10.1038/sj.leu.2401962. [DOI] [PubMed] [Google Scholar]
- 4.Chessells JM, Bailey C, Richards SM. Intensification of treatment and survival in all children with lymphoblastic leukaemia: Results of UK Medical Research Council trial UKALL X. Lancet. 1995;345:143–148. doi: 10.1016/s0140-6736(95)90164-7. [DOI] [PubMed] [Google Scholar]
- 5.Schrappe M, Reiter A, Zimmermann M, et al. Long-term results of four consecutive trials in childhood ALL performed by the ALL-BFM study group from 1981 to 1995: Berlin-Frankfurt-Münster. Leukemia. 2000;14:2205–2222. doi: 10.1038/sj.leu.2401973. [DOI] [PubMed] [Google Scholar]
- 6.Lange BJ, Bostrom BC, Cherlow JM, et al. Double-delayed intensification improves event-free survival for children with intermediate-risk acute lymphoblastic leukemia: A report from the Children’s Cancer Group. Blood. 2002;99:825–833. doi: 10.1182/blood.v99.3.825. [DOI] [PubMed] [Google Scholar]
- 7.Nachman JB, Sather HN, Sensel MG, et al. Augmented post-induction therapy for children with high-risk acute lymphoblastic leukemia and a slow response to initial therapy. N Engl J Med. 1998;338:1663–1671. doi: 10.1056/NEJM199806043382304. [DOI] [PubMed] [Google Scholar]
- 8.Matloub Y, Bostrom BC, Hunger SP, et al. Escalating intravenous methotrexate improves event-free survival in children with standard-risk acute lymphoblastic leukemia: A report from the Children’s Oncology Group. Blood. 2011;118:243–251. doi: 10.1182/blood-2010-12-322909. [DOI] [PMC free article] [PubMed] [Google Scholar]
- 9.Schultz KR, Pullen DJ, Sather HN, et al. Risk- and response-based classification of childhood B-precursor acute lymphoblastic leukemia: A combined analysis of prognostic markers from the Pediatric Oncology Group (POG) and Children’s Cancer Group (CCG) Blood. 2007;109:926–935. doi: 10.1182/blood-2006-01-024729. [DOI] [PMC free article] [PubMed] [Google Scholar]
- 10.Borowitz MJ, Devidas M, Hunger SP, et al. Clinical significance of minimal residual disease in childhood acute lymphoblastic leukemia and its relationship to other prognostic factors: A Children’s Oncology Group study. Blood. 2008;111:5477–5485. doi: 10.1182/blood-2008-01-132837. [DOI] [PMC free article] [PubMed] [Google Scholar]
- 11.Hunger SP, Loh ML, Whitlock JA, et al. Children’s Oncology Group’s 2013 blueprint for research: Acute lymphoblastic leukemia. Pediatr Blood Cancer. 2013;60:957–963. doi: 10.1002/pbc.24420. [DOI] [PMC free article] [PubMed] [Google Scholar]
- 12.Teachey DT, Hunger SP. Predicting relapse risk in childhood acute lymphoblastic leukaemia. Br J Haematol. 2013;162:606–620. doi: 10.1111/bjh.12442. [DOI] [PubMed] [Google Scholar]
- 13.Borowitz MJ, Pullen DJ, Shuster JJ, et al. Minimal residual disease detection in childhood precursor-B-cell acute lymphoblastic leukemia: Relation to other risk factors—A Children’s Oncology Group study. Leukemia. 2003;17:1566–1572. doi: 10.1038/sj.leu.2403001. [DOI] [PubMed] [Google Scholar]
- 14.Seibel NL, Steinherz PG, Sather HN, et al. Early postinduction intensification therapy improves survival for children and adolescents with high-risk acute lymphoblastic leukemia: A report from the Children’s Oncology Group. Blood. 2008;111:2548–2555. doi: 10.1182/blood-2007-02-070342. [DOI] [PMC free article] [PubMed] [Google Scholar]
- 15.Stork LC, Matloub Y, Broxson E, et al. Oral 6-mercaptopurine versus oral 6-thioguanine and veno-occlusive disease in children with standard-risk acute lymphoblastic leukemia: Report of the Children’s Oncology Group CCG-1952 clinical trial. Blood. 2010;115:2740–2748. doi: 10.1182/blood-2009-07-230656. [DOI] [PMC free article] [PubMed] [Google Scholar]
- 16.Steinherz PG, Gaynon P, Miller DR, et al. Improved disease-free survival of children with acute lymphoblastic leukemia at high risk for early relapse with the New York regimen: A new intensive therapy protocol—A report from the Children’s Cancer Study Group. J Clin Oncol. 1986;4:744–752. doi: 10.1200/JCO.1986.4.5.744. [DOI] [PubMed] [Google Scholar]
- 17.Borowitz MJ, Wood BL, Devidas M, et al. Prognostic significance of minimal residual disease in high risk B-ALL: A report from Children’s Oncology Group study AALL0232. Blood. 2015;126:964–971. doi: 10.1182/blood-2015-03-633685. [DOI] [PMC free article] [PubMed] [Google Scholar]
- 18.Larsen EC, Devidas M, Chen S, et al. Dexamethasone and high-dose methotrexate improve outcome for children and young adults with high-risk B-acute lymphoblastic leukemia: A report from Children’s Oncology Group study AALL0232. J Clin Oncol. 2016;34:2380–2388. doi: 10.1200/JCO.2015.62.4544. [DOI] [PMC free article] [PubMed] [Google Scholar]
- 19.Freidlin B, Korn EL. A comment on futility monitoring. Control Clin Trials. 2002;23:355–366. doi: 10.1016/s0197-2456(02)00218-0. [DOI] [PubMed] [Google Scholar]
- 20.Peto R, Pike MC, Armitage P, et al. Design and analysis of randomized clinical trials requiring prolonged observation of each patient: II. Analysis and examples. Br J Cancer. 1977;35:1–39. doi: 10.1038/bjc.1977.1. [DOI] [PMC free article] [PubMed] [Google Scholar]
- 21.Kaplan E, Meier P. Nonparametric estimation from incomplete observations. J Am Stat Assoc. 1958;53:457–481. [Google Scholar]
- 22.Gray R. A class of K-sample tests for comparing the cumulative incidence of a competing risk. Ann Stat. 1988;1141:1154. [Google Scholar]
- 23.Smith M, Bleyer A, Crist W, et al. Uniform criteria for childhood acute lymphoblastic leukemia risk classification. J Clin Oncol. 1996;14:680–681. doi: 10.1200/JCO.1996.14.2.680. [DOI] [PubMed] [Google Scholar]
- 24.Locatelli F, Valsecchi MG, Möricke A, et al. Protocol II vs protocol III given twice during reinduction therapy in children with medium-risk ALL. Blood. 2017;130:2146–2149. doi: 10.1182/blood-2017-05-782086. [DOI] [PubMed] [Google Scholar]
- 25.Möricke A, Zimmermann M, Valsecchi MG, et al. Dexamethasone vs prednisone in induction treatment of pediatric ALL: Results of the randomized trial AIEOP-BFM ALL 2000. Blood. 2016;127:2101–2112. doi: 10.1182/blood-2015-09-670729. [DOI] [PubMed] [Google Scholar]
- 26.Pieters R, de Groot-Kruseman H, Van der Velden V, et al. Successful therapy reduction and intensification for childhood acute lymphoblastic leukemia based on minimal residual disease monitoring: Study ALL10 from the Dutch Childhood Oncology Group. J Clin Oncol. 2016;34:2591–2601. doi: 10.1200/JCO.2015.64.6364. [DOI] [PubMed] [Google Scholar]
- 27.Place AE, Stevenson KE, Vrooman LM, et al. Intravenous pegylated asparaginase versus intramuscular native Escherichia coli L-asparaginase in newly diagnosed childhood acute lymphoblastic leukaemia (DFCI 05-001): A randomised, open-label phase 3 trial. Lancet Oncol. 2015;16:1677–1690. doi: 10.1016/S1470-2045(15)00363-0. [DOI] [PubMed] [Google Scholar]
- 28.Pui CH, Campana D, Pei D, et al. Treating childhood acute lymphoblastic leukemia without cranial irradiation. N Engl J Med. 2009;360:2730–2741. doi: 10.1056/NEJMoa0900386. [DOI] [PMC free article] [PubMed] [Google Scholar]
- 29.Schrappe M, Bleckmann K, Zimmermann M, et al. Reduced-intensity delayed intensification in standard-risk pediatric acute lymphoblastic leukemia defined by undetectable minimal residual disease: Results of an international randomized trial (AIEOP-BFM ALL 2000) J Clin Oncol. 2018;36:244–253. doi: 10.1200/JCO.2017.74.4946. [DOI] [PubMed] [Google Scholar]
- 30.Vora A, Goulden N, Wade R, et al. Treatment reduction for children and young adults with low-risk acute lymphoblastic leukaemia defined by minimal residual disease (UKALL 2003): A randomised controlled trial. Lancet Oncol. 2013;14:199–209. doi: 10.1016/S1470-2045(12)70600-9. [DOI] [PubMed] [Google Scholar]
- 31.Vora A, Goulden N, Mitchell C, et al. Augmented post-remission therapy for a minimal residual disease-defined high-risk subgroup of children and young people with clinical standard-risk and intermediate-risk acute lymphoblastic leukaemia (UKALL 2003): A randomised controlled trial. Lancet Oncol. 2014;15:809–818. doi: 10.1016/S1470-2045(14)70243-8. [DOI] [PubMed] [Google Scholar]
- 32.Pui CH, Yang JJ, Hunger SP, et al. Childhood acute lymphoblastic leukemia: Progress through collaboration. J Clin Oncol. 2015;33:2938–2948. doi: 10.1200/JCO.2014.59.1636. [DOI] [PMC free article] [PubMed] [Google Scholar]
- 33.Bartram J, Wade R, Vora A, et al. Excellent outcome of minimal residual disease-defined low-risk patients is sustained with more than 10 years follow-up: Results of UK paediatric acute lymphoblastic leukaemia trials 1997-2003. Arch Dis Child. 2016;101:449–454. doi: 10.1136/archdischild-2015-309617. [DOI] [PubMed] [Google Scholar]
- 34.Gupta S, Devidas M, Loh ML, et al. Flow-cytometric vs. -morphologic assessment of remission in childhood acute lymphoblastic leukemia: A report from the Children’s Oncology Group (COG) Leukemia. 2018;32:1370–1379. doi: 10.1038/s41375-018-0039-7. [DOI] [PMC free article] [PubMed] [Google Scholar]