

Light-sensitive regulators were engineered to control genetic induction of CAR expression in T cells for cancer immunotherapy.
Abstract
T cells engineered to express chimeric antigen receptors (CARs) can recognize and engage with target cancer cells with redirected specificity for cancer immunotherapy. However, there is a lack of ideal CARs for solid tumor antigens, which may lead to severe adverse effects. Here, we developed a light-inducible nuclear translocation and dimerization (LINTAD) system for gene regulation to control CAR T activation. We first demonstrated light-controllable gene expression and functional modulation in human embryonic kidney 293T and Jurkat T cell lines. We then improved the LINTAD system to achieve optimal efficiency in primary human T cells. The results showed that pulsed light stimulations can activate LINTAD CAR T cells with strong cytotoxicity against target cancer cells, both in vitro and in vivo. Therefore, our LINTAD system can serve as an efficient tool to noninvasively control gene activation and activate inducible CAR T cells for precision cancer immunotherapy.
INTRODUCTION
Adoptive cell transfer using patient-derived T cells engineered ex vivo with chimeric antigen receptors (CARs) has emerged as a promising therapeutic strategy for cancer treatment (1, 2). Upon antigen engagement, CAR T cells can initiate antitumor cytokine production and target tumor cell killing (3). Meanwhile, CAR T cells can be stimulated to proliferate exponentially, resulting in a highly amplified T cell response and elimination of tumor cells within weeks (4). However, extensive research has revealed the limitations of CAR T cell–based immunotherapy (5, 6). First, CAR T cells may recognize and engage with normal cells expressing target antigens even at low levels (7, 8). This on-target off-tumor toxicity is especially lethal when the infused CAR T cells are activated by the normal cells expressing low levels of target antigens in the heart, liver, or lung, potentially leading to death (9). Second, even with specific tumor targeting, cytokine release syndrome and tumor lysis syndrome can occur following a large dosage of CAR T cell infusion (10). Furthermore, it remains a challenge to predict the optimal number of cells to infuse due to variations of T cell responses, persistence, and side effects in different patients (11). Hence, there is a great need to engineer CAR T cells that can be controlled with high precision in space and time.
To this end, suicide switches and inhibitory corticosteroids have been applied to disable the infused CAR T cells in case of an adverse event (12, 13). However, these off-switches are designed to permanently down-regulate the activity of CAR T cells, which will limit the desired tumor killing. Alternatively, split CARs have been engineered to assemble into fully functional CARs in the presence of a small-molecule drug (3). Inhibitory CARs (iCARs), synNotch, and an elegant split, universal, and programmable (SUPRA) CAR were also developed (14–16) to provide more control over the timing and dosage of CAR T therapy (13). However, these small molecule–based dimerization strategies lack confined tissue specificity, largely due to the diffusion of the small molecules. The temporal resolution is also limited by the time required for cell permeation and diffusion, which is partly attributed to the difficulty in delivering these molecules to specific tissue sites for in vivo studies (17). By contrast, genetically encoded dimerizers using photoreceptors can allow localized, noninvasive, and reversible control of protein-protein interactions by light with high spatiotemporal resolution, making them ideal candidates for gene regulatory systems (18–22).
We therefore aimed to develop controllable on-switch CAR T cells, which can be activated by light stimulation at a confined tissue space, addressing the critical issue of “on-target, off-tumor” in CAR T immunotherapy. Red or infrared light systems have deep tissue penetration due to their long wavelengths and would be ideal for therapeutic applications (22). However, most of them require exogenous supply of chromophore or expression of several bacterial or plant enzymes (20, 23, 24). Moreover, our initial tests with the PhyB-PIF6 red light system (20) did not achieve robust light-activatable gene expression, preventing us from using these systems. We then switched to the blue light–based CRY2-CIB1 system, which has been reported to be rapid, reversible, and highly sensitive to blue light stimulation and is suitable for controlling gene expression (17–19, 25, 26). However, the CRY2 (cryptochrome 2)–CIB1 (cryptochrome-interacting basic-helix-loop-helix 1) pair has a high background in heterodimerization. Here, we developed a light-inducible nuclear translocation and dimerization (LINTAD) gene activation system, integrating the CRY2-CIB1 pair in combination with the LOV2 (light-oxygen-voltage-sensing domain 2)–based light-inducible nuclear localization signal (NLS) biLINuS to reduce the intrinsic background noise from the nonspecific CRY2 and CIB1 dimerization. We demonstrated that the LINTAD system with pulsed light stimulation patterns can regulate the expression of various target functional genes in multiple mammalian cell lines. Moreover, we improved the LINTAD system to achieve optimal gene regulations at low copy numbers of genetic cassettes, a condition compatible for cellular functions in primary human T cells. These T cells engineered with improved LINTAD system and inducible CAR achieved noninvasive control of tumor cell killing both in vitro and in vivo. The LINTAD system developed in this work can hence be used as a general tool for gene regulation, with applications in controllable cell-based cancer immunotherapy.
RESULTS
Design of the light-inducible translocation and dimerization system for gene activation
The light-inducible dimerization of CRY2-CIB1 has enabled the development of gene activation systems that respond to blue light (18, 25). With a DNA binding domain and a transcription activator fused to CRY2 and CIB1, respectively, the light-induced dimerization of CRY2-CIB1 can bring the transcription activator to the promoter to activate gene transcription and expression. However, there is a substantial leakage of the transcriptional activities originating from the spontaneous binding between CRY2 and CIB1 even in the absence of light (18, 25). Konermann et al. (19) fused NLS to CRY2 and nuclear export signal (NES) to CIB1 to spatially separate these two components before light stimulation to reduce the background; hence, the residential CRY2-NLS would recruit NES-CIB1 to dimerize in the nucleus only in response to light. However, the forced retention of CIB1 outside of the nucleus by NES could compromise the nuclear translocation efficiency and transcriptional activation power upon light stimulation.
Here, we develop a new light-inducible gene activation system, LINTAD, which combines CRY2-CIB1 dimerization and light-inducible nuclear translocation. We fused the LexA DNA binding domain (17) to the N terminus of CIB1 (19) and a bipartite light-inducible nuclear localization signal (biLINuS) (17) to its C terminus, resulting in LexA-CIB1-biLINuS or LCB (Fig. 1A). Meanwhile, we fused an NLS to the N terminus of CRY2PHR (photolyase homology region of Arabidopsis CRY2, amino acids 1 to 498) (25) and a strong transcription activator VPR (VP64-p65-Rta) (27) to its C terminus, resulting in CRY2-VPR or CV. Light-inducible reporters were constructed by assembling the LexA binding sequence (LexA BS), a minimal promoter, and a target reporter gene. In the dark state, LCB stays in the cytoplasm, while CV stays in the nucleus; thus, these two regulators at rest are spatially separated in different cellular compartments (Fig. 1A). Upon blue light stimulation, the biLINuS in LCB is activated, unfolding the Jα helix of the LOV2 domain and exposing its NLS motif (17) to cause the nuclear translocation of LCB (Fig. 1B). Simultaneously, the CRY2PHR domain in CV is activated by blue light and can bind to the CIB1 domain of LCB with high affinity (18, 19). The LCB-CV complex is hence targeted to the LexA BS on the reporter cassette so that VPR is in close proximity to the minimal promoter, triggering transcription of the target reporter gene (Fig. 1B). This “push-pull” strategy incorporating the biLINuS-enabled active nuclear translocation of LCB as well as the pulling effect of the CRY2-CIB1 dimerization is expected to cause strong gene activation upon blue light stimulation with a high signal/noise ratio.
Fig. 1. Schematics of the LINTAD gene activation system.
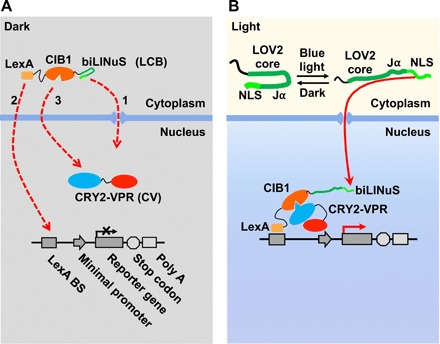
(A) The three components of the LINTAD system. LexA-CIB1-biLINuS (LCB): LexA fused with CIB1 and the bipartite light-inducible NLS (biLINuS); CRY2PHR-VPR (CV): CRY2PHR fused with VPR; light-inducible reporter: LexA binding sequence (LexA BS) fused with a minimal promoter and a target gene. In the dark state, LCB stays in the cytoplasm and CV in the nucleus. (B) Upon blue light stimulation, the Jα helix of the LOV2 domain in biLINuS is unfolded to expose the NLS peptide [top part in (B)], which leads to LCB translocation into the nucleus [red dashed line 1 in (A)]. LexA then binds to LexA BS on the light-inducible reporter [red dashed line 2 in (A)]. Meanwhile, CRY2PHR binds to CIB1 upon blue light stimulation [red dashed line 3 in (A)], thus targeting VPR to the minimal promoter region to trigger the reporter gene expression.
Characterization of the LINTAD gene activation system in human embryonic kidney 293T cells
We first characterized the LINTAD gene activation system in human embryonic kidney (HEK) 293T cells. To visualize the blue light–induced translocation of LCB, the mCherry fluorescent protein was incorporated in LCB for tracking subcellular translocations (LexA-CIB1-mCherry-biLINuS or LCmB). The majority of the LCmB showed cytosolic localization before blue light stimulation, and short pulses of blue light (repetitive 0.5-s light per 30 s for 10 min) triggered a clear nuclear translocation (Fig. 2A and movie S1). The observed nuclear translocation was also verified to be specifically sensitive to blue light illumination (fig. S1, A and B), which will be referred to as “light stimulation” in the remainder of this manuscript if without further specification. The nuclear localization of CV was also verified (fig. S1C). To examine whether LINTAD can activate gene expression upon light stimulation, HEK 293T cells were cotransfected with LCB- and CV-expressing plasmids together with a light-inducible mNeonGreen reporter. Twenty-four hours after transfection, cells were either stimulated with pulsed blue light (5 mW/cm2, 1 s per every 30 s) or kept in the dark for 24 hours. Both fluorescence imaging and flow cytometry results showed that the light stimulation caused a significant induction of mNeonGreen, with the quantified mean cellular fluorescence intensities being 61-and 1.7-fold in the light and dark groups, respectively, compared with the nontransfected cells (Fig. 2, B and C, and movie S2). These results demonstrate that the LINTAD system can control target gene expression through light stimulation in HEK 293T cells.
Fig. 2. Characterization of LINTAD gene activation in HEK 293T cells.
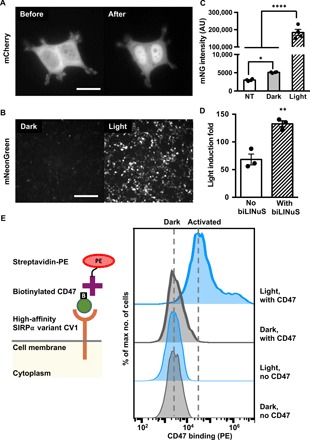
(A) HEK 293T cells were transfected with LexA-CIB1-mCherry-biLINuS (LCmB) to track the nuclear localization of LCB before and after light stimulation. Scale bar, 20 μm. (B) Light-inducible mNeonGreen expression. HEK 293T cells were cotransfected with LCB, CV, and the light-inducible mNeonGreen reporter. Dark, without light stimulation; Light, with 24-hour light stimulation. Scale bar, 200 μm. (C) Comparison of mNeonGreen (mNG) intensity of cells transfected with LINTAD and mNeonGreen reporter with (light) or without light stimulation (dark). NT, HEK 293T without transfection. AU, arbitrary unit. Results were quantified by flow cytometry (n = 4 independent experiments, with 20,000 cells per experiment). (D) Comparison of light-inducible systems with or without the light-inducible NLS (biLINuS). HEK 293T cells were cotransfected with LCB (with biLINuS) or LexA-CIB1 (no biLINuS), CV, the light-inducible Fluc reporter, and a constitutive Rluc as an internal reference to normalize the induced Fluc expression in each group (n = 3 independent experiments). Light induction fold in each group is defined as the ratio of the normalized Fluc activities in the light condition to that in the dark condition. (E) Comparison of CD47 binding of cells transfected with LCB, CV, and the light-inducible CV1 reporter with or without light stimulation. Left: Schematics of the CV1-CD47 binding assay. Right: Representative flow cytometry histograms of PE staining (streptavidin-PE) of CD47 under different conditions. SIRPα, signal regulatory protein α. Dark, without light stimulation; Light, with 24-hour light stimulation; no CD47, cells without CD47 ligand incubation before PE staining; with CD47, cells incubated with CD47 before PE staining. **P < 0.01; ****P < 0.0001; two-tailed Student’s t test. Error bar, SEM.
To investigate the effect of including biLINuS in the LINTAD system, a similar light-inducible dimerization system without biLINuS (i.e., LexA-CIB1 and CRY2PHR-VPR) was constructed and compared with the LINTAD system using firefly luciferase (Fluc) as the reporter gene. Cells were also transfected to constitutively express Renilla luciferase (Rluc) to normalize the induced Fluc activity of each sample [dual-luciferase reporter system (28); see fig. S2A]. The LINTAD system showed a 133-fold induction of Fluc activity normalized by Rluc upon light stimulation compared with the dark control, while the system without biLINuS showed a 68-fold induction (Fig. 2D). These results confirmed that biLINuS in the LINTAD system can significantly enhance the dynamic range of the blue light–mediated gene induction. In addition, the LINTAD system had minimal background expression in the dark state, which is comparable to the control systems where either the LCB or the CV component is removed (fig. S2B), suggesting that the gene activation of LINTAD can be well controlled by light with high specificity.
We further explored whether LINTAD can be used to control gene expression for the regulation of cellular functions. CV1, an engineered high-affinity membrane receptor for CD47 (29), was used here as the target gene in the light-inducible reporter, which can alter the cell’s inherent CD47 binding behavior (29). The light-induced functional CV1 can be measured by staining with biotinylated CD47, which can then be detected by streptavidin–phycoerythrin (PE) after extensive wash steps (scheme shown in Fig. 2E, left). More than 80% of the engineered cells upon light stimulation can be successfully stained with CD47 (Fig. 2E, right), in contrast to the minimal CD47 staining of the cells without light stimulation, which is similar to the controls without CD47 staining. These results indicate that LINTAD can successfully control membrane receptor production, such as CV1, for the regulation of cellular functions.
Optical control of anti-CD19 CAR expression in Jurkat T cells
We further characterized LINTAD in the human Jurkat T cell line, where T cell signaling can be activated by CARs (3, 16). To demonstrate that gene activation can be achieved upon light stimulation in Jurkat cells engineered with LINTAD, we used Fluc as the inducible reporter gene. We observed an over 1000-fold increase of Fluc signal in the light-stimulated group compared with the dark group (without light stimulation), with minimal background leakage expression (Fig. 3A). Next, we examined the capability of LINTAD in controlling anti-CD19 CAR (CD19CAR) expression in Jurkat cells with the light-inducible Myc-tagged CD19CAR reporter. We observed significant induction of CD19CAR expression (quantified by the percentage of CAR+ cells) upon light stimulation (Fig. 3, B and C). The detected induction fold appeared lower than that of the luciferase reporter, possibly due to the amplification effect of luciferase assays, the membrane expression characteristics, and the increased gene size of CD19CAR (30) compared with Fluc. Other light-inducible reporters were also tested (mNeonGreen and CD19CAR-YPet) and showed similar light-mediated gene induction (fig. S3). We noticed that, when gene induction was quantified by fluorescent protein intensity, the noise level (cells with low fluorescence intensity in a sample) decreased slightly after light stimulation as compared with the sample without light stimulation (fig. S3, C and D), possibly due to the photobleaching effect of light stimulation (fig. S1, D and E). When the light stimulation is stopped, the CRY2-CIB1 interaction in the LINTAD system would dissociate with a half-life of ~5.5 min (18, 31), and hence, there is no further transcription/translation of the reporter gene. Therefore, the duration of the induced gene expression mainly depends on the degradation of the proteins encoded in the reporter genes. In our study, the duration of the light-induced CAR expression is ~2 days (fig. S3E).
Fig. 3. LINTAD system can induce target gene expression upon light stimulation in Jurkat cells.
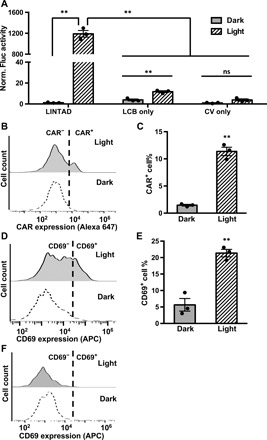
(A) Characterization of LINTAD system with light-inducible Fluc reporter. Jurkat cells were transfected with (i) both LCB and CV components (LINTAD), (ii) only the LCB component (LCB only), or (iii) only the CV component (CV only). All groups were also cotransfected with the light-inducible Fluc reporter. Fluc activities were measured using the same number of cells in each group, and all values were normalized to that of “CV only (dark).” n = 3 independent experiments. (B) Representative flow cytometry charts showing light-inducible CD19CAR expression in Jurkat cells (transfected with LINTAD regulators LCB and CV, and the light-inducible CD19CAR reporter; the whole live cell population is shown in each chart). CAR expression was quantified by staining of the Myc tag fused to the extracellular domain of CD19CAR. The gating threshold for CAR+ cells was based on the Myc tag staining of nontransfected Jurkat cells and was indicated in the figure with dotted line. (C) Comparison of CAR+ cell percentage of the dark and light groups shown in (B). n = 3 independent experiments. (D) Representative flow cytometry charts showing CD69 levels of the light and dark groups. Jurkat cells were transfected with LINTAD regulators and the CD19CAR-YPet reporter, cocultured with CD19-expressing Toledo cells after light/dark treatment, and stained with anti-CD69 antibody for flow cytometry analysis. The gating threshold for CD69+ cells was based on the staining of nontransfected Jurkat cells and was indicated in the figure with a dotted line. The YPet+ populations of the cocultured cells were used for CD69 comparison to exclude Toledo cells and Jurkat cells not containing all the three plasmids. See fig. S3D for the CAR-YPet expression profiles of the light and dark groups. APC, allophycocyanin. (E) Comparison of CD69+ cell percentage of the dark and light groups shown in (D). n = 3 independent experiments. (F) Representative CD69 expression profiles of Jurkat cells hosting light-inducible headless CAR reporter after coculture with CD19-expressing target cells and anti-CD69 antibody staining. The YPet+ populations were used for CD69 comparison. The gating threshold for CD69+ cells was based on the staining of nontransfected Jurkat cells and was indicated in the figure with a dotted line. **P < 0.01. ns, not significant. Two-tailed Student’s t test with Bonferroni correction was used for (A); two-tailed Student’s t test was used for (C) and (E). In all panels: light, with 24-hour light stimulation; dark, without light stimulation. In all bar graphs, data represent mean values ± SEM.
Functionality of the light-induced CD19CAR on these Jurkat cells was verified by coculturing with Toledo cells (a human non-Hodgkin’s lymphoma cell line), which express CD19 antigen and are expected to trigger the CD19CAR-mediated T cell activation signaling in Jurkat cells. We observed more than threefold elevated CD69 expression [an early T cell activation marker (32)] in the light-stimulated group compared with that of the control group without light stimulation (Fig. 3, D and E), suggesting that the light-induced CD19CAR can enable Jurkat cells to recognize CD19 antigen and activate the corresponding signaling pathway. To further verify that this activation is CD19 recognition dependent, we constructed a reporter containing a truncated version of CD19CAR, where the CD19-recognizing extracellular domain was deleted (headless CAR). The expression of this headless CAR can also be induced by light (fig. S3F) but was not able to induce the up-regulation of CD69 expression after coculturing with Toledo cells (Fig. 3F), indicating that the observed light-induced cell activation is specifically mediated by CD19 recognition. Our results, hence, demonstrated that LINTAD can noninvasively induce gene expression in Jurkat cells with light, including not only the fluorescent protein reporters but also the functional CAR molecules, revealing the potential of optogenetics in cell-based immunotherapy.
Light-inducible cytotoxicity of engineered primary human T cells
To demonstrate the light-controllable cell-based immunotherapy, we tested our system in primary human T cells by lentiviral transduction of the LINTAD regulators together with corresponding reporters (fig. S4, A to C). We first used the dual-luciferase reporter containing a light-inducible Fluc and a constitutive Rluc (as internal reference) and observed a two- to sevenfold gene induction with different durations of light stimulation (1-s light per 30 s, for 6 to 24 hours; Fig. 4A), with 12 hours of light stimulation resulting in the highest induction, demonstrating that blue light can be used to control gene expression in primary human T cells. We then focused on light-inducible CD19CAR expression and tested whether we can achieve light-inducible cytotoxicity of T cells against target tumor cells. T cells infected with LINTAD regulators and CD19CAR reporter (fig. S4D, with regulators and reporter fused to fluorescent proteins to assess the gene transduction efficiency in fig. S4E) were stimulated by light for 6 or 12 hours, followed by coculture with target tumor cells (Nalm-6 cells expressing CD19 and engineered to constitutively express Fluc) for 24 hours. Cytotoxicity of T cells was determined by measuring the Fluc activity of the remaining live Nalm-6 cells after coculture in each group. The engineered T cells, only after 12 hours of light stimulation, demonstrated 7.3-fold enhanced cytotoxicity compared with that of the control group, which was kept in the dark, or that of the uninfected T cells (Fig. 4B), suggesting that there is a threshold of stimulation time to induce adequate expression of CD19CAR for enhanced functional actions. To verify that the cytotoxicity is specific to T cell activation, we quantified the levels of the cytokines interleukin-2 (IL-2) and interferon-γ (IFN-γ) in the supernatants after coculture (15). Higher secretion of both cytokines (8.8- and 3.9-fold, respectively) was observed in the 12-hour light stimulation group compared with the dark group (Fig. 4, C and D). Our results, hence, suggest that light-inducible cytotoxicity of CAR T cells can be achieved through LINTAD.
Fig. 4. Light-inducible cytotoxicity of engineered primary human T cells in vitro and light-inducible gene activation in vivo.
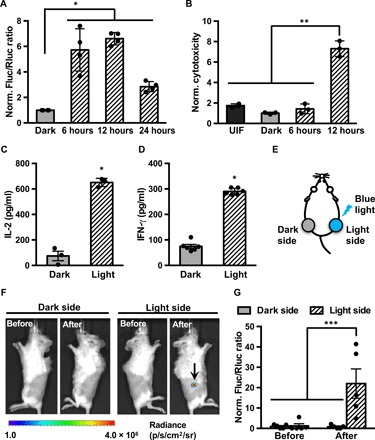
(A) Characterization of LINTAD-mediated Fluc induction in primary human T cells. T cells infected with LINTAD regulators and Fluc reporter (with constitutive Rluc as internal reference) were (i) kept in the dark (dark) or stimulated by blue light for (ii) 6, (iii) 12, or (iv) 24 hours. The gene induction level was represented by the ratio of Fluc to Rluc luminescence in each group and normalized to the mean value of the dark group. n = 4 independent experiments. (B) In vitro light-inducible cytotoxicity of T cells with CD19CAR reporter. Engineered T cells were either without light stimulation (dark) or stimulated with blue light for 6 or 12 hours, followed by coculture with Fluc+ Nalm-6 tumor cells for 24 hours. Uninfected T cells (UIF) were used as control following the same procedures. The Fluc activities of the remaining live Nalm-6 cells after coculture were quantified, and the inverses of the Fluc readings were calculated as the cytotoxicity values and normalized to that of the dark group. n = 3 independent experiments. (C and D) Cytokines IL-2 and IFN-γ secretion from T cells engineered with LINTAD and CD19CAR reporter after coculture with Nalm-6 cells were quantified by ELISA. Dark, without light stimulation; Light, with 12 hours of blue light stimulation. N ≥ 3 biological repeats. (E to G) Light-inducible Fluc activation in vivo. (E) Mouse model used for in vivo light-inducible gene activation. Engineered light-inducible Nalm-6 cells infected with LINTAD and Fluc reporter (with constitutive Rluc as internal reference) were subcutaneously injected into both flanks of NSG mice. One side of the mouse received blue light stimulation (light side), while the other side served as the dark control (dark side) as described in Materials and Methods. (F) Representative bioluminescence images showing the induced Fluc expression by blue light (at the region highlighted by the arrow). (G) Statistical comparison of light-inducible Fluc activation in mice. Induction level was indicated by Fluc/Rluc ratio at the same site. All Fluc/Rluc values were normalized to that of “Before, Dark side.” n = 5 mice. *P < 0.05; **P < 0.01; ***P < 0.001. Two-tailed Student’s t test with Bonferroni correction was applied in (A) and (B). Two-tailed Student’s t test was applied in (C) and (D). One-way analysis of variance (ANOVA) with Fisher’s least significant difference multiple comparison test was applied for (G). Bar graphs, data represent mean values ± SEM.
LINTAD-mediated gene induction in vivo
The skin/muscle penetration of blue light has been a concern for its in vivo therapeutic use. To explore whether our LINTAD system can be applied in vivo, we subcutaneously injected Nalm-6 cells engineered, by lentiviral infection, with LINTAD and the dual-luciferase reporter (see Materials and Methods and fig. S4C) on both sides of shaved mice (Fig. 4E), of which only one side was subjected to short-pulsed blue light stimulation using a light-emitting diode (LED) patch controlled by a home-built light box (light side, 1-s light per 30 s; see fig. S5 and Materials and Methods), while the other side remained unstimulated (dark side). After 24 hours of light/dark treatment, the light side showed significant gene induction (Fluc/Rluc), while the dark side had minimal Fluc signal (Fig. 4, F and G). This result demonstrates that blue light can penetrate skin tissue in vivo to achieve gene induction via LINTAD.
In vivo cytotoxicity of light-stimulated primary human T cells engineered with LINTAD
As we were working to characterize and optimize LINTAD for improved induction efficiency in T cells, we found that there is a strong correlation between the cellular concentrations of LINTAD regulators [LCB and CV quantified by the fused tag blue fluorescence protein (tBFP) and enhanced green fluorescent protein (eGFP) intensities, respectively] and the resultant light induction efficiency (quantified by the reporter mCherry expression) (Fig. 5A and fig. S6, A to C). Only when the concentrations of regulators (LCB or CV) reach a threshold can the reporter gene be efficiently activated, with the induction efficiency peaked at the highest concentration zone for both regulators. In contrast to HEK 293T or the Jurkat cell line, the relatively low expression levels of regulators LCB and CV based on lentiviral infection in primary human T cells severely limited the gene induction efficiency. The required high concentration of regulators for efficient gene induction may suggest that the affinity between CRY2 in CV and CIB1 in LCB is relatively low even after light activation. One way to enhance their binding is to engineer a pair of dimerization helpers into the current system, attaching to the LINTAD regulators LCB and CV, respectively. To this end, several helper pairs with diverse affinities were tested using different fusion strategies (fig. S7A) (33, 34). Among the different designs tested, the trend of WW-WP1 and SH3-SP1 helper pairs (35) were identified to favor a higher light induction efficiency when the regulators are at low concentrations (fig. S7B). This was further verified by the light-induced luciferase assay in primary human T cells (Fig. 5B and fig. S8). Specifically, the WW-WP1 pair caused a significant improvement over the original LINTAD system in light-induced gene activation of Fluc (~40-fold in Fig. 5B versus ~7-fold in Fig. 4A), which was, hence, used for further experiments in primary human T cells.
Fig. 5. In vivo cytotoxicity of light-activated primary human T cells.
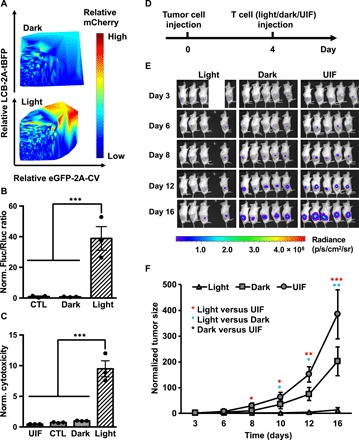
(A) Gene induction efficiency of LINTAD strongly depends on concentrations of regulators. Primary human T cells were infected with LCB-2A-tBFP and eGFP-2A-CV to indicate the expression levels of LINTAD regulators. Light-inducible mCherry reporter was used to determine the gene induction level. The intensity (and hence induction level) of mCherry is color coded, with cold and hot colors representing low and high levels. Dark, without light stimulation; Light, with 12 hours of blue light stimulation. (B) Light-inducible gene expression using WW-LINTAD in primary T cells. Light and Dark: T cells infected with lentiviral WW-LINTAD (LWWCB and WP1CV) and Fluc reporter (with constitutive Rluc as internal reference) were stimulated with (light) or without (dark) for 12 hours. CTL, control T cells infected with only the LWWCB component and reporter. Fluc/Rluc ratios represent gene induction levels and are normalized to that of the dark group. (C) Cytotoxicity of T cells engineered with WW-LINTAD, light-inducible Cre reporter, and loxP-ZsGreen-stop-loxP-CD19CAR (see fig. S9). UIL, uninfected T cells. CTL, control T cells infected with only the LWWCB component of WW-LINTAD, Cre reporter, and loxP-ZsGreen-stop-loxP-CD19CAR. Dark, without light stimulation; Light, with 12 hours of light stimulation. Different groups of T cells were cocultured with Fluc+ Nalm-6 cells for 24 hours. Fluc activities of the remaining live Nalm-6 cells after coculture were quantified. Cytotoxicity values were calculated as 1/Fluc and normalized to that of the dark group. Data represent mean values ± SEM (n = 3 independent experiments). (D to F) In vivo cytotoxicity of light-inducible T cells after in vitro light stimulation. NSG mice were subcutaneously injected with Fluc+ Nalm-6 cells on the right flank. Primary human T cells engineered with WW-LINTAD, light-inducible Cre reporter, and loxP-ZsGreen-stop-loxP-CD19CAR were treated with (light) or without (dark) 12 hours of blue light, followed by local injection into the mice at the tumor sites. Uninfected T cells (“UIF”) were used as control following the same procedures. (D) Timeline of tumor inoculation and T cell injection. (E) Tumor burden was quantified by bioluminescence imaging (BLI) after tumor inoculation for 16 days. We only included four mice in the light group, because the engineered T cells were not sufficient for five mice as planned due to accidental cell loss during experimental processes. (F) Quantification of tumor aggressiveness in different groups in (E). The integrated luminescence of a tumor at each time point was normalized to that of the same tumor on day 3 (before T cell injection). Data represent mean ± SEM (n = 4 mice for “Light,” n = 5 mice for “Dark” and “UIF”). *P < 0.05; **P < 0.01; ***P < 0.001. One-way ANOVA, followed by Fisher’s least significant difference multiple comparison test was used for (B), (C), and (F).
With this improvement, we applied LINTAD with the WW-WP1 addition (WW-LINTAD) for light-inducible cell-based immunotherapy in vivo. To maintain a more sustained CD19CAR expression after the light is off, we used a Cre-LoxP system here, where the light-induced Cre can turn on CD19CAR expression in the loxP-ZsGreen-stop-loxP-CD19CAR cassette (fig. S9), so that a short-pulsed transient light stimulation (hours) can be converted into a long-lasting CD19CAR action (days to weeks). The engineered T cells with the WW-LINTAD and Cre-LoxP system upon 12 hours of light activation demonstrated a significant 9.5-fold light-inducible cytotoxicity in vitro (Fig. 5C). To test their light-induced cytotoxicity in vivo, we subcutaneously injected these engineered T cells after in vitro light activation into NSG mice 4 days after subcutaneous tumor inoculation (Fig. 5D). Bioluminescence imaging (BLI) was performed to monitor tumor burden for 16 days. The tumor growth in the mice injected with the light-stimulated engineered T started to show significant difference from the control group (injected with uninfected T cells) on day 8. The significant difference between the light and dark (engineered T cells without light stimulation) groups started to reveal on day 12 (Fig. 5, E and F), demonstrating the cytotoxicity effect of light-induced T cells against tumor cells in vivo.
In vivo light-inducible immunotherapy with high spatial resolution
We reasoned that our engineered light-inducible CAR T cells after injection can be activated in vivo with high spatial resolution, providing controllability of CAR T immunotherapy as compared with the standard CAR T therapy. To demonstrate this, we subcutaneously inoculated NSG mice with Nalm-6 tumor cells (expressing Fluc) on both the left and right flanks. Four days later, engineered T cells with WW-LINTAD– and Cre-LoxP–based inducible CD19CAR were locally injected into the mice at both tumor sites (Fig. 6A). The tumor on one flank received blue light stimulation in vivo (light), while the tumor on the other flank remained unstimulated (dark) as described in Materials and Methods. Tumor aggressiveness was monitored for 3 weeks by BLI. We observed that the tumor growth on the light side was significantly inhibited compared with that on the dark side (Fig. 6, B and C, and fig. S8B), demonstrating the desired spatial selectivity and controllability of the light-inducible cytotoxicity in vivo. To demonstrate that the light-induced tumor inhibition was through LINTAD-controlled CD19CAR, we injected nonengineered primary human T cells locally into the tumors on both flanks in NSG mice and applied the above-mentioned light or dark treatment. No significant difference in tumor growth was found between the light and dark sides, suggesting that blue light itself does not affect tumor aggressiveness (Fig. 6D and fig. S8C). Together, our results show that the LINTAD-based light-inducible CAR T cells can be activated in vivo by blue light at the desired location with spatial selectivity to achieve therapeutic effects, which provides spatiotemporal control of cell-based immunotherapy.
Fig. 6. In vivo light stimulation of LINTAD CAR T cells can control cytotoxicity with high spatial resolution.
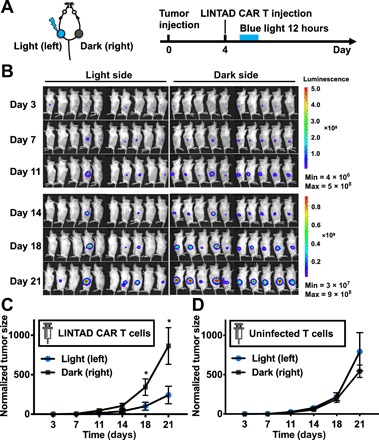
(A) Mouse model and experiment timeline. Fluc+ Nalm-6 cells were subcutaneously injected on both flanks of the mouse, and LINTAD CAR T cells were locally injected into the inoculated tumor sites 4 days later. One side (left) was illuminated with blue light for 12 hours (light), while the other side (right) served as the dark control (dark) as described in Materials and Methods. (B) Bioluminescence images of mice in the experiment described in (A). (C) Quantification of tumor growth in (B). (D) Same experiment procedures as in (A) with UIFs instead of LINTAD CAR T cells. In all panels, tumor size was quantified using the integrated Fluc luminescence of a tumor normalized to that of the same tumor on day 3. Error bar, SEM [n = 10 mice in (B), and n = 5 mice in (C) and (D)]. *P < 0.05. One-way ANOVA, followed by Fisher’s least significant difference multiple comparison test was used for (C) and (D).
DISCUSSION
Cell-based immunotherapies such as CAR T cells are becoming a paradigm-shifting therapeutic approach with promising success in treating blood tumors. With the next frontier of applying cell-based therapies in solid tumors, one critical component of technology development is to gain spatiotemporal control of engineered T cells with high precision (3, 13, 16). The LINTAD system developed here demonstrates the first successful integration of optogenetic control and CAR T and provides the proof of concept for light-controllable immunotherapy, which has the potential to precisely address this need particularly for tumors at shallow surfaces including skin cancers and melanoma. Although red or infrared light systems have the advantage of deeper tissue penetration, most of them, at the moment, require additional cofactors besides photoactivatable domains and appear less efficient than the counterparts of the blue light systems (23, 36). The limited tissue penetration of blue light (37) can also be overcome to reach deeper tissues using upconversion nanoparticles, which are capable of converting near-infrared (NIR) light to stimulate blue light–responsive proteins (38), or implantable LEDs controlled wirelessly with radio frequencies (39) or NIR light (40). Integrated with optical fibers, LINTAD can also be extended to control engineered T cells targeted at gastrointestinal tracts to treat gastrointestinal cancers (41). As this is a rapidly evolving field, LINTAD could provide the power of controlling engineered cells with high precision for cell-based therapeutics to eradicate tumors, particularly for these locally advanced and unresectable solid tumors.
While the CRY2-CIB1 dimerization has been used to engineer various gene activation systems, the basal dimerization tendency of the CRY2-CIB1 pair can result in a relatively high level of leaky expression of reporter genes (18, 25). Efforts on directed evolution attempted to suppress the basal expression and improve the dynamics for gene regulation have met limited success (25). Another strategy to minimize the basal leakage is to separate CRY2 and CIB1 into different cellular compartments before light stimulation (19). However, the nuclear translocation relies on the equilibrium between the strengths of the localization signals (NES and NLS) on these components when they form a complex, thus resulting in limited shuttling of the molecules between the compartments and, therefore, limited activation efficiency. Our LINTAD system reported here uses both the light-induced active transportation via the biLINuS motif and the pulling effect mediated by the CRY2-CIB1 dimerization for nuclear translocation to control gene activation. Without light, CIB1 stayed outside of the nucleus and was decoupled from CRY2 to achieve a low basal leakage of target gene expression. Upon light activation, this push-pull strategy combining the biLINuS-enabled nuclear translocation and the CIB1-CRY2 dimerization induced a strong gene activation. Hence, the LINTAD system can achieve a high contrast of gene activation before and after light stimulation.
The positive correlation between efficiency of light induction and expression levels of regulators of LINTAD system (Fig. 5A and fig. S8) and the requirement of high expression levels of LINTAD regulators for efficient induction of reporter genes suggest that the binding affinity between CRY2-CIB1 may be weak even after activated by light. Engineering a weak dimer helper pair into the original LINTAD system led to significant enhancement of the performance of the LINTAD system, especially when the regulator concentrations are limited at low levels in primary human T cells (Fig. 5B). This improvement further led to in vivo cytotoxicity and tumor growth suppression upon light stimulation (Figs. 5, E and F, and 6). These results suggest that we can tailor the inducible dimerization partners in their affinity to optimize the system performance in different cell types with their special requirement of regulator concentrations. This approach can be particularly useful for the genetic engineering of primary cells where the exogenous protein expression levels are restricted.
The modular design of the LINTAD system allows a simple change of the DNA binding domain, the dimerization pair, and/or the transcription activator to integrate different molecular interactions for the control of desired protein production and functional cellular outcomes. Replacing the reporter gene with different target genes can conveniently switch, in principle, any functional outcome of LINTAD to monitor or reprogram host cells. For example, TRAIL [tumor necrosis factor (TNF)–related apoptosis inducing ligand], an inducer of apoptosis and a cancer therapeutic (42), can be used as the target reporter gene, and LINTAD can be used to achieve light-inducible tumor suppression/killing. The DNA binding domain LexA can be replaced by other types of its kind to orthogonally target different promoter sequences and drive gene products (18, 25), whose expression levels can also be fine-tuned through promoter sequence engineering (43). The VPR transcription activator can also be switched to smaller domains such as VP64 to reduce the gene cargo size for enhanced delivery efficiency in primary cells, which are usually difficult to transfect or infect (19, 27). Hence, we have engineered and characterized a new light-controllable modular system for gene activation, with their immense therapeutic potential demonstrated by the proof-of-concept application in engineered T cells for cancer immunotherapy.
In our demonstration of the concept of light-inducible immunotherapy, the Cre-LoxP system was used to convert transient light stimulation to relatively long-term CAR expression once the engineered T cells were activated. For situations where higher temporal resolution is desired, the reversibility of the current system can be tuned by incorporating other synthetic biology strategies (13) such as the degron motifs (44), which are known to regulate protein degradation rates and, hence, can control CAR T cells at the protein level. Alternatively, as the half-life of CAR molecules has been reported to be ~8 hours (16), the LINTAD system without Cre-LoxP can be directly used to trigger transient CAR expression, and multiple rounds of light stimulation can be applied to produce pulsed expression profiles of CAR with tunable magnitudes for more precise controls and mitigating CAR T cell exhaustion.
While similar therapeutic results achieved here using the locally injected and illuminated light-inducible CAR T cells could potentially be obtained with locally injected constitutive CAR T cells, the development of light-controllable CAR T cells can lead to a platform technology and be integrated with intravenous injection in the future to activate engineered T cells only at tumor sites by local illumination. LINTAD can be further integrated with bispecific antibody or a homing receptor on the cell surface so that intravenously introduced engineered T cells can accumulate at tumor sites. Several groups have successfully used engineered T cells to identify and highlight tumor positions (45, 46).
CRY2 has been shown to simultaneously undergo CRY2-CRY2 homo-oligomerization in the CRY2-CIB1 dimerization system upon light stimulation (47). To minimize the potentially undesired CRY2-CRY2 homo-oligomerization, which may affect the gene activation efficiency of LINTAD, we have engineered a version of LINTAD where CRY2PHR was replaced by the recently reported CRY2low (47), a CRY2 mutant with reduced homo-oligomerization. However, this did not result in any improvement when compared with the original LINTAD system that uses CRY2PHR (fig. S2C).
MATERIALS AND METHODS
Cloning
Plasmids used in this manuscript are listed in table S1. LCB constructs were generated by Gibson assembly (New England Biolabs) of fragments LexA [from pDN92 (17)], CIB1 [from LITE2.0 TALE-CIB1 (19)], and biLINuS [from pDN92 (17)] following the manufacturer’s instructions. CRY2PHR-VPR constructs were generated by Gibson assembly of fragments CRY2PHR [from LITE2.0 CRY2PHR-VP64 (19, 48)] and VPR [from SP-dCas9-VPR (27)]. DNA fragments were amplified by polymerase chain reaction (PCR) using Q5 DNA polymerase (New England Biolabs). DNA oligos for PCR amplification were synthesized by Integrated DNA Technologies. PCR products were purified by the agarose gel electrophoresis method (D4001; Zymo Research). Purified DNA fragments were cloned into pCAGGS vector (for transient transfection) or pHR-PGK (for transient transfection or lentiviral infection). Light-inducible reporter constructs were generated by cloning the target gene into the pDN100 vector (with the original reporter gene removed, for transient transfection) or pHR vector (with LexA binding site and minimal promoter, for lentiviral infection) using the Gibson assembly method. Constructs were confirmed by Sanger sequencing (Genewiz).
Reagents and cell culture
Fetal bovine serum (FBS), Dulbecco’s modified Eagle medium (DMEM), RPMI 1640, l-glutamine, penicillin/streptomycin, and sodium pyruvate were purchased from Gibco. Phosphate-buffered saline (PBS) was prepared from PBS powder (Sigma-Aldrich). Biotinylated CD47 protein was produced and purified as previously described (49). Cell lines HEK 293T (human embryonic kidney 293T cell line), Jurkat (human acute T cell leukemia cell line), and Toledo (human non-Hodgkin’s B cell lymphoma cell line) were from the American Tissue Culture Collection (ATCC; Manassas, VA), with the authentication and verification of the absence of mycoplasma contamination. The Nalm-6 cell line (engineered to express Fluc) was a gift from the Michel Sadelain Lab. These cells were cultured in ATCC-recommended conditions in a humidified incubator of 95% air and 5% CO2 at 37°C.
Live cell imaging of light-activated protein nuclear translocation
A total of 0.8 million HEK 293T cells were seeded in a 3.5-mm dish, transfected at 70% confluency with 2.0 μg of pcDNA3.1-LCmB, and cultured in the dark (covered by aluminum foil; same for other experiments unless otherwise specified). Twenty-four hours after transfection, medium was replaced with phenol red–free DMEM with 10% FBS for imaging. Live cell imaging was performed at 37°C with a Nikon Ti inverted microscope equipped with a 100×/NA 1.4 objective and a cooled charge-coupled device camera (Cascade 512B, Photometrics) using MetaFluor 6.2 software (Universal Imaging). The dynamic nuclear translocation of mCherry in LCmB was monitored by an excitation filter 580/20 nm and an emission filter 630/20 nm, together with a dichroic mirror 595 nm (Chroma). Blue light stimulation was delivered with an excitation filter 465/30 nm.
In vitro blue light stimulation on cells
Unless otherwise specified, light simulation in vitro on all types of cells was achieved using a customized 460-nm blue LED lamp mounted to the inside of an above-mentioned standard cell culture incubator. The distance between the LED and the cell culture plate was measured and fixed so that the cells were exposed to a light intensity of 5 mW/cm2. A programmable plug-in digital timer switch (Nearpow) was used to control the light stimulation pattern, e.g., 1 s/30 s for 24 hours. The cells in the dark groups were kept in cell culture plates covered by aluminum foil in a separate standard cell culture incubator.
Imaging of light-inducible gene expression of mNeonGreen in HEK 293T cells
Cells were transfected with LCB- and CV-expressing plasmids and light-inducible mNeonGreen reporter plasmid and placed in the dark immediately after transfection. For the light group, 24 hours after transfection, the cells were stimulated with the customized blue LED lamp (5 mW/cm2, 1 s/30 s) as described above for 24 hours. For the dark group, the cells were kept in the dark until imaging. Images of mNeonGreen were taken at 48 hours after transfection for the light and the dark groups with an excitation filter 460/40 nm, an emission filter 525/50 nm, and a dichroic mirror 495 nm (Chroma).
Luciferase reporter assays in HEK 293T cells
A total of 0.8 million cells were seeded in a 35-mm cell culture dish; at 70% confluency, cells were cotransfected with 1.5 μg of LCB, 1.5 μg of CV, 1.0 μg of light-inducible Fluc reporter, and 20 ng of a constitutive Rluc construct as a normalization reference (phRL-TK, Promega) using Lipofectamine 2000 (Invitrogen). Twenty-four hours after transfection, the cells were stimulated by blue light for 24 hours (5 mW/cm2, 1 s/30 s) or kept in the dark. All the cells in each dish were harvested, washed, and lysed in passive lysis buffer (Dual-Glo Luciferase Assay Kit, Promega), and Fluc and Rluc activities were quantified following the manufacturer’s protocol using a Tecan Infinite M200 Pro plate reader.
CV1-CD47 binding assays in HEK 293T cells
Cells were transfected with LCB- and CV-expressing plasmids and light-inducible CV1 reporter and cultured in the dark. For light stimulation, 24 hours after transfection, the cells were stimulated with blue light (5 mW/cm2, 1 s/30 s) for 24 hours. The cells were trypsinized and incubated with or without biotinylated CD47 (49) in PBS for 30 min at room temperature on a rotator. Cells were then washed three times with PBS and stained with streptavidin-PE in PBS for 30 min at room temperature on a rotator. After further washing three times with PBS, the cells were resuspended in PBS and analyzed with a BD Accuri C6 flow cytometer for PE staining.
Electroporation and light-inducible gene activation in Jurkat cells
Ten million Jurkat cells (in growth phase after 1:3 passaging the night before) were washed with OptiMEM (Gibco) and resuspended in 500 μl of OptiMEM with 15 μg of pHR-PGK-LCB, 15 μg of pHR-PGK-CV, and 15 μg of various light-inducible reporters. The cell resuspension was transferred to a 4-mm electroporation cuvette, electroporated using the Bio-Rad Gene Pulser Xcell Electroporation System, at 270 V, 950 μF (exponential wave, infinite resistance), and immediately transferred to prewarmed complete growth medium after electroporation. Twenty-four hours after electroporation, the cells were stimulated with blue light (5 mW/cm2, 1 s/30 s) or kept in the dark for 24 hours and then analyzed for fluorescent protein expression using a flow cytometer (Accuri C6, BD). For luciferase assays, the reporter construct containing light-inducible Fluc was used. The same number of cells after light or dark treatment were lysed, followed by Fluc measurement to quantify the light-induced gene expression. To measure the induction of Myc-tagged CD19CAR, the cells were stained using an Alexa Fluor 647–conjugated Myc-tag mouse antibody (2233S; Cell Signaling Technology) following the manufacturer’s protocol and analyzed by flow cytometry. For CD69 expression assay, the cells were cocultured with Toledo cells (ATCC CRL-2631) at 1:1 ratio for 24 hours, followed by anti-CD69 antibody staining (APC anti-human CD69, 310910, BioLegend) and flow cytometry analysis. For CD69 analysis, the YPet+ populations of the cocultured cells were used to exclude Toledo cells and Jurkat cells not containing all the three plasmids.
Isolation, culture, and lentiviral transduction of primary human T cells
Human peripheral blood mononuclear cells (PBMCs) were isolated from buffy coats (San Diego Blood Bank) using Ficoll gradients (Amersham Biosciences). CD3+ T cells were isolated from PBMCs using the Pan T cell isolation kit (Miltenyi). For lentiviral transduction, cells were first activated for 72 hours using CD3/CD28-coated Dynabeads (Gibco) in complete RPMI medium with 100 IU/ml IL-2. The cells were then transduced with concentrated lentivirus cocktail at a multiplicity of infection of 10 for each virus by spinoculation on RetroNectin (Takara)–coated plates at 1800g, 32°C for 1 hour.
Light-inducible gene activation in primary human T cells
Primary human T cells were infected with lentiviral cocktail of the LINTAD regulators (LCB and CV) and the desired light-inducible reporter (Fluc/Rluc dual luciferase reporter or CAR) as described above. Infected T cells were kept in the dark for 3 days before the experiment. For light activation, T cells were illuminated using the above-mentioned blue LED for different durations of time (1 s/30 s, for 6, 12, or 24 hours). The inductions of different reporter genes were measured as described above.
Cytotoxicity assay of primary human T cells
The cytotoxicity of T cells was determined by luciferase-based assays (48). In brief, a Nalm-6 cell line expressing constitutive Fluc (a gift from M. Sadelain) was used as the target tumor cells. Different groups of primary human T cells and Nalm-6 cells were cocultured at 10:1 ratio in 96-well plates with 2 × 10⁴ target cells in a total volume of 200 μl complete RPMI medium per well. Twenty-four hours later, the cells were centrifuged to remove the supernatant and lysed with 200 μl of passive lysis buffer (Promega) according to the manufacturer’s instructions. Luminescence was then measured using a TECAN Infinite M200 pro plate reader.
ELISA of IL-2 and IFN-γ
The BD ELISA (enzyme-linked immunosorbent assay) kits for human IL-2 and IFN-γ (cat. nos. 555190 and 555142) were used to quantify cytokine release in the supernatants after cytotoxicity assays following the manufacturer’s protocols.
In vivo blue light stimulation on mice
We have built three identical light boxes (fig. S5), each containing two 460-nm blue LEDs with tunable intensities, to allow simultaneous light stimulation on multiple mice (maximum six mice at once). Six- to 8-week-old male NSG mice were obtained from the Jackson laboratories and used for all animal studies described below under protocols approved by the University of California San Diego Institutional Animal Care and Use Committee and in accordance with ethical regulations and institutional guidelines. The mice were shaved before light stimulation, and the LEDs (half-sphere shaped with a diameter of ~2 mm) were attached to their skin at the stimulation sites using medical tapes (Nexcare). Light stimulation patterns were controlled digitally as described above.
In vivo BLI
BLI was performed using an In vivo Imaging System Lumina LT Series III (PerkinElmer), and the images were analyzed using Living Image software (PerkinElmer). The luciferase activities of Fluc and Rluc were measured by their respective substrates d-luciferin (GoldBio) and ViviRen (Promega) following the manufacturers’ protocols. The BLI of the Fluc and Rluc of the same mouse was typically performed 4 hours apart to prevent interference between the two signals. Imaging settings were kept the same throughout the entire time course of an experiment.
In vivo reporter gene activation by blue light
Wild-type Nalm-6 cells were engineered through lentiviral infection to express LCB, CV, and the dual-luciferase reporter (inducible Fluc and constitutive Rluc, LexA BS-Pmini-Fluc-PGK-Rluc-P2A-mCherry). The engineered Nalm-6 cells were injected subcutaneously into both flanks of the mice (1 × 10⁶ cells per injection). The injected cells on one flank was stimulated with blue light (1 s/30 s, 24 hours) using the light box described above, while the skin around the injection site on the other flank was covered by a piece of aluminum foil as the dark control. The cages were covered by aluminum foil the entire time of the experiment. The BLI of Fluc and Rluc was performed as described above, and the ratio of the integrated luminescence of the inducible Fluc to that of the constitutive Rluc was calculated.
In vivo cytotoxicity of light-inducible CAR T cells with in vitro light activation
NSG mice were subcutaneously injected with 1 × 10⁵ Fluc+ Nalm-6 tumor cells on the shaved right flank and randomly assigned to three groups: light, dark, and UIF (uninfected). Three days after tumor inoculation, primary human T cells infected with WW-LINTAD, light-inducible Cre (LexA-Pmini-Cre), and loxP-CD19CAR (PGK-loxP-ZsGreen-STOP-loxP-CD19CAR) were divided into two groups, one receiving blue light stimulation at 1 s/30 s for 12 hours, and the other group kept in the dark. One day after in vitro light/dark treatment (4 days after tumor inoculation), these two groups of cells were locally injected into the mice in the light and dark groups, respectively, at the tumor sites (1 × 10⁶ cells per injection). Mice in the UIF group received local injection of 1 × 10⁶ uninfected primary human T cells. BLI was performed twice every week as described above. The integrated Fluc luminescence in a defined region of interest was used to quantify tumor burden.
In vivo cytotoxicity of light-inducible CAR T cells with in vivo light activation
NSG mice were subcutaneously injected with 2 × 10⁵ Fluc+ Nalm-6 cells on the left and right flanks, respectively, to generate two tumors. Four days after tumor inoculation, 6 × 10⁵ primary human T cells infected with WW-LINTAD, light-inducible Cre, and LoxP-CD19CAR or uninfected primary human T cells were locally injected into both tumor sites. One flank was randomly chosen to be the side receiving blue light stimulation (light), with the other side being the dark control (dark). Four hours after local T cell injection, the light side was stimulated using the light box at 1 s/30 s for 12 hours, while the dark side was covered by a piece of aluminum foil as described above. BLI was performed twice every week as described above to determine tumor aggressiveness.
Statistical analysis
Two-tailed Student’s t test with Bonferroni post hoc correction was applied for the statistical analysis in Figs. 3A and 4 (A and B) and fig. S2B. One-way analysis of variance (ANOVA) with Fisher’s least significant difference post hoc test was applied for the statistical analysis in Figs. 4G, 5 (B, C, and F), and 6 (C and D). Two-tailed Student’s t test was applied for the rest of the statistical analysis. *P < 0.05; **P < 0.01; ***P < 0.001.
Supplementary Material
Acknowledgments
We thank K. Christopher Garcia at Stanford University for the CV1 construct and M. Sadelain at Memorial Sloan-Kettering Cancer Center NY for the CAR construct. Funding: This work is supported by grants from NIH HL121365, GM125379 (S.C. and Y. Wang), GM126016, CA204704, CA209629, NSF CBET1360341, DMS1361421 (Y. Wang), CA238042 (P. Ghosh), and UC San Diego. The funding agencies had no role in the study design, data collection and analysis, decision to publish, or preparation of the manuscript. Author contributions: Z.H., Y. Wu, and Y. Wang designed the research. Z.H., Y. Wu, M.E.A., Y.P., Y.-J.C., and X.W. performed the research. P.K. built the LED light boxes used in the in vivo experiments. Z.H., Y. Wu, S.L., and Y. Wang analyzed the data. Z.H., Y. Wu, S.C., and Y. Wang wrote the paper. Competing interests: The authors declare that they have no competing interests. Data and materials availability: All data needed to evaluate the conclusions in the paper are present in the paper and/or the Supplementary Materials. Additional data related to this paper may be requested from the authors.
SUPPLEMENTARY MATERIALS
Supplementary material for this article is available at http://advances.sciencemag.org/cgi/content/full/6/8/eaay9209/DC1
Fig. S1. Nuclear translocation of LCmB is specific to blue light stimulation.
Fig. S2. Characterization of LINTAD-mediated gene induction in HEK 293T cells using dual-luciferase reporter system.
Fig. S3. LINTAD-mediated light-inducible gene expression in Jurkat cells.
Fig. S4. Lentiviral vectors used for T cell infection.
Fig. S5. Light stimulation system used for in vivo studies.
Fig. S6. The level of LINTAD gene activation depends on the expression level of regulators.
Fig. S7. Engineering of LINTAD with weak dimer helpers.
Fig. S8. LINTAD with weak dimer helpers in T cells.
Fig. S9. Design and lentiviral vectors used for in vivo cytotoxicity studies.
Table S1. Plasmids used in this study.
Movie S1. Light-induced nuclear translocation of LCB of the LINTAD system.
Movie S2. Light-inducible mNeonGreen expression in HEK 293T cells engineered with LINTAD gene activation system and the light-inducible mNeonGreen reporter.
REFERENCES AND NOTES
- 1.Maus M. V., June C. H., Making better chimeric antigen receptors for adoptive T-cell therapy. Clin. Cancer Res. 22, 1875–1884 (2016). [DOI] [PMC free article] [PubMed] [Google Scholar]
- 2.Jacoby E., Nguyen S. M., Fountaine T. J., Welp K., Gryder B., Qin H., Yang Y., Chien C. D., Seif A. E., Lei H., Song Y. K., Khan J., Lee D. W., Mackall C. L., Gardner R. A., Jensen M. C., Shern J. F., Fry T. J., CD19 CAR immune pressure induces B-precursor acute lymphoblastic leukaemia lineage switch exposing inherent leukaemic plasticity. Nat. Commun. 7, 12320 (2016). [DOI] [PMC free article] [PubMed] [Google Scholar]
- 3.Wu C.-Y., Roybal K. T., Puchner E. M., Onuffer J., Lim W. A., Remote control of therapeutic T cells through a small molecule-gated chimeric receptor. Science 350, aab4077 (2015). [DOI] [PMC free article] [PubMed] [Google Scholar]
- 4.Frigault M. J., Lee J., Basil M. C., Carpenito C., Motohashi S., Scholler J., Kawalekar O. U., Guedan S., McGettigan S. E., Posey A. D. Jr., Ang S., Cooper L. J. N., Platt J. M., Johnson F. B., Paulos C. M., Zhao Y., Kalos M., Milone M. C., June C. H., Identification of chimeric antigen receptors that mediate constitutive or inducible proliferation of T cells. Cancer Immunol. Res. 3, 356–367 (2015). [DOI] [PMC free article] [PubMed] [Google Scholar]
- 5.Tokarew N., Ogonek J., Endres S., von Bergwelt-Baildon M., Kobold S., Teaching an old dog new tricks: Next-generation CAR T cells. Br. J. Cancer 120, 26–37 (2019). [DOI] [PMC free article] [PubMed] [Google Scholar]
- 6.Caliendo F., Dukhinova M., Siciliano V., Engineered cell-based therapeutics: Synthetic biology meets immunology. Front. Bioeng. Biotechnol. 7, 43 (2019). [DOI] [PMC free article] [PubMed] [Google Scholar]
- 7.Fisher J., Abramowski P., Wisidagamage Don N. D., Flutter B., Capsomidis A., Cheung G. W.-K., Gustafsson K., Anderson J., Avoidance of on-target off-tumor activation using a co-stimulation-only chimeric antigen receptor. Mol. Ther. 25, 1234–1247 (2017). [DOI] [PMC free article] [PubMed] [Google Scholar]
- 8.Gross G., Eshhar Z., Therapeutic potential of T cell Chimeric Antigen Receptors (CARs) in cancer treatment: Counteracting off-tumor toxicities for safe CAR T cell therapy. Annu. Rev. Pharmacol. Toxicol. 56, 59–83 (2016). [DOI] [PubMed] [Google Scholar]
- 9.Morgan R. A., Yang J. C., Kitano M., Dudley M. E., Laurencot C. M., Rosenberg S. A., Case report of a serious adverse event following the administration of T cells transduced with a chimeric antigen receptor recognizing ERBB2. Mol. Ther. 18, 843–851 (2010). [DOI] [PMC free article] [PubMed] [Google Scholar]
- 10.Ramos C. A., Savoldo B., Dotti G., CD19-CAR trials. Cancer J. 20, 112–118 (2014). [DOI] [PMC free article] [PubMed] [Google Scholar]
- 11.Cruz C. R., Hanley P. J., Liu H., Torrano V., Lin Y.-F., Arce J. A., Gottschalk S., Savoldo B., Dotti G., Louis C. U., Leen A. M., Gee A. P., Rooney C. M., Brenner M. K., Bollard C. M., Heslop H. E., Adverse events following infusion of T cells for adoptive immunotherapy: A 10-year experience. Cytotherapy 12, 743–749 (2010). [DOI] [PMC free article] [PubMed] [Google Scholar]
- 12.Smith J., Valton J., A universal suicide switch for chimeric antigen receptor T cell adoptive therapies. J. Clin. Oncol. 34, 7039–7039 (2016). [Google Scholar]
- 13.Brenner M. J., Cho J. H., Wong N. M. L., Wong W. W., Synthetic biology: Immunotherapy by design. Annu. Rev. Biomed. Eng. 20, 95–118 (2018). [DOI] [PubMed] [Google Scholar]
- 14.Fedorov V. D., Themeli M., Sadelain M., PD-1- and CTLA-4-based inhibitory chimeric antigen receptors (iCARs) divert off-target immunotherapy responses. Sci. Transl. Med. 5, 215ra172 (2013). [DOI] [PMC free article] [PubMed] [Google Scholar]
- 15.Cho J. H., Collins J. J., Wong W. W., Universal chimeric antigen receptors for multiplexed and logical control of T cell responses. Cell 173, 1426–1438.e11 (2018). [DOI] [PMC free article] [PubMed] [Google Scholar]
- 16.Roybal K. T., Rupp L. J., Morsut L., Walker W. J., McNally K. A., Park J. S., Lim W. A., Precision tumor recognition by T cells with combinatorial antigen-sensing circuits. Cell 164, 770–779 (2016). [DOI] [PMC free article] [PubMed] [Google Scholar]
- 17.Niopek D., Benzinger D., Roensch J., Draebing T., Wehler P., Eils R., Di Ventura B., Engineering light-inducible nuclear localization signals for precise spatiotemporal control of protein dynamics in living cells. Nat. Commun. 5, 4404 (2014). [DOI] [PMC free article] [PubMed] [Google Scholar]
- 18.Kennedy M. J., Hughes R. M., Peteya L. A., Schwartz J. W., Ehlers M. D., Tucker C. L., Rapid blue-light-mediated induction of protein interactions in living cells. Nat. Methods 7, 973–975 (2010). [DOI] [PMC free article] [PubMed] [Google Scholar]
- 19.Konermann S., Brigham M. D., Trevino A. E., Hsu P. D., Heidenreich M., Cong L., Platt R. J., Scott D. A., Church G. M., Zhang F., Optical control of mammalian endogenous transcription and epigenetic states. Nature 500, 472–476 (2013). [DOI] [PMC free article] [PubMed] [Google Scholar]
- 20.Müller K., Engesser R., Metzger S., Schulz S., Kämpf M. M., Busacker M., Steinberg T., Tomakidi P., Ehrbar M., Nagy F., Timmer J., Zubriggen M. D., Weber W., A red/far-red light-responsive bi-stable toggle switch to control gene expression in mammalian cells. Nucleic Acids Res. 41, e77 (2013). [DOI] [PMC free article] [PubMed] [Google Scholar]
- 21.Yumerefendi H., Lerner A. M., Zimmerman S. P., Hahn K., Bear J. E., Strahl B. D., Kuhlman B., Light-induced nuclear export reveals rapid dynamics of epigenetic modifications. Nat. Chem. Biol. 12, 399–401 (2016). [DOI] [PMC free article] [PubMed] [Google Scholar]
- 22.Levskaya A., Weiner O. D., Lim W. A., Voigt C. A., Spatiotemporal control of cell signalling using a light-switchable protein interaction. Nature 461, 997–1001 (2009). [DOI] [PMC free article] [PubMed] [Google Scholar]
- 23.Kyriakakis P., Catanho M., Hoffner N., Thavarajah W., Hu V. J., Chao S.-S., Hsu A., Pham V., Naghavian L., Dozier L. E., Patrick G. N., Coleman T. P., Biosynthesis of orthogonal molecules using ferredoxin and ferredoxin-NADP+ reductase systems enables genetically encoded PhyB optogenetics. ACS Synth. Biol. 7, 706–717 (2018). [DOI] [PMC free article] [PubMed] [Google Scholar]
- 24.Kaberniuk A. A., Shemetov A. A., Verkhusha V. V., A bacterial phytochrome-based optogenetic system controllable with near-infrared light. Nat. Methods 13, 591–597 (2016). [DOI] [PMC free article] [PubMed] [Google Scholar]
- 25.Taslimi A., Zoltowski B., Miranda J. G., Pathak G. P., Hughes R. M., Tucker C. L., Optimized second-generation CRY2-CIB dimerizers and photoactivatable Cre recombinase. Nat. Chem. Biol. 12, 425–430 (2016). [DOI] [PMC free article] [PubMed] [Google Scholar]
- 26.Polstein L. R., Gersbach C. A., A light-inducible CRISPR-Cas9 system for control of endogenous gene activation. Nat. Chem. Biol. 11, 198–200 (2015). [DOI] [PMC free article] [PubMed] [Google Scholar]
- 27.Chavez A., Scheiman J., Vora S., Pruitt B. W., Tuttle M., Iyer E. P. R., Lin S., Kiani S., Guzman C. D., Wiegand D. J., Ter-Ovanesyan D., Braff J. L., Davidsohn N., Housden B. E., Perrimon N., Weiss R., Aach J., Collins J. J., Church G. M., Highly efficient Cas9-mediated transcriptional programming. Nat. Methods 12, 326–328 (2015). [DOI] [PMC free article] [PubMed] [Google Scholar]
- 28.Chen H.-H., Yu H.-I., Yang M.-H., Tarn W.-Y., DDX3 activates CBC-eIF3–mediated translation of uORF-containing oncogenic mRNAs to promote metastasis in HNSCC. Cancer Res. 78, 4512–4523 (2018). [DOI] [PubMed] [Google Scholar]
- 29.Weiskopf K., Ring A. M., Ho C. C. M., Volkmer J.-P., Levin A. M., Volkmer A. K., Özkan E., Fernhoff N. B., van de Rijn M., Weissman I. L., Garcia K. C., Engineered SIRPα variants as immunotherapeutic adjuvants to anticancer antibodies. Science 341, 88–91 (2013). [DOI] [PMC free article] [PubMed] [Google Scholar]
- 30.Seong J., Ouyang M., Kim T., Sun J., Wen P.-C., Lu S., Zhuo Y., Llewellyn N. M., Schlaepfer D. D., Guan J.-L., Chien S., Wang Y., Detection of focal adhesion kinase activation at membrane microdomains by fluorescence resonance energy transfer. Nat. Commun. 2, 406 (2011). [DOI] [PMC free article] [PubMed] [Google Scholar]
- 31.Che D. L., Duan L., Zhang K., Cui B., The dual characteristics of light-induced cryptochrome 2, Homo-oligomerization and heterodimerization, for optogenetic manipulation in mammalian cells. ACS Synth. Biol. 4, 1124–1135 (2015). [DOI] [PMC free article] [PubMed] [Google Scholar]
- 32.Cibrian D., Saiz M. L., de la Fuente H., Sánchez-Díaz R., Moreno-Gonzalo O., Jorge I., Ferrarini A., Vázquez J., Punzón C., Fresno M., Vicente-Manzanares M., Daudén E., Fernández-Salguero P. M., Martín P., Sánchez-Madrid F., CD69 controls the uptake of L-tryptophan through LAT1-CD98 and AhR-dependent secretion of IL-22 in psoriasis. Nat. Immunol. 17, 985–996 (2016). [DOI] [PMC free article] [PubMed] [Google Scholar]
- 33.Cabantous S., Terwilliger T. C., Waldo G. S., Protein tagging and detection with engineered self-assembling fragments of green fluorescent protein. Nat. Biotechnol. 23, 102–107 (2005). [DOI] [PubMed] [Google Scholar]
- 34.Miller K. E., Kim Y., Huh W.-K., Park H.-O., Bimolecular fluorescence complementation (BiFC) analysis: Advances and recent applications for genome-wide interaction studies. J. Mol. Biol. 427, 2039–2055 (2015). [DOI] [PMC free article] [PubMed] [Google Scholar]
- 35.Grünberg R., Burnier J. V., Ferrar T., Beltran-Sastre V., Stricher F., van der Sloot A. M., Garcia-Olivas R., Mallabiabarrena A., Sanjuan X., Zimmermann T., Serrano L., Engineering of weak helper interactions for high-efficiency FRET probes. Nat. Methods 10, 1021–1027 (2013). [DOI] [PubMed] [Google Scholar]
- 36.Müller K., Engesser R., Timmer J., Nagy F., Zurbriggen M. D., Weber W., Synthesis of phycocyanobilin in mammalian cells. Chem. Commun. 49, 8970–8972 (2013). [DOI] [PubMed] [Google Scholar]
- 37.Ash C., Dubec M., Donne K., Bashford T., Effect of wavelength and beam width on penetration in light-tissue interaction using computational methods. Lasers Med. Sci. 32, 1909–1918 (2017). [DOI] [PMC free article] [PubMed] [Google Scholar]
- 38.Chen S., Weitemier A. Z., Zeng X., He L., Wang X., Tao Y., Huang A. J. Y., Hashimotodani Y., Kano M., Iwasaki H., Parajuli L. K., Okabe S., Teh D. B. L., All A. H., Tsutsui-Kimura I., Tanaka K. F., Liu X., McHugh T. J., Near-infrared deep brain stimulation via upconversion nanoparticle-mediated optogenetics. Science 359, 679–684 (2018). [DOI] [PubMed] [Google Scholar]
- 39.Park S. I., Brenner D. S., Shin G., Morgan C. D., Copits B. A., Chung H. U., Pullen M. Y., Noh K. N., Davidson S., Oh S. J., Yoon J., Jang K.-I., Samineni V. K., Norman M., Grajales-Reyes J. G., Vogt S. K., Sundaram S. S., Wilson K. M., Ha J. S., Xu R., Pan T., Kim T.-i., Huang Y., Montana M. C., Golden J. P., Bruchas M. R., Gereau R. W. IV, Rogers J. A., Soft, stretchable, fully implantable miniaturized optoelectronic systems for wireless optogenetics. Nat. Biotechnol. 33, 1280–1286 (2015). [DOI] [PMC free article] [PubMed] [Google Scholar]
- 40.Jeong J.-W., McCall J. G., Shin G., Zhang Y., Al-Hasani R., Kim M., Li S., Sim J. Y., Jang K. I., Shi Y., Hong D. Y., Liu Y., Schmitz G. P., Xia L., He Z., Gamble P., Ray W. Z., Huang Y., Bruchas M. R., Rogers J. A., Wireless optofluidic systems for programmable in vivo pharmacology and optogenetics. Cell 162, 662–674 (2015). [DOI] [PMC free article] [PubMed] [Google Scholar]
- 41.Fox R. G., Lytle N. K., Jaquish D. V., Park F. D., Ito T., Bajaj J., Koechlein C. S., Zimdahl B., Yano M., Kopp J. L., Kritzik M., Sicklick J. K., Sander M., Grandgenett P. M., Hollingsworth M. A., Shibata S., Pizzo D., Valasek M. A., Sasik R., Scadeng M., Okano H., Kim Y., MacLeod A. R., Lowy A. M., Reya T., Image-based detection and targeting of therapy resistance in pancreatic adenocarcinoma. Nature 534, 407–411 (2016). [DOI] [PMC free article] [PubMed] [Google Scholar]
- 42.Lemke J., von Karstedt S., Zinngrebe J., Walczak H., Getting TRAIL back on track for cancer therapy. Cell Death Differ. 21, 1350–1364 (2014). [DOI] [PMC free article] [PubMed] [Google Scholar]
- 43.Ede C., Chen X., Lin M.-Y., Chen Y. Y., Quantitative analyses of core promoters enable precise engineering of regulated gene expression in mammalian cells. ACS Synth. Biol. 5, 395–404 (2016). [DOI] [PMC free article] [PubMed] [Google Scholar]
- 44.Gao X. J., Chong L. S., Kim M. S., Elowitz M. B., Programmable protein circuits in living cells. Science 361, 1252–1258 (2018). [DOI] [PMC free article] [PubMed] [Google Scholar]
- 45.Roybal K. T., Williams J. Z., Morsut L., Rupp L. J., Kolinko I., Choe J. H., Walker W. J., McNally K. A., Lim W. A., Engineering T cells with customized therapeutic response programs using synthetic notch receptors. Cell 167, 419–432.e16 (2016). [DOI] [PMC free article] [PubMed] [Google Scholar]
- 46.Boice M., Salloum D., Mourcin F., Sanghvi V., Amin R., Oricchio E., Jiang M., Mottok A., Denis-Lagache N., Ciriello G., Tam W., Teruya-Feldstein J., de Stanchina E., Chan W. C., Malek S. N., Ennishi D., Brentjens R. J., Gascoyne R. D., Cogné M., Tarte K., Wendel H.-G., Loss of the HVEM tumor suppressor in lymphoma and restoration by modified CAR-T cells. Cell 167, 405–418.e13 (2016). [DOI] [PMC free article] [PubMed] [Google Scholar]
- 47.Duan L., Hope J., Ong Q., Lou H.-Y., Kim N., McCarthy C., Acero V., Lin M. Z., Cui B., Understanding CRY2 interactions for optical control of intracellular signaling. Nat. Commun. 8, 547 (2017). [DOI] [PMC free article] [PubMed] [Google Scholar]
- 48.Eyquem J., Mansilla-Soto J., Giavridis T., van der Stegen S. J. C., Hamieh M., Cunanan K. M., Odak A., Gönen M., Sadelain M., Targeting a CAR to the TRAC locus with CRISPR/Cas9 enhances tumour rejection. Nature 543, 113–117 (2017). [DOI] [PMC free article] [PubMed] [Google Scholar]
- 49.Sun J., Lei L., Tsai C.-M., Wang Y., Shi Y., Ouyang M., Lu S., Seong J., Kim T.-J., Wang P., Huang M., Xu X., Nizet V., Chien S., Wang Y., Engineered proteins with sensing and activating modules for automated reprogramming of cellular functions. Nat. Commun. 8, 477 (2017). [DOI] [PMC free article] [PubMed] [Google Scholar]
Associated Data
This section collects any data citations, data availability statements, or supplementary materials included in this article.
Supplementary Materials
Supplementary material for this article is available at http://advances.sciencemag.org/cgi/content/full/6/8/eaay9209/DC1
Fig. S1. Nuclear translocation of LCmB is specific to blue light stimulation.
Fig. S2. Characterization of LINTAD-mediated gene induction in HEK 293T cells using dual-luciferase reporter system.
Fig. S3. LINTAD-mediated light-inducible gene expression in Jurkat cells.
Fig. S4. Lentiviral vectors used for T cell infection.
Fig. S5. Light stimulation system used for in vivo studies.
Fig. S6. The level of LINTAD gene activation depends on the expression level of regulators.
Fig. S7. Engineering of LINTAD with weak dimer helpers.
Fig. S8. LINTAD with weak dimer helpers in T cells.
Fig. S9. Design and lentiviral vectors used for in vivo cytotoxicity studies.
Table S1. Plasmids used in this study.
Movie S1. Light-induced nuclear translocation of LCB of the LINTAD system.
Movie S2. Light-inducible mNeonGreen expression in HEK 293T cells engineered with LINTAD gene activation system and the light-inducible mNeonGreen reporter.