

A frequency-encoded spatiotemporal focusing technology enables real-time optical wavefront shaping through thick scattering media.
Abstract
Optical wavefront shaping is a powerful tool for controlling photons in strongly scattering media. Its speed, however, has been the bottleneck for in vivo applications. Moreover, unlike spatial focusing, temporal focusing from a continuous-wave source has rarely been exploited yet is highly desired for nonlinear photonics. Here, we present a novel real-time frequency-encoded spatiotemporal (FEST) focusing technology. FEST focusing uses a novel programmable two-dimensional optical frequency comb with an ultrafine linewidth to perform single-shot wavefront measurements, with a fast single-pixel detector. This technique enables simultaneous spatial and temporal focusing at microsecond scales through thick dynamic scattering media. This technology also enabled us to discover the large-scale temporal shift, a new phenomenon that, with the conventional spatial memory effect, establishes a space-time duality. FEST focusing opens a new avenue for high-speed wavefront shaping in the field of photonics.
INTRODUCTION
In the field of biophotonics, e.g., imaging, optogenetics, and laser surgery, to name a few, focusing deep into living tissues is essential for precise diagnosis, manipulation, and treatment (1). The microscopic inhomogeneity inherent in biological objects, however, randomizes incident light and limits high-resolution biomedical applications to small depths, typically <1 mm in soft tissues (2–4), which has largely prevented biophotonic whole-body animal and human studies. To overcome this obstacle, the concept of wavefront shaping (5–7) has been developed and extensively applied to focus light deep into or through scattering media. By treating optical scattering as a deterministic process that has a fixed input-output relation, these technologies first measure the distorted optical wavefront resulting from multiple scattering events and subsequently phase-compensate the wavefront of a propagating beam sent into or through a scattering medium. Successful wavefront shaping relies on an assumption that multiple scattering events are invariant during the entire measurement-compensation process, which is only valid up until the scattering medium decorrelates. Therefore, the correlation time τc of a scattering medium sets an upper bound on the runtime of a wavefront-shaping system. Limited by long system runtimes, previous studies usually adopted static scattering media, such as rutile (TiO2) and zinc oxide (ZnO) pigments as demonstration samples (5). These scattering media are known to have correlation times of at least several hours—far longer than that of biological tissues, which typically have a correlation time of less than 1 ms due to physiological motions, such as breathing, heartbeats, and blood flow (8). As such, a high-speed wavefront-shaping technique providing a submillisecond runtime is highly demanded for biomedical applications.
The operation of a wavefront-shaping system typically consists of two processes: wavefront measurement and wavefront compensation. A low latency thus requires the rapid completion of both processes. Wavefront compensation is usually performed using a standard component called a spatial light modulator (SLM), which provides a large number of tiny light controllers to generate an optimal wavefront. State-of-the-art SLMs, such as SLMs based on ferroelectric liquid crystals (9), micro–electro-mechanical systems (MEMSs) (10), digital micromirror devices (11, 12), and grating light valves (GLVs) (13), can operate at tens to hundreds of kilohertz, resulting in a response time on the orders of microseconds. However, wavefront measurement, as an active process, lags the compensation process in terms of response time, typically ranging from seconds to minutes. There exist three different techniques to determine the optimal wavefront, including feedback-based wavefront shaping (5), transmission matrix measurement (6), and optical phase conjugation (OPC) (7). The former two approaches obtain the optimal wavefront through an iterative process that typically experiences thousands of measurements, which scales linearly with the number of control modes and results in a long system runtime that can easily take up to a few hours. MEMS-based SLMs associated with field-programmable gate array electronics and one-dimensional (1D) GLV phase modulators have recently been used to reduce system runtimes (10, 13). However, the number of control modes (or degrees of freedom) is limited to a few tens when the response times are on a millisecond scale, which inhibit their usefulness for biomedical applications. In contrast, OPC approaches determine the optimal wavefront in a few shots using 2D cameras (14). Although OPC methods can support wavefront optimizations with millions of degrees of freedom, a considerable amount of time is required to read out the data from the camera sensor arrays (9). To date, the fastest OPC system still takes a few milliseconds to measure the optimal wavefront and transfer the data to the computer or processor (12).
As the counterpart of spatial focusing into or through thick scattering media, temporal focusing (15–17) is highly desirable for deep-tissue nonlinear biophotonics, e.g., multiphoton-excited fluorescence-lifetime imaging microscopy and other nonlinear optical imaging (18), including two- and three-photon, second-harmonic generation, as well as coherent Raman scattering. In particular, spatiotemporal focusing (19–22) through wavefront shaping can largely increase the potential of photonic applications in the highly scattering regime. However, high-speed temporal focusing that generates a sharp pulse from a continuous-wave (CW) source has rarely been studied in the realm of wavefront shaping. Inspired by the concepts of parallel phase detection (23), space-time duality (24), and mode-locking technology, here we present a novel technology, termed frequency-encoded spatiotemporal (FEST) focusing, that generates a sharp spatiotemporal focus through a thick scattering medium. In contrast to the previous technologies (9,12) that measure a wavefront within a few milliseconds due to the low frame rate of cameras, FEST breaks this barrier by getting rid of cameras and determines the optimal wavefront in a single shot using a single-pixel detector at microsecond scales. Such a unique capability is enabled by encoding different spatial modes into a programmable 2D optical frequency comb (2D-OFC) with an ultrafine linewidth. Although the 1-kHz refresh rate of the SLM still limits the system runtime to be around 1 ms in our work, FEST is still faster than previous technologies and can potentially be further sped up by replacing our current SLM with the state-of-the-art ones. We anticipate that this work will broaden the horizon of wavefront-shaping technology and show promising potential in the field of OFCs generation (25–28).
RESULTS
The backbone of the FEST focusing system is a programmable 2D-OFC that is generated from a homebuilt CW laser with an ultrafine linewidth (1.8 kHz), as well as ultralow phase noise (1.3 μrad/Hz1/2) and relative intensity noise (−133 dBc/Hz) (see section S1). The 2D-OFC is used for both high-speed wavefront measurements and spatiotemporal focusing through the processes of parallel optical beating and localized mode locking, respectively. As conceptually sketched in Fig. 1A (also see section S2 and movie S1), a single-input laser beam with a kilohertz linewidth (Fig. 1B) is acousto-optically diffracted into a 2D-OFC beam array by driving two orthogonal acousto-optic deflectors (AODx,y) with specially designed multitone radiofrequency (RF) signals (sections S3 and S4). Each sub-beam of the generated 2D-OFC beam array has a unique frequency and angle, and its temporal light field is expressed as
| (1) |
which is a light field as a function of space (xm, yn, z) and time t. Here, m = 1, ⋯, M and n = 1, ⋯, N are the labeling of each sub-beam. Vm, n describes the amplitude of the sub-beam, determined by the acousto-optic diffraction. f0 is the optical frequency of the kHz laser, and fm, n is the frequency shift imposed by the AODx,y. Each sub-beam has a unique wave vector km, n, and θm, n = km, n∙ (xm, yn, z) is the space-dependent phase term arising from the angular dispersion after passing through the AODx,y. This phase term has a fixed value, which can be determined through a single calibration process (section S5). The 2D-OFC beam array then illuminates a high-speed SLM (HS-SLM), where the beam array is pixel-matched with the HS-SLM to perform independent 2D phase compensation for spatiotemporal focusing (Fig. 1C). A scattering medium is placed after the HS-SLM. The 2D-OFC beam array is thus randomized into a time-variant multifrequency speckle pattern (Fig. 1D), and the light field at the detection point becomes
| (2) |
Fig. 1. Principle of the real-time FEST focusing technology.
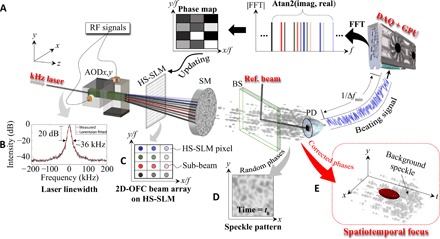
(A) A customized ultranarrow linewidth fiber laser, named kHz laser (B, see SM section S1), passes through two orthogonal acousto-optic deflectors (AODx,y) driven by specially designed multitone radiofrequency (RF) signals (section S3). The generated 2D-OFC beam array then feeds a high-speed spatial light modulator (HS-SLM), where the phase of each frequency-encoded sub-beam is controlled by a distinguishing pixel of the HS-SLM (C). The 2D-OFC beam array is subsequently randomized by a scattering medium (SM), resulting in a time-variant multifrequency scattered signal (D). It is then combined with a single-frequency reference beam through a beam splitter (BS) and beats at a high-speed photodetector (PD). The beating signal is sent to a fast signal processing unit, mainly including a fast data acquisition (DAQ) card and high-speed graphics processing unit (GPU), and converted to the frequency domain through fast Fourier transformation (FFT). The phase of each frequency component is retrieved by a four-quadrant inverse tangent operation [Atan2(imag, real)], and shaped into a 2D-conjugated phase map that is immediately addressed to the HS-SLM. A strong spatiotemporal focus (E) is thus generated through spatially phase locking among the optical frequencies. The whole FEST focusing system is controlled by a customized C++ algorithm with a low latency (section S7).
Here, the scattering medium spatially mixes the 2D-OFC beam array with coefficients Am, n exp (iφm, n), where Am, n and φm, n are the amplitude and phase modulation induced by scattering, respectively. The time-variant speckle light is then combined with a reference beam ER(xD, yD, zD, t) = VR exp [i2π(f0 + fr)t] at an optical frequency of f0 + fr through a beam splitter and beats at a high-speed photodetector (PD; aperture diameter <50 μm). When VR ≫ Am, nVm, n, we obtain an AC term from the beating signal
| (3) |
which is detailed in section S6. The beating signal is then digitized by a high-speed data acquisition card and sent to a graphics processing unit (GPU) for fast-phase retrieval. To this end, the beating signal is first converted to the frequency domain through fast Fourier transformation (FFT), resulting in M × N distinct peaks in the frequency spectrum. The phases φm, n are calculated by the four-quadrant inverse-tangent operation, followed by a subtraction of the calibration term θm, n (if necessary). The phase sequence is then shaped into a 2D-conjugated phase map according to the pixel matrix (Fig. 1C) and addressed to the HS-SLM, after which a spatiotemporal focus is generated (Fig. 1E). The complete FEST focusing system is controlled by a customized C++ program with low latency that operates in a continuous streaming mode (see section S7).
Following the definition in (5) for spatial focusing, we define the enhancement factor (EF) for the spatiotemporal focusing as
| (4) |
where μ is a coefficient related to the updating condition of the phase map, i.e., π/4 and 1/π for full and binary phase maps, respectively; Nf represents the number of comb teeth (i.e., the number of degrees of freedom) provided by the 2D-OFC beam array; Ns is the number of spatial modes in the spatiotemporal focus (5); and Nt is the number of temporal modes (29) given by
| (5) |
Here, τFEST is the full width at half maximum (FWHM) of the pulse generated by the FEST focusing system, while τTL is the transform-limited pulsewidth according to the effective bandwidth ∆feff of a beating signal. τTL can be calculated from the time-bandwidth product (TBP) of an optical pulse, e.g., τTL × ∆feff = 2 ln 2/π for a Gaussian pulse.
Figure 2 illustrates the performance metrics of the 2D-OFC beam array generation in the FEST focusing system, where the array size can be flexibly configured according to the criteria detailed in section S3. Figure 2 (A to C) shows 2D-OFC beam arrays with sub-beam numbers of 3080 (55 × 56), 1260 (35 × 36), and 552 (23 × 24), respectively. As can be observed, no obvious intermodulation product is detected. Please be aware that the elliptical sub-beam shapes are due to the rectangular apertures of the AODs used in the current system (inset of Fig. 2C). Although this elliptical sub-beam shape does not cause serious problems for wavefront-shaping applications, we emphasize that circular-shaped spots, which are highly desirable for typical high-resolution imaging applications (30–32), can be achieved by using AODs with circular apertures (section S4). The frequency distribution over the 2D-OFC beam array appears to be tilted, with respect to the xy plane (Fig. 2D). The multitone drive signals of the AODs were specially designed to avoid strong constructive interference that leads to high peak power and generate well-separated sub-beams in both x and y directions without imposing a severe requirement on the AODs’ RF resolutions or introducing engineering complexity in the system design (section S3.4). In the following demonstrations, a 2D-OFC beam array with dimensions of 35 × 36 will mainly be used as this setting provides more than 1000 sub-beams with well-separated spots on the HS-SLM. A typical beating signal with small features is presented in Fig. 2E, measured by combining the time-variant scattered signal with the reference beam. Consistent with the temporal lengths of the multitone RF signals used to drive the AODs, the beating signal has a duration of about 65.5 μs. The frequency components contained in the beating signal can be visualized after FFT, as shown in Fig. 2F. Notably, the frequencies corresponding to the peaks are not evenly distributed in the frequency spectrum and become slightly denser toward the center of the spectrum. To provide a better understanding of how the 2D-OFC beam array avoids frequency overlapping and effectively uses the RF bandwidth, the frequency spacings across the whole spectrum are calculated and presented in Fig. 2G. As an intriguing feature, there are some largely separated frequencies whose spacings manifest as a “v” shape and decrease toward the center. In addition to these largely separated frequencies, the remaining frequencies (~95%, indicated by the red dashed rectangle in Fig. 2G) are evenly distributed with a separation of about 26 kHz; see Fig. 2H, i.e., the center of the spectrum as indicated in Fig. 2 (F and G).
Fig. 2. Programmable 2D-OFC beam arrays.
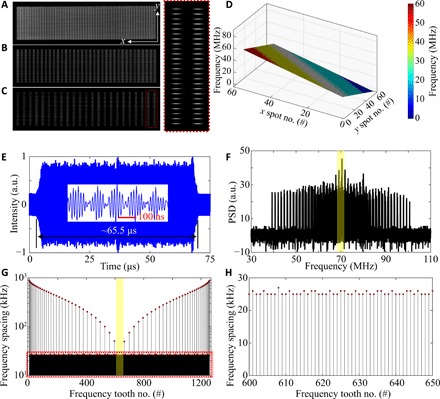
(A to C) 2D-OFC beam arrays that have 55 × 56, 35 × 36, and 23 × 24 array sizes, respectively. The inset on the right side shows a close-up of the sub-beams inside the red dashed rectangle in (C). (D) Frequency distribution over the 2D-OFC beam array of (A). Similar distributions are also designed for (B) and (C). The total RF bandwidth over the 2D-OFC beam array is about 60 MHz, set by the existing AODs. (E) Typical beating signal after combining the 2D-OFC beam array (B; i.e., the one used in all following demonstrations) with the reference beam at the PD. The total time duration of the beating signal is ~65.5 μs, defined by the pattern lengths of multitone RF signals used in this work. The inset exhibits small features of the beating signal. (F) Frequency spectrum of the beating signal after performing FFT to the beating signal (E). (G) Frequency spacing between the peaks in (F). Except for a few largely spaced frequencies arranged in a “v” shape, ~95% of the frequencies, indicated by the red dashed rectangle in (G), have a consistent frequency spacing of ~26 kHz. (H) Close-up of the frequency spacing at the center of the frequency spectrum, indicated by the yellow rectangles in both (F) and (G). PSD, power spectral density; a.u., arbitrary units.
To demonstrate spatiotemporal focusing through thick scattering media, two pieces of ground glass diffusers (120 grit) are stacked together as a sample. Figure 3A is the conjugated phase map measured by the FEST focusing system. The phase error is measured to be ~4.7% (root mean square) in the single-shot mode (sections S8 and S9). A spatiotemporal focus is generated after addressing the conjugated phase map to a binary-phase HS-SLM, as shown in Fig. 3 (B and C). A sharp temporal focus, about 19-ns pulsewidth (Fig. 3B), is formed in the time domain due to phase locking and thus the constructive interference among the optical frequencies that reach the probing area. In contrast, only a weak random background generated by the random summation of multifrequency scattered light is observed when a random phase map is addressed to the HS-SLM (left inset of Fig. 3B). Since the phase locking only occurs within a tiny probing area, i.e., the sensing size of the PD (<50 μm), a bright spatial focus is simultaneously generated along with the temporal focus, as shown in Fig. 3C. Limited by the speed of cameras, the spatiotemporal focus is indirectly measured by scanning a high-speed PD across the xy plane while the spatiotemporal focus is repeated. Figure 3D shows a snapshot of the spatiotemporal focus. As mentioned before, the rectangle-shaped 2D-OFC beam array also results in an elliptical focal spot. For the case without phase correction, only a weak time-variant speckle pattern is detected (Fig. 3E). The spatiotemporal focus provides a local intensity enhancement of ~125, about 30% of the theoretical value calculated using Eq. 4. A higher EF can potentially be obtained by either increasing the number of sub-beams of the 2D-OFC beam array or replacing the binary-phase HS-SLM with a full-phase SLM. Please note that, different implementations of the frequency-encoding wavefront shaping have been demonstrated for spatial focusing in previous studies (23,33), which, however, have orders of magnitude lower speeds. In addition, during preparation of this manuscript, another independently developed work using an AOD for wavefront measurement was also reported, albeit with a long system runtime and limited degrees of freedom (34).
Fig. 3. Spatiotemporal focusing through a scattering medium.
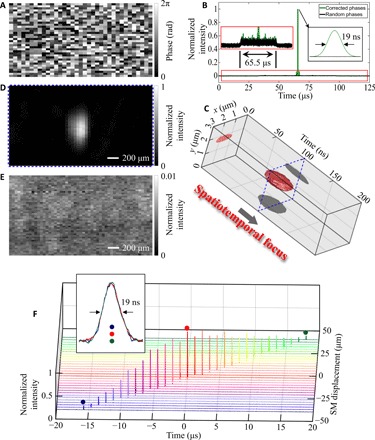
Two pieces of optical diffusers (Thorlabs DG10-120) stacked together are used as the scattering medium. (A) Conjugated phase map measured by the FEST focusing system. Note that this full-phase map needs to be converted to a binary version when it is addressed to the binary-phase HS-SLM used in this work. (B) Temporal focus generated when the corrected phase map (A) is addressed to the HS-SLM. The temporal focus results from the phase locking among the frequencies presented in the probing location. The red rectangle zooms in the noise floor of the temporal signal. The black rectangle shows a close-up of the generated sharp pulse, compressed to a pulsewidth of ~19 ns. The black curve corresponds to the case that a random phase map is addressed to the HS-SLM. (C) Spatiotemporal focus measured by scanning the fast PD on the xy plane (see also movie S2). (D) Snapshot of the spatiotemporal focus, indicated by the blue dashed rectangle in (C), while (E) shows the case when a random phase map is addressed to the HS-SLM. (F) Temporal shift effect measurement. During the measurement, a phase map, which has been generated for the temporal focus at the center of the time axis (indicated by the red dot), is fixed on the HS-SLM. The temporal focus is shifted by ~34.9 μs when the scattering medium is laterally moved from −40 μm to +40 μm in the x direction. The inset shows the temporal focus at three displacements of scattering medium (indicated by blue, red, and green dots), where they are horizontally aligned and vertically normalized to show the consistency of the temporal focus pulsewidth.
The memory effect (35,36), as a powerful tool for 2D laser scanning inside or through scattering media, has been widely adopted to improve the scanning speed in imaging systems assisted by wavefront shaping (3). Inspired by the concept of space-time duality (24), the “temporal memory effect” that enables temporal shift of the generated pulse is investigated using the FEST focusing system. To this end, a temporal focus is first generated by the FEST focusing system, indicated by the red dot in Fig. 3F. The temporal focus is found to undergo a temporal shift of about 34.9 μs when the scattering medium is laterally moved by 80 μm, corresponding to FWHMs of 13.7 μs and 31.3 μm, respectively, while the phase map on the HS-SLM and other system settings are all fixed. The intensity of the temporal focus decreases as it moves away from the reference time “0 μs”, which the wavefront optimization has been generated for, while the pulsewidth of the temporal focus remains constant (inset of Fig. 3F). This new capability provided by the FEST focusing technology can potentially be applied to time-resolved pump-probe diagnosis in thick scattering media.
Successful 2D bright-field imaging through a scattering medium is also demonstrated using the FEST focusing system. Various samples placed about 5 mm after the scattering medium are xy scanned by using motorized translation stages, while the PD records the optical temporal signal. First, a positive resolution target (USAF 1951) is imaged, as shown in Fig. 4 (A and B) (fig. S10 for the finer groups). A high-contrast image is obtained only when a spatiotemporal focus is formed. The image contrast difference is illustrated in Fig. 4C, which shows the profiles of the same line scan indicated in Fig. 4 (A and B). The spatial resolution of the FEST imaging system is quantified to be about 4.3 μm (fig. S10). The elegance of the spatiotemporal focusing provided by our FEST technology can also be applied to fluorescence microscopy—a standard optical imaging technology for biomedical diagnosis that is, however, limited to small depths due to wavefront distortion caused by optical scattering. Figure 4D shows the fluorescence signal of a sample of rhodamine 590 dye contained in a glass cuvette (inset photo). A sharp fluorescence pulse is generated by the spatiotemporal focus, while only a fluorescence background signal excited by the scattered light is detected when no spatiotemporal focus is presented. The generation of a sharp fluorescence pulse is then utilized to perform 2D fluorescence imaging. For a demonstration on a biological sample, a mouse kidney tissue stained with Alexa Fluor 488 wheat germ agglutinin (W-11261), Alexa Fluor 568 phalloidin (A-12380), and 4′,6-diamidino-2-phenylindole (D-1306) is placed after a scattering medium, in this case, a chicken breast tissue (~1-mm thickness). Following a similar scanning scheme, a fluorescence image is captured (Fig. 4E). Compared with its bright-field counterpart (Fig. 4F), the fluorescence image exhibits a reasonably good contrast.
Fig. 4. Imaging through scattering media.
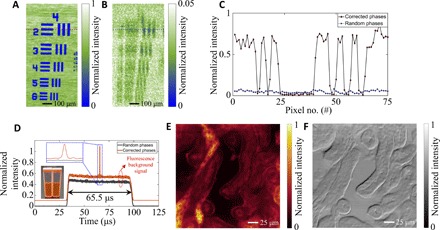
2D imaging is performed by xy-scanning the samples that are placed about 5 mm behind the scattering media, i.e., two optical diffusers and a breast chicken tissue for (A) to (C) and (D) to (F), respectively. (A and B) Bright-field images of a resolution target (group 4, USAF 1951) with corrected and random phase maps addressed to the HS-SLM, respectively. Images of other finer groups are also provided in fig. S10. Note that the intensities of (A) and (B) have been normalized to the maximum of (A). (C) Two line scans of images (A) and (B), respectively, indicated by the dotted lines. (D) Fluorescence signals of the rhodamine 590 dye (inset photo) with corrected (orange curve) and random (black curve) phase maps, detected by an experimental setup presented in fig. S2B. The top left inset shows the sharp fluorescence pulse generated by the spatiotemporal focus. Please note that the orange curve has been vertically offset for better visualization. (E and F) Fluorescence and bright-field images of a mouse kidney tissue (Thermo Fisher Scientific FluoCells Prepared Slide #3), captured at the emission and excitation wavelengths, respectively. [Photo credit for the inset of (D): Xiaoming Wei.]
Focusing through dynamic scattering samples requires wavefront-shaping systems to operate continuously at low latencies—a high-speed streaming mode that has rarely been demonstrated in previous studies (12). To this end, a customized C++ software is used to control the operation of the FEST focusing system. The software has a net latency of ~560 μs, encompassing data acquisition, FFT calculation, phase extraction, and conjugated phase map formation (section S7). In dynamic studies, two different scattering samples, an ex vivo chicken breast tissue (~3.0 mm thick) mounted on a motorized translational stage and an in vivo mouse (ear and dorsal skin, about 2.8 mm thick for the latter case), are investigated (Fig. 5A). The decorrelation time of the moving chicken breast tissue changes from 3.3 to 0.9 ms when its velocity increases from 0.5 to 1.5 mm/s (Fig. 5B). The intensity enhancement of the temporal focus, as shown in Fig. 5C, is dramatically reduced (from 41 to 15) when the decorrelation time of the scattering sample is decreased to the level of the system runtime, i.e., about 1.0 ms in this case. Here, we define the effective speed of the FEST system as the decorrelation time of the dynamic sample that provides an enhancement reduction of 1/e, i.e., the case shown in Fig. 5C. The decorrelation characteristics of the living mouse ear and dorsal skin exhibit different features (Fig. 5, D and E). The mouse ear shows both fast decorrelation arising from blood scattering and breathing (Fig. 5D) and slow decorrelation due to other slow motions. The mouse dorsal skin, on the other hand, only shows the fast decorrelation feature and results in a decorrelation time of about 5.3 ms (Fig. 5E). Figure 5F shows the peak intensity evolution of a sustained temporal focus generated through the living mouse ear when the FEST focusing system continuously updates (blue curve). In contrast, the temporal focus gradually diminishes due to slow motions when the corrected phase map is only updated once at t = 0 second (dark teal curve of Fig. 5E), which matches well with the correlation measurement shown in Fig. 5D. In addition to the slowly vanishing envelope, breathing also results in repeated fast fluctuations. The sequence of the peak intensities of temporal foci generated through the fast-decorrelated living mouse dorsal skin is shown in Fig. 5G, where a decreased intensity enhancement of 36 is obtained (see the inset).
Fig. 5. Dynamically focusing through scattering media.
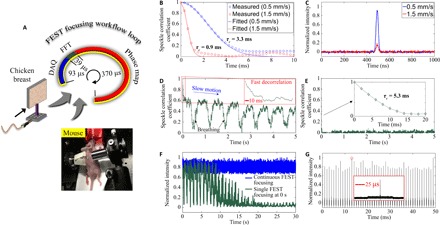
(A) Workflow diagram of the continuously streaming FEST focusing system. The bottom left insets show two dynamic scattering samples that are used for dynamic studies, i.e., chicken breast tissue mounted on a motorized translation stage and a living mouse. (B) Correlation curves of the chicken breast tissue moving at two different speeds, i.e., 0.5 and 1.5 mm/s, resulting in decorrelation times of 3.3 and 0.9 ms, respectively. (C) Temporal foci through the moving chicken breast tissue with different decorrelation times. (D) Correlation curve of the living mouse ear. (E) Correlation curve of the living mouse dorsal skin. (F) Peak intensity evolutions of the temporal foci generated through the living mouse ear, when the FEST focusing system continuously updates the phase map (blue curve) and when the phase map updates only once at the very beginning (i.e., t = 0 second, dark teal curve). (G) Sequence of the peak intensities of temporal foci generated through the living mouse dorsal skin. The inset shows a close-up of the temporal focus as indicated by the red circle. [Photo credit for the inset of (A): Xiaoming Wei.]
DISCUSSION
The current performance of our FEST focusing system can be greatly improved further in future studies through the following strategies. First, the maximum number of sub-beams of our current FEST focusing system is about 3000, limited by the TBP of the AODs used in this proof-of-concept study, i.e., <60 in each direction. The number of sub-beams can be further increased by using AODs with a larger TBP. State-of-the-art AODs can provide a TBP on the order of hundreds, indicating that in the ideal situation, each direction can support up to hundreds of sub-beams. However, such a large TBP is also challenging from an engineering perspective. Nevertheless, there is certainly considerable room for improvement, because 256 frequencies have successfully been applied to multispot-illuminated imaging (30). Second, the pulsewidth of the generated temporal focus is currently tens of nanoseconds, while a much shorter one can potentially be obtained through expanding the spectral bandwidth of the 2D-OFC. This can be realized by either using AODs with larger RF bandwidths (>1 GHz is available from the market) or leveraging parametric frequency comb generation (27) and dual-comb detection (37, 38) for down-converting the optical frequencies to the RF domain. As such, a spatiotemporal focus with subpicosecond pulsewidth can be generated, which is of great use for nonlinear photonics, e.g., multiphoton microscopy and fluorescence lifetime imaging. Third, the guidestar of our current FEST focusing system is the PD while virtual guidestars, for example, photoacoustic detection (39) and fluorescence detection (40), can be used to perform spatiotemporal focusing inside thick scattering media.
MATERIALS AND METHODS
2D-OFC generation
The 2D-OFC generation starts from a customized single longitudinal mode fiber laser at 532 nm that has a linewidth of 1.8 kHz and an average power of ~7 W. Inherited from an ultranarrow linewidth of the kHz laser, the 2D-OFC provided excellent performances in terms of phase and intensity noises. The kHz laser was launched through two orthogonal AODs (IntraAction AOM-802AF1 and AOM-505AF1) driven by specially designed multitone RF signals, which deflected the single-input laser beam into multiple sub-beams in both x and y directions simultaneously. Both AODs had an RF bandwidth of about 30 MHz (but centered at 80 and 50 MHz, respectively). The specifications of the AODs and multitone RF signals were carefully designed to generate a well-separated frequency distribution. The multitone signals were generated by a dual-channel arbitrary waveform generator (Rigol DG4162). The initial phases of the multitone RF signals were randomized to reduce the peak-to-average amplitude ratio and thus avoid pulse generation in the AODs. In addition, the uniformness over the 2D-OFC was also optimized by engineering the amplitude of each comb tooth.
In vivo animal study
The animal study was carried out in conformity with laboratory animal protocols approved by the Office of Laboratory Animal Resources at the California Institute of Technology. An adult 2- to 3-month-old female mouse (Hsd:Athymic Nude-FoxlNU, Harlan) was used for the in vivo experiment—spatiotemporal focusing through the mouse ear. Throughout the experiment, the mouse was anesthetized by using 1.5% vaporized isoflurane. The anesthetized mouse was laid on a customized flat animal platform that also provided anesthetic gas, and the mouse ear was roughly located at the imaging plane of an illumination objective lens, while a second objective lens positioned about 5 mm from the mouse ear was used to collect the scattered light. After the in vivo experiment, the animal was removed from the setup and euthanized immediately by cervical dislocation.
Supplementary Material
Acknowledgments
We thank HC Photonics for providing the PPLN crystal oven, H.-C. Chui for discussion on the frequency doubling, H. Mikami for insightful discussion on the AOD operation, and Y. Li for preparing the animation illustration of the principle. Funding: Funding was provided by Local Innovative and Research Teams Project of Guangdong Pearl River Talents Program No. 2017BT01X137, China, and NIH grant nos. DP1 EB016986 (NIH Director’s Pioneer Award) and R01 CA186567 (NIH Director’s Transformative Research Award). Author contributions: X.W. and Y.S. designed the system. X.W. built the system and conducted the experiments. Y.S. theoretically analyzed and optimized the 2D-OFC. J.C.J. programmed the control system and user interface. A.S.H. initiated the GPU processing system and the use of orthogonal AODs for frequency-encoded wavefront measurement. C.Y., S.X., and Z.Y. designed, built, and characterized the ultranarrow linewidth fiber laser system. Z.Y. and L.V.W. supervised the project. All authors wrote the manuscript and commented on it. Competing interests: X.W., Y.S., J.C.J., and L.V.W. have a provisional patent application entitled “Frequency-encoded spatiotemporal (FEST) focusing”, US Provisional 62/817,415, through the California Institute of Technology, Pasadena, CA. The other authors declare that they have no competing interests. Data and materials availability: All data needed to evaluate the conclusions in the paper are present in the paper and/or the Supplementary Materials. Additional data related to this paper may be requested from the authors.
SUPPLEMENTARY MATERIALS
Supplementary material for this article is available at http://advances.sciencemag.org/cgi/content/full/6/8/eaay1192/DC1
Supplementary Text
Section S1. Ultranarrow linewidth fiber laser
Section S2. Full configuration of the FEST focusing system
Section S3. Design of the driving RF signals for the 2D-OFC generation
Section S4. Generation of the 2D-OFC beam array
Section S5. Phase curvature of the 2D-OFC beam array
Section S6. Mathematical description of the FEST focusing system
Section S7. C++ control program
Section S8. Effect of the laser linewidth on the wavefront measurement
Section S9. Accuracy and reliability of wavefront measurement using FEST technology
Fig. S1. Ultranarrow linewidth fiber laser and its basic performances.
Fig. S2. Full configuration of the FEST focusing system.
Fig. S3. Design of the 2D-OFC spatial map when N = M + 1.
Fig. S4. Multitone RF signals.
Fig. S5. Flatness optimization in the x direction.
Fig. S6. Flatness optimization in the y direction.
Fig. S7. Typical phase curvature of the 2D-OFC beam array.
Fig. S8. Effect of the laser linewidth on the FEST performance.
Fig. S9. Relative phase measurement.
Fig. S10. Scanned images of the resolution target through the scattering medium using FEST focusing technology.
Movie S1. Principle of FEST focusing technology.
Movie S2. Spatiotemporal focusing.
REFERENCES AND NOTES
- 1.Yun S. H., Kwok S. J. J., Light in diagnosis, therapy and surgery. Nat. Biomed. Eng. 1, 0008 (2017). [DOI] [PMC free article] [PubMed] [Google Scholar]
- 2.Mosk A. P., Lagendijk A., Lerosey G., Fink M., Controlling waves in space and time for imaging and focusing in complex media. Nat. Photonics 6, 283–292 (2012). [Google Scholar]
- 3.Horstmeyer R., Ruan H., Yang C., Guidestar-assisted wavefront-shaping methods for focusing light into biological tissue. Nat. Photonics 9, 563–571 (2015). [DOI] [PMC free article] [PubMed] [Google Scholar]
- 4.Yu H., Park J., Lee K. R., Yoon J., Kim K. D., Lee S., Park Y. K., Recent advances in wavefront shaping techniques for biomedical applications. Curr. Appl. Phys. 15, 632–641 (2015). [Google Scholar]
- 5.Vellekoop I. M., Mosk A. P., Focusing coherent light through opaque strongly scattering media. Opt. Lett. 32, 2309–2311 (2007). [DOI] [PubMed] [Google Scholar]
- 6.Popoff S. M., Lerosey G., Carminati R., Fink M., Boccara A. C., Gigan S., Measuring the transmission matrix in optics: An approach to the study and control of light propagation in disordered media. Phys. Rev. Lett. 104, 100601 (2010). [DOI] [PubMed] [Google Scholar]
- 7.Yaqoob Z., Psaltis D., Feld M. S., Yang C., Optical phase conjugation for turbidity suppression in biological samples. Nat. Photonics 2, 110–115 (2008). [DOI] [PMC free article] [PubMed] [Google Scholar]
- 8.McDowell E. J., Cui M., Vellekoop I. M., Senekerimyan V. A., Yaqoob Z., Yang C., Turbidity suppression from the ballistic to the diffusive regime in biological tissues using optical phase conjugation. J. Biomed. Opt. 15, 025004 (2010). [DOI] [PMC free article] [PubMed] [Google Scholar]
- 9.Liu Y., Ma C., Shen Y., Shi J., Wang L. V., Focusing light inside dynamic scattering media with millisecond digital optical phase conjugation. Optica 4, 280–288 (2017). [DOI] [PMC free article] [PubMed] [Google Scholar]
- 10.Blochet B., Bourdieu L., Gigan S., Focusing light through dynamical samples using fast continuous wavefront optimization. Opt. Lett. 42, 4994–4997 (2017). [DOI] [PubMed] [Google Scholar]
- 11.Conkey D. B., Caravaca-Aguirre A. M., Piestun R., High-speed scattering medium characterization with application to focusing light through turbid media. Opt. Express 20, 1733–1740 (2012). [DOI] [PubMed] [Google Scholar]
- 12.Wang D., Zhou E. H., Brake J., Ruan H., Jang M., Yang C., Focusing through dynamic tissue with millisecond digital optical phase conjugation. Optica 2, 728–735 (2015). [DOI] [PMC free article] [PubMed] [Google Scholar]
- 13.O. Tzang, E. Niv, S. Singh, S. Labouesse, G. Myatt, R. Piestun, Wavefront shaping in complex media at 350 KHz with a 1D-to-2D transform. arXiv:1808.09025 (2018).
- 14.Cui M., Yang C., Implementation of a digital optical phase conjugation system and its application to study the robustness of turbidity suppression by phase conjugation. Opt. Express 18, 3444–3455 (2010). [DOI] [PMC free article] [PubMed] [Google Scholar]
- 15.Oron D., Tal E., Silberberg Y., Scanningless depth-resolved microscopy. Opt. Express 13, 1468–1476 (2005). [DOI] [PubMed] [Google Scholar]
- 16.Zhu G., van Howe J., Durst M., Zipfel W., Xu C., Simultaneous spatial and temporal focusing of femtosecond pulses. Opt. Express 13, 2153–2159 (2005). [DOI] [PubMed] [Google Scholar]
- 17.Papagiakoumou E., Anselmi F., Bègue A., de Sars V., Glückstad J., Isacoff E. Y., Emiliani V., Scanless two-photon excitation of channelrhodopsin-2. Nat. Methods 7, 848–854 (2010). [DOI] [PMC free article] [PubMed] [Google Scholar]
- 18.Zipfel W. R., Williams R. M., Webb W. W., Nonlinear magic: Multiphoton microscopy in the biosciences. Nat. Biotechnol. 21, 1369–1377 (2003). [DOI] [PubMed] [Google Scholar]
- 19.Aulbach J., Gjonaj B., Johnson P. M., Mosk A. P., Lagendijk A., Control of light transmission through opaque scattering media in space and time. Phys. Rev. Lett. 106, 103901 (2011). [DOI] [PubMed] [Google Scholar]
- 20.Katz O., Small E., Bromberg Y., Silberberg Y., Focusing and compression of ultrashort pulses through scattering media. Nat. Photonics 5, 372–377 (2011). [Google Scholar]
- 21.McCabe D. J., Tajalli A., Austin D. R., Bondareff P., Walmsley I. A., Gigan S., Chatel B., Spatio-temporal focusing of an ultrafast pulse through a multiply scattering medium. Nat. Commun. 2, 447 (2011). [DOI] [PubMed] [Google Scholar]
- 22.Mounaix M., Andreoli D., Defienne H., Volpe G., Katz O., Grésillon S., Gigan S., Spatiotemporal coherent control of light through a multiple scattering medium with the multispectral transmission matrix. Phys. Rev. Lett. 116, 253901 (2016). [DOI] [PubMed] [Google Scholar]
- 23.Cui M., Parallel wavefront optimization method for focusing light through random scattering media. Opt. Lett. 36, 870–872 (2011). [DOI] [PubMed] [Google Scholar]
- 24.Kolner B. H., Space-time duality and the theory of temporal imaging. IEEE J. Quant. Electron. 30, 1951–1963 (1994). [Google Scholar]
- 25.Udem T., Holzwarth R., Hänsch T. W., Optical frequency metrology. Nature 416, 233–237 (2002). [DOI] [PubMed] [Google Scholar]
- 26.Cundiff S. T., Ye J., Colloquium: Femtosecond optical frequency combs. Rev. Mod. Phys. 75, 325–342 (2003). [Google Scholar]
- 27.Del'Haye P., Schliesser A., Arcizet O., Wilken T., Holzwarth R., Kippenberg T. J., Optical frequency comb generation from a monolithic microresonator. Nature 450, 1214–1217 (2007). [DOI] [PubMed] [Google Scholar]
- 28.Bao Y., Yi X., Li Z., Chen Q., Li J., Fan X., Zhang X., A digitally generated ultrafine optical frequency comb for spectral measurements with 0.01-pm resolution and 0.7-μs response time. Light Sci. Appl. 4, e300 (2015). [Google Scholar]
- 29.Popoff S. M., Lerosey G., Fink M., Boccara A. C., Gigan S., Controlling light through optical disordered media: Transmission matrix approach. New J. Phys. 13, 123021 (2011). [Google Scholar]
- 30.Diebold E. D., Buckley B. W., Gossett D. R., Jalali B., Digitally synthesized beat frequency multiplexing for sub-millisecond fluorescence microscopy. Nat. Photonics 7, 806–810 (2013). [Google Scholar]
- 31.Mikami H., Harmon J., Kobayashi H., Hamad S., Wang Y., Iwata O., Suzuki K., Ito T., Aisaka Y., Kutsuna N., Nagasawa K., Watarai H., Ozeki Y., Goda K., Ultrafast confocal fluorescence microscopy beyond the fluorescence lifetime limit. Optica 5, 117–126 (2018). [Google Scholar]
- 32.Nitta N., Sugimura T., Isozaki A., Mikami H., Hiraki K., Sakuma S., Iino T., Arai F., Endo T., Fujiwaki Y., Fukuzawa H., Hase M., Hayakawa T., Hiramatsu K., Hoshino Y., Inaba M., Ito T., Karakawa H., Kasai Y., Koizumi K., Lee S. W., Lei C., Li M., Maeno T., Matsusaka S., Murakami D., Nakagawa A., Oguchi Y., Oikawa M., Ota T., Shiba K., Shintaku H., Shirasaki Y., Suga K., Suzuki Y., Suzuki N., Tanaka Y., Tezuka H., Toyokawa C., Yalikun Y., Yamada M., Yamagishi M., Yamano T., Yasumoto A., Yatomi Y., Yazawa M., Di Carlo D., Hosokawa Y., Uemura S., Ozeki Y., Goda K., Intelligent image-activated cell sorting. Cell 175, 266–276.e13 (2018). [DOI] [PubMed] [Google Scholar]
- 33.Tang J., Germain R. N., Cui M., Superpenetration optical microscopy by iterative multiphoton adaptive compensation technique. Proc. Natl. Acad. Sci. U.S.A. 109, 8434–8439 (2012). [DOI] [PMC free article] [PubMed] [Google Scholar]
- 34.Feldkhun D., Tzang O., Wagner K. H., Piestun R., Focusing and scanning through scattering media in microseconds. Optica 6, 72–75 (2019). [Google Scholar]
- 35.Feng S., Kane C., Lee P. A., Stone A. D., Correlations and fluctuations of coherent wave transmission through disordered media. Phys. Rev. Lett. 61, 834–837 (1988). [DOI] [PubMed] [Google Scholar]
- 36.Judkewitz B., Horstmeyer R., Vellekoop I. M., Papadopoulos I. N., Yang C., Translation correlations in anisotropically scattering media. Nat. Phys. 11, 684–689 (2015). [Google Scholar]
- 37.Picqué N., Hänsch T. W., Frequency comb spectroscopy. Nat. Photonics 13, 146–157 (2019). [Google Scholar]
- 38.Gaeta A. L., Lipson M., Kippenberg T. J., Photonic-chip-based frequency combs. Nat. Photonics 13, 158–169 (2019). [Google Scholar]
- 39.Kong F., Silverman R. H., Liu L., Chitnis P. V., Lee K. K., Chen Y. C., Photoacoustic-guided convergence of light through optically diffusive media. Opt. Lett. 36, 2053–2055 (2011). [DOI] [PMC free article] [PubMed] [Google Scholar]
- 40.Vellekoop I. M., Aegerter C. M., Scattered light fluorescence microscopy: Imaging through turbid layers. Opt. Lett. 35, 1245–1247 (2010). [DOI] [PubMed] [Google Scholar]
- 41.Xu S., Yang Z., Zhang W., Wei X., Qian Q., Chen D., Zhang Q., Shen S., Peng M., Qiu J., 400 mW ultrashort cavity low-noise single-frequency Yb3+-doped phosphate fiber laser. Opt. Lett. 36, 3708–3710 (2011). [DOI] [PubMed] [Google Scholar]
- 42.Chen H.-W., Chang G., Xu S., Yang Z., Kärtner F. X., 3 GHz, fundamentally mode-locked, femtosecond Yb-fiber laser. Opt. Lett. 37, 3522–3524 (2012). [DOI] [PubMed] [Google Scholar]
- 43.Cui M., A high speed wavefront determination method based on spatial frequency modulations for focusing light through random scattering media. Opt. Express 19, 2989–2995 (2011). [DOI] [PubMed] [Google Scholar]
- 44.Chang I. C., Acoustooptic devices and applications. IEEE Trans. Sonics Ultrason. 23, 2–21 (1976). [Google Scholar]
- 45.Henry C., Theory of the linewidth of semiconductor lasers. IEEE J. Quantum Electron. 18, 259–264 (1982). [Google Scholar]
- 46.Mussot A., Lantz E., Maillotte H., Sylvestre T., Finot C., Pitois S., Spectral broadening of a partially coherent CW laser beam in single-mode optical fibers. Opt. Express 12, 2838–2843 (2004). [DOI] [PubMed] [Google Scholar]
Associated Data
This section collects any data citations, data availability statements, or supplementary materials included in this article.
Supplementary Materials
Supplementary material for this article is available at http://advances.sciencemag.org/cgi/content/full/6/8/eaay1192/DC1
Supplementary Text
Section S1. Ultranarrow linewidth fiber laser
Section S2. Full configuration of the FEST focusing system
Section S3. Design of the driving RF signals for the 2D-OFC generation
Section S4. Generation of the 2D-OFC beam array
Section S5. Phase curvature of the 2D-OFC beam array
Section S6. Mathematical description of the FEST focusing system
Section S7. C++ control program
Section S8. Effect of the laser linewidth on the wavefront measurement
Section S9. Accuracy and reliability of wavefront measurement using FEST technology
Fig. S1. Ultranarrow linewidth fiber laser and its basic performances.
Fig. S2. Full configuration of the FEST focusing system.
Fig. S3. Design of the 2D-OFC spatial map when N = M + 1.
Fig. S4. Multitone RF signals.
Fig. S5. Flatness optimization in the x direction.
Fig. S6. Flatness optimization in the y direction.
Fig. S7. Typical phase curvature of the 2D-OFC beam array.
Fig. S8. Effect of the laser linewidth on the FEST performance.
Fig. S9. Relative phase measurement.
Fig. S10. Scanned images of the resolution target through the scattering medium using FEST focusing technology.
Movie S1. Principle of FEST focusing technology.
Movie S2. Spatiotemporal focusing.