Abstract
In this work, 502 experimental data for CO2 solubilities and 132 for Henry's constants of CO2 in DESs were comprehensively summarized from literatures and used for further verification and development of COSMO-RS. Large systematic deviations of 62. 2, 59.6, 63.0, and 59.1% for the logarithmic CO2 solubilities in the DESs (1:2, 1:3, 1:4, 1:5), respectively, were observed for the prediction with the original COSMO-RS, while the predicted Henry's constants of CO2 in the DESs (1:1.5, 1:2, 1:3, 1:4, 1:5) at temperatures ranging of 293.15–333.15 K are more accurate than the predicted CO2 solubility with the original COSMO-RS. To improve the performance of COSMO-RS, 502 data points of CO2 solubility in the DESs (1:2, 1:3, 1:4, 1:5) were used for correcting COSMO-RS with a temperature-pressure dependent parameter, and the CO2 solubility in the DES (1:6) was predicted to further verify the performance of the corrected model. The results indicate that the corrected COSMO-RS can significantly improve the model performance with the ARDs decreasing down to 6.5, 4.8, 6.5, and 4.5% for the DESs (1:2, 1:3, 1:4, and 1:5), respectively, and the corrected COSMO-RS with the universal parameters can be used to predict the CO2 solubility in DESs with different mole ratios, for example, for the DES (1:6), the corrected COSMO-RS significantly improves the prediction with an ARD of 10.3% that is much lower than 78.2% provided by the original COSMO-RS. Additionally, the result from COSMO-RS shows that the σ-profiles can reflect the strength of molecular interactions between an HBA (or HBD) and CO2, determining the CO2 solubility, and the dominant interactions for CO2 capture in DESs are the H-bond and Van der Waals force, followed by the misfit based on the analysis of the predicted excess enthalpies.
Keywords: deep eutectic solvents, CO2 capture, COSMO-RS, CO2 solubility, Henry's constant
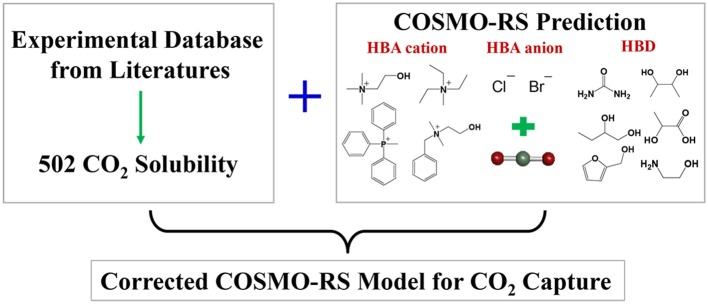
Graphical Abstract.
Corrected COSMO-RS model for screening CO2 solubility in DES.
Introduction
With the rapid development of industry, the demand for energy is growing. Fossil fuels currently account for the majority of energy supply (Rahmanifard and Plaksina, 2019). The use of fossil fuels poses a range of environmental problems. For example, the use of fossil fuels emits a large amount of carbon dioxide (CO2) (Hanif et al., 2019; Hosseini et al., 2019). This, in turn, leads to the serious greenhouse-gas effect. It was reported that the global CO2 emissions reached an all-time high of 33.143 billion tons in 2018 by the International Energy Agency (IEA) (Qu, 2018). This calls for CO2 capture.
There are several technologies for CO2 capture, for example, physical, or chemical solvent scrubbing (Abdeen et al., 2016) and pressure swing adsorption (Riboldi and Bolland, 2016). Because of the complexity of the gas components, most technologies still suffer from high energy demand, high cost, and serious secondary pollutions. Developing new capture technologies, including new solvents and novel processes, is the key point to CO2 capture.
Recently, ionic liquids (ILs) have been proposed as potential candidates for CO2 capture due to their unique properties. However, the conventional ILs are expensive mainly due to the complex synthesis process. The newly emerged DESs possess analogous properties to ILs and share many common properties with ILs, whereas DESs have additional merits of low cost, biodegradability, low toxicity, easy preparation, and no purification requirement (Sarmad et al., 2017a). The most fascinating property of DESs is the structural diversity, and it can be prepared by mixing a hydrogen bond donor (HBD) with a hydrogen bond acceptor (HBA) in appropriate mole ratios (Hayyan et al., 2013).
To develop DESs for CO2 capture, the CO2 absorption capacity (i.e., CO2 solubility) in DESs is one of the important properties. It is reported that the CO2 solubility in DESs depends on pressure, temperature, and the mole ratio of HBD to HBA, and it increases with increasing pressure and decreasing temperature (Sarmad et al., 2017a). Based on the studies of Kamps et al. (2003) and Aki et al. (2004), it was found that the CO2 solubilities in DESs were comparable with the imidazolium-based ILs. Leron and Li measured the CO2 solubilities in choline chloride (ChCl)-glycerol (GLY) 1:2 at 313.15 K and 0–6 MPa (Leron and Li, 2013). The result indicated that the measured CO2 solubilities (0.1103–3.0718 mol/kg) in this DES are greater than those in the 1-ethyl-3-methylimidazolium-based ILs, such as 1-ethyl-3-methylimidazolium tetrafluoroborate, 1-ethyl-3-methylimidazolium dicyanamide, and 1-ethyl-3-methylimidazolium ethyl sulfate. In the work by Sarmad et al., 35 DESs with 209 data points for CO2 solubility at 298.15 K and below 2 MPa were reported (Sarmad et al., 2017b). Among the synthesized DESs, 15 samples exhibit higher CO2 solubilities than the conventional ILs, such as 1-octyl-3-methylimidazolium tetrafluoroborate, 1-octyl-3-methylimidazolium hexafluorophosphate, and 1-ethyl-3-methylimidazolium ethylsulfate. Sarmad et al. reviewed the CO2 solubilities in 45 DESs in wide ranges of mole ratio (HBA:HBD), temperature, and pressure (Sarmad et al., 2017a). Based on this review, top three DESs with respect to CO2 solubilities were acquired, i.e., 3.6929, 3.5592, and 3.1265 mol/kg for ChCl-GLY (1:2, 303.15 K, 5.863 MPa), ChCl-Urea (1:2, 303.15 K, 5.654 MPa), and ChCl-ethylene glycerol (EG) (1:2, 303.15 K, 0.5774 MPa), respectively.
Numerous possible DESs can be synthesized. It is nevertheless a challenge to identify and suggest the best DESs for capturing CO2 based on the available experimental measurements only. A rapid and priori screening method to predict the CO2 absorption capacity in DESs is needed. COSMO-RS (Conductor-like Screening Model for Real Solvents) is recommended for predicting some thermodynamic properties (Gonzalez-Miquel et al., 2011; Liu Y.-R., et al., 2016), such as activity coefficients, solubilities, and Henry's constants, and it can also be used for calculating the properties of mixtures at various temperatures and pressures, rendering it an effective tool to predict and develop task-specific DESs for a specific application. Previous work has demonstrated that Henry's constants can be used as one of the criteria to screen ILs for CO2 capture (Manan et al., 2009; Palomar et al., 2011), and the Henry's constants of CO2 in ILs have been successfully estimated with COSMO-RS (Gonzalez-Miquel et al., 2011). However, using COSMO-RS to predict the CO2 solubility or the Henry's constant of CO2 in DESs is still scarce. To the best of our knowledge, only Kamgar et al. (2017b) predicted CO2 solubility in the DES of ChCl-Urea (1:2) with COSMO-RS, demonstrating a reliable prediction only at low pressures and high temperatures, where the gas could be assumed to be an ideal gas. No report is available to predict the Henry's constants of CO2 in DESs and compare with the experimental results for verification.
The aim of this work was to predict CO2 solubilities, the Henry's constants of CO2, and the interactions for CO2 capture in DESs with COSMO-RS. A comprehensive survey of the published experimental results of CO2 solubility and Henry's constant of CO2 was firstly carried out. COSMO-RS was used to predict these two properties, and the predictions were compared with the experimental results. COSMO-RS was further developed with a correction based on the experimental CO2 solubility to improve the model performance. The σ-profiles predicted by COSMO-RS were used to reflect the strength of molecular interactions between an HBA (or HBD) and CO2, and the calculated excess enthalpy was applied to acquire the dominant interactions for CO2 capture in DESs.
Computational Detail
COSMO-RS Computation Details
COSMO-RS calculations were performed using the software COSMOtherm (version C3.0, release 14.01, applied with parameterization BP_TZVP_C30_1401, COSMOlogic, Leverkusen, Germany) (Larriba et al., 2017). Following the standard method, first, the quantum chemical Gaussian09 package was used to optimize the structure of the studied compounds at the B3LYP/6-31++G (d, p) level. Second, the COSMOfiles of the optimized structures were opened by Gaussian03, and the COSMO continuum solution models were obtained using the BVP86/TZVP/DGA1 level theory. Third, CO2 solubility, the Henry's constant of CO2, σ-profiles, and excess enthalpy were determined with COSMO-RS (Liu Y.-R., et al., 2016). In computation, the temperature and pressure were set to be the same values as the experimental conditions.
In COSMO-RS, all DESs were implemented in COSMOtherm software following the electroneutral approach, where each DES was treated as three different compounds in a stoichiometric mixture (Larriba et al., 2017). For HBA, the mole fractions of the cation and anion were treated as equal, i.e., ncation = nanion = nHBA. The solubility and Henry's constant of CO2 were calculated based on the equations described by Klamt et al. (2001) and Loschen and Klamt (2014). The total and contribution of the excess enthalpies were calculated with the method reported by Casas et al. (2012).
In COSMO-RS, the solubility (X) (i.e., the mole fraction) of CO2 in DESs was obtained with the following equation (Equation 1) (Li et al., 2014).
| (1) |
where nDES is the mole quantity of absorbent, and it was obtained according to the mass weight and the mole mass of DESs.
To evaluate the model performance, the discrepancies between the results (i.e., CO2 solubility X, Henry's constant H) estimated with COSMO-RS and the corresponding experimental data points were quantified with the absolute relative error (ARD) as defined by Equation 2 (Kamgar et al., 2017a).
| (2) |
where NP is the total number of data points. YCOSMO−RS (i.e., or HCOSMO−RS) is the result predicated with COSMO-RS (original or corrected) at a given temperature and pressure, and YExp. is the corresponding experimental result (i.e., or HExp.).
DESs-Database and COSMOfiles
A literature survey was conducted, and the DESs with CO2 solubility and the Henry's constant of CO2 in DESs were summarized and used as databases for verifying and further developing COSMO-RS. According to the survey, for CO2 solubility, the DESs with HBA:HBD at the mole ratios of 1:2, 1:3, 1:4, and 1:5 have more experimental results compared to those with other mole ratios, and they were selected for developing COSMO-RS model in this work, while the limited experimental results at the mole ratio of 1:6 were used for verification of the developed COSMO-RS. For Henry's constants, the DESs (1:1.5, 1:2, 1:3, 1:4, 1:5) were chosen due to that sufficient experimental results are available for these DESs in literatures. The DESs databases together with the experimental measurement conditions are summarized in Tables 1, 2, respectively, and the detailed CO2 solubilities and the Henry's constants under different conditions are provided in Tables S1–S6.
Table 1.
DESs database studied in this work for CO2 solubility.
| DES | HBA | HBD | Mole ratio (HBA:HBD) | Temperature range (K) | Press range (KPa) | Numbers of data | References |
|---|---|---|---|---|---|---|---|
| ChCl-Phenol | Choline chloride | Phenol | 1:2 | 293.15–323.15 | 99–520.2 | 19 | Li et al., 2014 |
| BTEACl-AC | Benzyltriethylammonium chloride | Acetic acid | 1:2 | 298.15 | 325–2054 | 6 | Sarmad et al., 2017b |
| BTMACl-AC | Benzyltrimethylammonium chloride | Acetic acid | 1:2 | 298.15 | 219–2037 | 7 | |
| BTMACl-GLY | Benzyltrimethylammonium chloride | Glycerol | 1:2 | 298.15 | 394–2026 | 6 | |
| TBACl-AC | Tetrabutylammonium chloride | Acetic acid | 1:2 | 298.15 | 348–2002 | 6 | |
| TBABr-AC | Tetrabutylammonium bromide | Acetic acid | 1:2 | 298.15 | 388–2011 | 5 | |
| TEACl-AC | Tetraethylammonium chloride | Acetic acid | 1:2 | 298.15 | 281–2018 | 6 | |
| TEMACl-AC | Triethylmethylammonium chloride | Acetic acid | 1:2 | 298.15 | 198–1837 | 7 | |
| TEMACl-EG | Triethylmethylammonium chloride | Ethylene glycol | 1:2 | 298.15 | 138–1345 | 6 | |
| TEMACl-LA | Triethylmethylammonium chloride | Lactic acid | 1:2 | 298.15 | 143–1863 | 6 | |
| TEMACl-LEV | Triethylmethylammonium chloride | Levulinic acid | 1:2 | 298.15 | 136–1617 | 5 | |
| TEMACl-GLY | Triethylmethylammonium chloride | Glycerol | 1:2 | 298.15 | 150-1648 | 5 | |
| TBACl-LA | Tetrabutylammonium chloride | Lactic acid | 1:2 | 308, 318 | 93–1992, 93–1992 | 28 | Zubeir et al., 2014 |
| TEACl-LA | Tetraethylammonium chloride | Lactic acid | 1:2 | 308, 318 | 97–1993, 94–1992 | 40 | |
| TMACl-LA | Tetramethylammonium chloride | Lactic acid | 1:2 | 308, 318 | 98–1992, 95–1993 | 40 | |
| ChCl-DEG | Choline chloride | Diethylene glycol | 1:3 | 293.15–323.15 | 112.8–524 | 20 | Li et al., 2014 |
| ChCl-FA | Choline chloride | Furfuryl alcohol | 1:3 | 303.15–333.15 | 80.9–586.4 | 24 | Lu et al., 2015 |
| ChCl-LEV | Choline chloride | Levulinic acid | 1:3 | 303.15–333.15 | 69.8–579.8 | 24 | |
| ChCl-Phenol | Choline chloride | Phenol | 1:3 | 293.15–323.15 | 104.4–514.4 | 20 | |
| ChCl-TEG | Choline chloride | Triethylene glycol | 1:3 | 293.15–323.15 | 109.3–516 | 20 | Li et al., 2014 |
| TEACl-AC | Tetraethylammonium chloride | Acetic acid | 1:3 | 298.15 | 397–2016 | 6 | Sarmad et al., 2017b |
| TEACl-OCT | Tetraethylammonium chloride | Octanoic acid | 1:3 | 298.15 | 353–2018 | 6 | |
| MTPPBr-LEV | Methyltriphenyl phosphonium bromide | Levulinic acid | 1:3 | 298.15 | 301–2068 | 7 | |
| ChCl-DEG | Choline chloride | Diethylene glycol | 1:4 | 293.15–323.15 | 110.4–526.9 | 20 | Li et al., 2014 |
| ChCl-FA | Choline chloride | Furfuryl alcohol | 1:4 | 303.15–333.15 | 65.2–585.4 | 24 | Lu et al., 2015 |
| ChCl-LEV | Choline chloride | Levulinic acid | 1:4 | 303.15–333.15 | 60–587.4 | 24 | |
| ChCl-Phenol | Choline chloride | Phenol | 1:4 | 293.15–323.15 | 108.2–529.1 | 20 | Li et al., 2014 |
| ChCl-TEG | Choline chloride | Triethylene glycol | 1:4 | 293.15–323.15 | 109.3–520.3 | 20 | |
| TMACl-AC | Tetramethylammonium chloride | Acetic acid | 1:4 | 298.15 | 294–1741 | 6 | Sarmad et al., 2017b |
| TPACl-EA | Tetrapropylammonium chloride | Ethanolamine | 1:4 | 298.15 | 481–2009 | 6 | |
| MTPPBr-AC | Methyltriphenyl phosphonium bromide | Acetic acid | 1:4 | 298.15 | 173–2014 | 8 | |
| MTPPBr-1,2-PRO | Methyltriphenyl phosphonium bromide | 1,2-Propanediol | 1:4 | 298.15 | 220–2026 | 7 | |
| ChCl-LEV | Choline chloride | Levulinic acid | 1:5 | 303.15–333.15 | 71.5–581 | 24 | Lu et al., 2015 |
| ChCl-FA | Choline chloride | Furfuryl alcohol | 1:5 | 303.15–333.15 | 70.9–577.2 | 24 | |
| TPACl-AC | Tetrapropylammonium chloride | Acetic acid | 1:6 | 298.15 | 350–2030 | 6 | Sarmad et al., 2017b |
Table 2.
DESs database studied in this work for Henry's constants of CO2.
| DES | HBA | HBD | Mole ratio (HBA:HBD) | Temperature range (K) | Points | References |
|---|---|---|---|---|---|---|
| ChCl-Urea | Choline chloride | Urea | 1:1.5 | 313.15–333.15 | 3 | Li et al., 2008 |
| ChCl-Urea | Choline chloride | Urea | 1:2 | 313.15–333.15 | 3 | |
| ChCl-Urea | Choline chloride | Urea | 1:2 | 308.2–328.2 | 3 | Xie et al., 2013 |
| ChCl-Phenol | Choline chloride | Phenol | 1:2 | 293.15–323.15 | 4 | Li et al., 2014 |
| TMACl-LA | Tetramethylammonium chloride | Lactic acid | 1:2 | 308–318 | 2 | Zubeir et al., 2014 |
| TEACl-LA | Tetraethylammonium chloride | Lactic acid | 1:2 | 308–318 | 2 | |
| TBACl-LA | Tetrabutylammonium chloride | Lactic acid | 1:2 | 308–318 | 2 | |
| TBACl-DecA | Tetrabutylammonium chloride | Decanoic acid | 1:2 | 298.15–323.15 | 3 | Zubeir et al., 2018 |
| N8881Br-DecA | Methyltrioctylammonium bromide | Decanoic acid | 1:2 | 298.15–323.15 | 3 | |
| N8881Cl-DecA | Methyltrioctylammonium bromide | Decanoic acid | 1:2 | 298.15–308.15 | 2 | |
| ChCl-EG | Choline chloride | Ethylene glycol | 1:2 | 303.15 | 1 | Haider et al., 2018 |
| TBABr-EG | Tetrabutyl ammonium bromide | Ethylene glycol | 1:2, 1:3, 1:4 | 303.15 | 1, 1, 1 | |
| TBABr-DEG | Tetrabutyl ammonium bromide | Diethylene glycol | 1:2, 1:3, 1:4 | 303.15 | 1, 1, 1 | |
| ChCl-1,2 PRO | Choline chloride | 1,2-propanediol | 1:3, 1:4 | 293.15–323.15 | 4, 4 | Chen et al., 2014 |
| ChCl-2,3 BUT | Choline chloride | 2,3-butanediol | 1:3, 1:4 | 293.15–323.15 | 4, 4 | |
| ChCl-1,4 BUT | Choline chloride | 1,4-butanediol | 1:3, 1:4 | 293.15–323.15 | 4, 4 | |
| ChCl-DEG | Choline chloride | Diethylene glycol | 1:3, 1:4 | 293.15–323.15 | 4, 4 | Li et al., 2014 |
| ChCl-FA | Choline chloride | Furfuryl alcohol | 1:3, 1:4 | 293.15–323.15 | 4, 4 | Lu et al., 2015 |
| ChCl-LEV | Choline chloride | Levulinic acid | 1:3, 1:4 | 293.15–323.15 | 4, 4 | |
| ChCl-Phenol | Choline chloride | Phenol | 1:3, 1:4 | 293.15–323.15 | 4, 4 | Li et al., 2014 |
| ChCl-TEG | Choline chloride | Triethylene glycol | 1:3, 1:4 | 293.15–323.15 | 4, 4 | |
| ChCl-GC | Choline chloride | Guaiacol | 1:3, 1:4, 1:5 | 293.15–323.15 | 4, 4, 4 | Liu X. B. et al., 2017 |
| ACCl-GC | Acetylcholine chloride | Guaiacol | 1:3, 1:4, 1:5 | 293.15–323.15 | 4, 4, 4 | |
| ATPPBr-DEG | Allyltriphenyl phosphonium bromide | Diethylene glycol | 1:4 | 303.15 | 1 | Ghaedi et al., 2017 |
| ATPPBr-TEG | Allyltriphenyl phosphonium bromide | Triethylene glycol | 1:4 | 303.15 | 1 | |
| ChCl-FA | Choline chloride | Furfuryl alcohol | 1:5 | 303.15–333.15 | 4 | Lu et al., 2015 |
| ChCl-LEV | Choline chloride | Levulinic acid | 1:5 | 303.15–333.15 | 4 |
To use COSMO-RS, the COSMOfiles for all the studied HBAs and HBDs are needed. In this work, those for the HBAs of ATPP+, AC+, BTEA+, BTMA+, and MTPP+, and for the HBDs of lactic acid (LA), ethylene glycol (EG), levulinic acid (LEV), furfuryl alcohol (FA), triethylene glycol (TEG), guaiacol (GC), decanoic acid (DecA), 1,4-butanediol (1,4-BUT), and 2,3-butanediol (2,3-BUT) were calculated based on the procedures described in the computation details. The optimized structures of HBAs and HBDs as well as the COSMOfiles from Gaussian are provided in Supplementary Information. The COSMOfiles for other HBAs and HBDs studied in this work as listed in Tables 1, 2 were directly taken from the COSMO-RS database.
Model Results and Discussion
CO2 Solubility With COSMO-RS
For conducting COSMO-RS prediction, 502 experimental data points of CO2 solubilities in four types of DESs (1:2, 1:3, 1:4, 1:5) under different conditions summarized from the published work were used as the input to predict the CO2 solubility. The model predictions were then compared with the experimental results. Together with the selected 502 experimental data points of CO2 solubilities, the predicted results and the corresponding ARDs are listed in Tables S1–S4.
Taking the results listed in Table S1 as examples, it can be observed that COSMO-RS is capable of predicting CO2 solubilities in DESs, but qualitatively. For example, the experimental ln XCO2 of TMACl-LA (1:2) is −5.1743 at 308 K, 194 kPa, and −5.2419 at 318 K, 194 kPa. The increase of temperature from 308 to 318 K leads to a decrease of CO2 solubility with a difference of (Δln XCO2 = −0.0676). The corresponding COSMO-RS predicted values of ln XCO2 are −2.9257 and −3.1451, respectively, indicating a temperature increase results in a decreased CO2 solubility, however, the difference is (Δln XCO2 = −0.2194) that are much lower than the experimental observation. For different kinds of DESs, the predicted CO2 solubility also provides the same trend with the experiment results, for example, the experimental ln XCO2 for TBACl-LA (1:2) is −4.3513 at 308 K, 194 kPa, which is greater than that of TMACl-LA (1:2) under the same condition. The prediction of COSMO-RS provides a value of ln XCO2 = −2.2662 for TBACl-LA (1:2) at 308 K, 194 kPa, which is also higher than that for TMACl-LA (1:2) (i.e., ln XCO2 = −2.9257). The results for other DESs listed in Tables S2–S4 show similar observations as those listed in Table S1. Hence, COSMO-RS can be used to screen DESs qualitatively, reducing the amount of unnecessary experimental measurements.
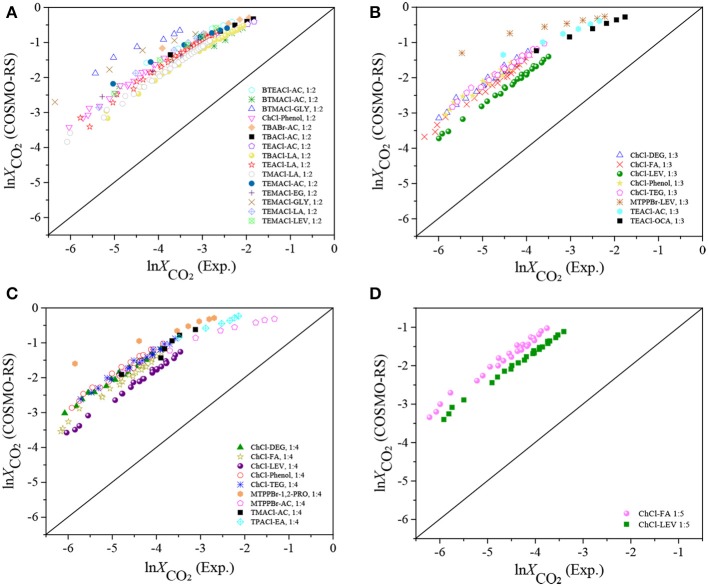
Further comparisons were performed based on ln XCO2 between the experimental and COSMO-RS results. As shown in Figure 1, systematic deviations can be observed, i.e., all the COSMO-RS predictions are higher than the experimental results. With increasing pressure and decreasing temperature, the discrepancies become larger, which is consistent with the observation by Kamgar et al. (2017b). This indicates that using the COSMO-RS with the parameters obtained from the conventional compound systems to predict the thermodynamic properties of DESs will lead to large deviations, which was also pointed out by others (Han et al., 2018). One of the reasons can be attributed to the formation of nanoscopic structures in DESs (Cerajewski et al., 2018), which is completely different from the solvation properties of molecular solutes in the conventional solvents at the microscopic scale.
Figure 1.
Experimental ln XCO2 vs. the ln XCO2 predicted with the original COSMO-RS. (A) HBA:HBD 1:2; (B) HBA:HBD 1:3; (C) HBA:HBD 1:4; (D) HBA:HBD 1:5.
Henry's Constant With COSMO-RS
The Henry's constants of CO2 in DESs (1:1.5, 1:2, 1:3, 1:4, 1:5) with 132 data points were predicated with COSMO-RS and compared with the experimental results (Figure 2). The specific values of the experimental and predicted Henry's constants are listed in Table S6, and the ARDs are summarized in Table 3. From Table S6, it can be found that the predicted Henry's constants are in agreement with the experimental data, and they increase with increasing temperature. As shown in Figure 2, most of the predicted Henry's constants are lower than the experimental values, which is consistent with the observation for the CO2 solubility because the Henry's constant is inversely proportional to the CO2 solubility (Liu X. Y., et al., 2016). A 13.7–36.3% deviation can be observed as listed in Table 3, indicating that the predicated Henry's constants are more accurate than the predicted CO2 solubility with the original COSMO-RS (Table 4).
Figure 2.
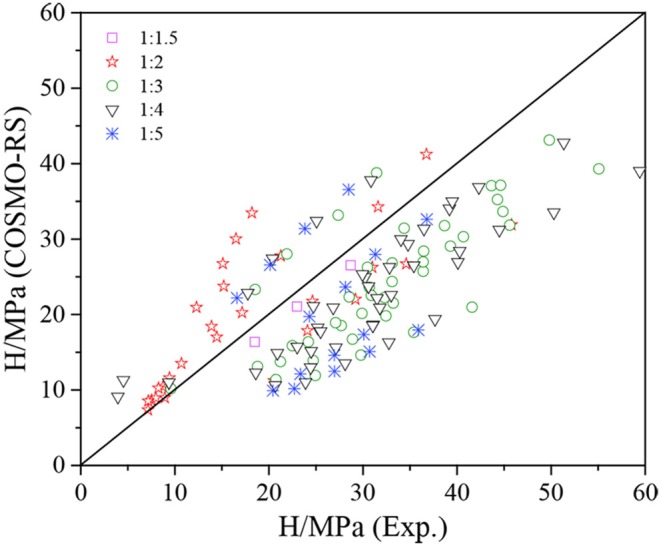
Experimental vs. predicted Henry's constants with the original COSMO-RS.
Table 3.
ARDs for the Henry's constants determined experimentally with respect to those predicted with the original COSMO-RS.
| HBA:HBD | 1:1.5 | 1:2 | 1:3 | 1:4 | 1:5 |
| ARD | 13.7% | 29.9% | 28.6% | 34.4% | 36.3% |
Table 4.
Corrected COSMO-RS for predicting ln XCO2 in the DESs of four mole ratios.
| Mole ratio | Correction, T in K, P in KPa | ARDs compared to experimental ln XCO2 | |||
|---|---|---|---|---|---|
| Before correction | After correction | ||||
| 1:2 |
|
62.2% | 6.5% | ||
| 1:3 |
|
59.6% | 4.8% | ||
| 1:4 |
|
63.0% | 6.5% | ||
| 1:5 |
|
59.1% | 4.5% | ||
COSMO-RS Correction for CO2 Solubility
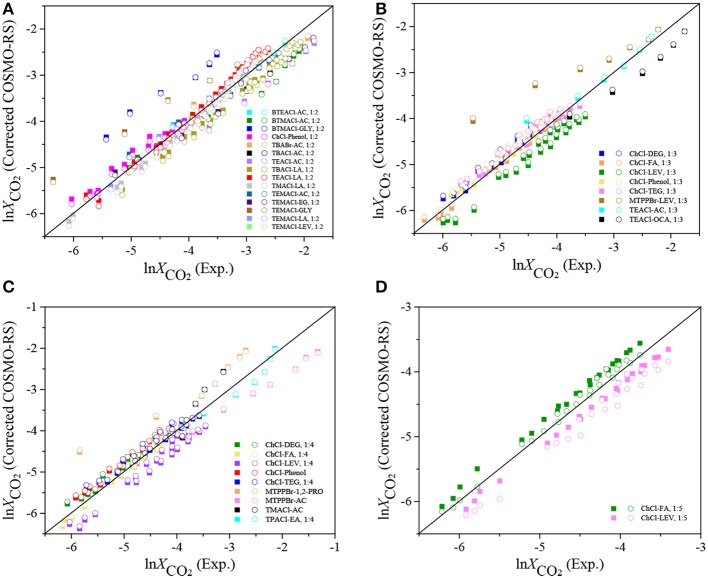
Although, from one side, it is unfortunate to observe a large deviation between the experimental CO2 solubility and the COSMO-RS prediction, from the other side, it illustrates that it is possible to develop a systematic correction of COSMO-RS for improving the model performance of CO2 solubility in DESs. Liu et al. reported a corrected COSMO-RS for predicting the activity coefficient of CO2 in ILs and acquired a good agreement between the experimental and predicted results after correction (Liu et al., 2018). Following this idea, in this work, a temperature-pressure-dependent correction was firstly proposed as summarized in Equations 3–6 (Table 4) for the DESs with the same mole ratio. As displayed in Table 4, the corrected COSMO-RS includes three parameters, i.e., A (K−1), B (KPa−1), and C, and these parameters were adjusted based on the experimental CO2 solubility at different temperatures and pressures for each group of DESs, i.e., the DESs with the same mole ratio. The predicted results with the corrected COSMO-RS are given in Tables S1–S4. The performance of the corrected COSMO-RS is further illustrated in Figure 3, and the deviations in ARDs between the experimental and modeling results are reported in Table 4. It can be found that, with the corrected COSMO-RS, i.e., the COSMO-RS with a temperature-pressure-dependent parameter, the predicted logarithmic CO2 solubilities (square symbol in Figure 3) are in agreement with the experimental results, with much smaller ARDs of 6.5, 4.8, 6.5, and 4.5% for these four groups of DESs compared to the ARDs with the original COSMO-RS. According to the results listed in Tables S1–S4, the ARD decreases with increasing temperature, which agrees with the observation by Kamgar et al. (2017b). As shown in Table 4, the adjustable parameters A (K), B (KPa−1), and C in four corrected Equations 3–6 are almost linearized with the mole ratios. To further improve the model prediction capacity, the adjustable parameters A, B, and C were set to be mole-ratio-dependent which can be described as follows:
| (7) |
| (8) |
| (9) |
where w is the mole ratio, being 2, 3, 4, 5, etc.
Figure 3.
Experimental ln XCO2 vs. the ln XCO2 calculated with the corrected COSMO-RS models using Equations 3–6 (square symbol) and Equation 10 (circular symbol). (A) HBA:HBD 1:2; (B) HBA:HBD 1:3; (C) HBA:HBD 1:4; (D) HBA:HBD 1:5.
To obtain k1-k6, in this work, the experimental results of CO2 solubilities in the DESs with four mole-ratios of 1:2, 1:3, 1:4, and 1:5 were used, and, in total, 502 experimental data points were included in fitting with a linear least square method. The fitted parameters of k1-k6 together with the corresponding ARDs are listed in Table 5, and the fitted CO2 solubilities are given in Tables S1–S4.
Table 5.
Adjustable parameters of Equation 10 and the corresponding ARDs.
| Adjustable parameters | ARDs compared to experimental ln XCO2 | ||||||||
|---|---|---|---|---|---|---|---|---|---|
| k1/(K) | k2/(K) | k3/(KPa−1) | k4/(KPa−1) | k5 | k6 | 1:2 | 1:3 | 1:4 | 1:5 |
| 48.5344 | −1094.7706 | 9.4696 × 10⁻⁵ | 2.1975 × 10⁻⁴ | −0.3249 | 1.3164 | 6.8% | 5.2% | 6.6% | 4.7% |
To illustrate the fitting performance with this set of universal parameters (k1-k6), the CO2 solubilities obtained with the corrected COSMO-RS (circular symbol) were compared with the experimental results as well as those with the corrected COSMO-RS but using the individual parameters at each mole-ratio. As shown in Figure 4, the predicted with the corrected COSMO-RS using the universal parameters (i.e., Equation 10) agrees with the experimental data, and only a slight deviation can be observed between these two corrected COSMO-RS models, i.e., with Equation 10 and Equations 3–6, respectively. Additionally, from Table 5, it can be found that the ARDs with Equation 10 are 6.8, 5.2, 6.6, and 4.7% for the DESs at mole ratios of 1:2, 1:3, 1:4, and 1:5, respectively, which are almost the same as the ARDs calculated individually with Equations 3–6 (Table 4). All these indicate that it is reasonable to use the mole-ratio-dependent parameters.
Figure 4.
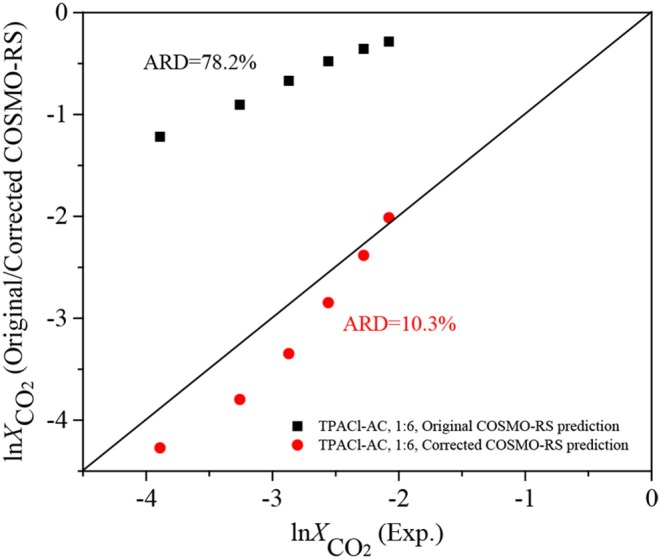
Experimental ln XCO2 vs. the ln XCO2 predicted with the original and corrected COSMO-RS (Equation 10) at the mole ratio of 1:6.
| (10) |
Further Verification of the Corrected COSMO-RS
COSMO-RS with the universal parameters k1–k6 can be used to predict CO2 solubilities in the DESs with any mole ratios according to Equation 10. In order to further investigate the model prediction capacity, it was used to predict CO2 solubilities in the DESs at the mole ratio of 1:6. This type of DES was excluded in parameter fitting for correcting COSMO-RS due to the limited number of available experimental data points. The comparison of the prediction with the experimental data as well as those predicted with the original COSMO-RS is displayed in Table S5 and Figure 4. From Figure 4, it can be seen that the ARD between and is 78.2%, while it is only 10.3% between and , indicating that the corrected COSMO-RS is applicable for different kinds of DESs.
In summary, COSMO-RS is a predictive model, but the performance is not always satisfactory for the DESs with CO2. The model performance of CO2 solubility in DESs can be improved significantly with the corrected COSMO-RS.
Further Investigation With COSMO-RS and Discussion
σ-Profiles Prediction
The molecular interactions between two compounds can be linked to their σ-profiles, the wider the complementary of their σ-profiles (i.e., in the same region, the σ-profile for one compound increases, while that for the other compound decreases), the stronger the molecular interactions between these two compounds. In this work, in order to study the effects of HBAs and HBDs on the interactions with CO2, the HBAs of TMACl, TBACl, TBABr, and BTMACl as well as the HBDs of AC, GLY, and LA were selected to predict the σ-profiles. The predicted results are listed in Table S7 and illustrated in Figure 5. Following the previous work, the σ-profiles can be divided into three regions: H-bond donor region (σ < −0.0082 e/Å2), non-polar region (−0.0082 < σ < +0.0082 e/Å2), and H-bond acceptor region (σ > +0.0082 e/Å2) (Liu Y. R. et al., 2017). In the H-bond acceptor region, the σ-profiles of HBAs for TMACl and TBACl are almost the same. However, the σ-profile of TBACl has a wider region complemented with CO2 than that for TBACl in both H-bond donor and non-polar regions, indicating that TBACl has a strong interaction with CO2 compared to TMACl. Meanwhile, the location of the σ-profile peak in the H-bond acceptor region also reflects the interaction strength with CO2. TBACl and TBABr have the same σ-profile curves in the H-bond donor and non-polar regions, while in the H-bond acceptor region, the peak of TBACl (0.019 e/Å2) is located to the right of TBABr (0.017 e/Å2), evidencing that TBACl has a stronger interaction with CO2 than TBABr. The σ-profile prediction shows that both the alkyl chain length of cations and the different types of anions of HBAs can affect the CO2 solubility, agreeing with the experimental results of XCO2 (TBACl-LA 1:2) > XCO2 (TMACl-LA 1:2) (Zubeir et al., 2014) and XCO2 (TBACl-AC 1:2) > XCO2 (TBABr-AC 1:2) (Sarmad et al., 2017b) at the same temperature and pressure. Additionally, as shown in Figure 5, it can be seen that AC is more complementary with CO2 than GLY, and the σ-profile curve of AC is lower than that of GLY. This implies that AC as the HDB in DES has a strong interaction with CO2 with respect to GLY, being consistent with the experimental results of XCO2 (BTMACl-AC 1:2) > XCO2 (BTMACl-GLY 1:2) at the same temperature and pressure (Sarmad et al., 2017b). Therefore, the σ-profile can be used to reflect the interaction strength of a DES with CO2.
Figure 5.
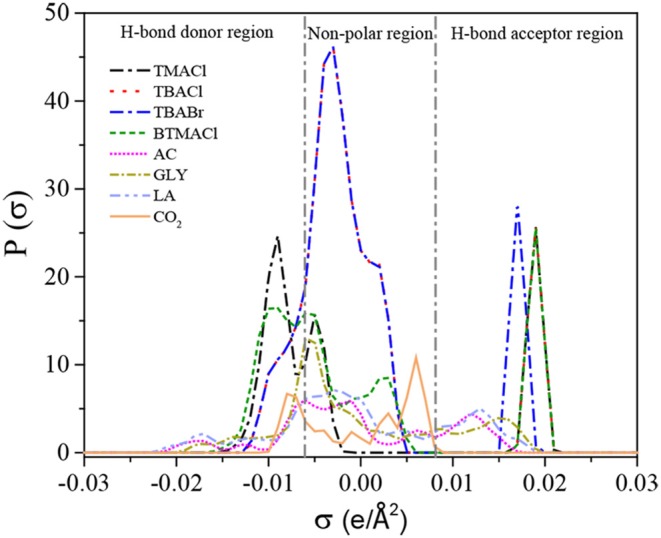
σ-profiles of HBAs, HBDs, and CO2.
Excess Enthalpy Prediction
The total excess enthalpy of six kinds of DESs at infinitely dilute CO2 concentrations predicted by COSMO-RS was illustrated in Figure 6. These DESs can be divided into three types: (1) TMACl-LA 1:2 and TBACl-LA 1:2 have the same HBD and molar ratio but different HBA; (2) ChCl-DEG 1:3 and ChCl-TEG 1:3 have the same HBA and molar ratio but different HBD; (3) ChCl-FA 1:3 and ChCl-FA 1:5 have the same HBA and HBD but different molar ratios. The higher the absolute values of excess enthalpy, the stronger the interaction between DES and CO2, i.e., the higher the capacity for CO2 capture. As shown in Figure 6, the absolute excess enthalpy of TBACl-LA 1:2+CO2 is higher than that for TMACl-LA 1:2+CO2, indicating that TBACl-LA 1:2 has a higher capacity for CO2 capture. The comparison of ChCl-DEG 1:3+CO2 and ChCl-TEG 1:3+CO2 shows that ChCl-TEG 1:3+CO2 has a high absolute excess enthalpy compared to ChCl-DEG 1:3+CO2 system, being in agreement with the experimental results obtained by Sarmad et al. (2017b) and Ghaedi et al. (2017), i.e., increasing the alkyl chain length in HBA and HBD results in an increased CO2 solubility. Moreover, by increasing the molar ratio of HBD in DES, the absolute excess enthalpy of ChCl-FA 1:5+CO2 is increased compared to ChCl-FA 1:3+CO2 system, which agrees with the experimental results (Lu et al., 2015). Therefore, predicting excess enthalpy may be an efficient option for designing the potential DES for CO2 capture.
Figure 6.
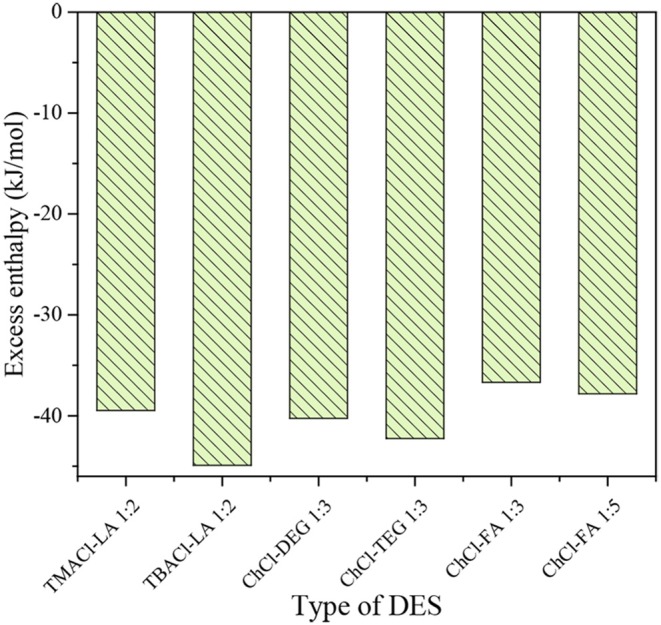
Excess enthalpy of DESs+CO2 system.
Figure 7 displays the contribution of each interaction [H-bond (HB), misfit (MF), and Van der Waals force (VdW)] to the total excess enthalpy of DESs+CO2 systems. It is observable in Figure 7 that HB and VdW are consistently the dominant interactions for the DES+CO2 systems, followed by MF. Shukla et al. reported that the CO2 solubility in DES depends on the HB interactions between HBA and HBD (Shukla and Mikkola, 2018). Cao et al. indicated that the formation of HB between HBA and HBD enhanced the CO2 solubility in DESs (Cao et al., 2015). In addition, Atilhan et al. investigated the interactions between DES and SO2 by the quantum chemistry, confirming a dominant VdW interaction between DES and SO2 (Atilhan et al., 2019). These findings support our results.
Figure 7.
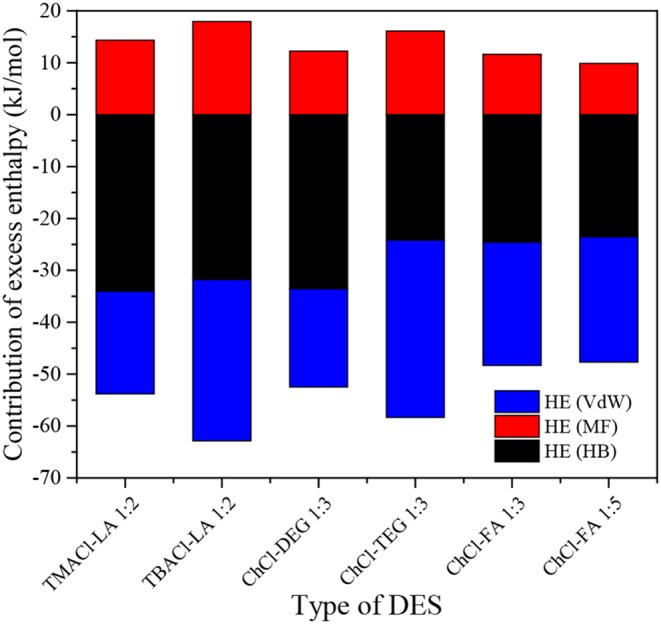
Contribution to the excess enthalpy of DESs+CO2 system.
Conclusion
This work established a database containing 502 experimental data points for CO2 solubility and 132 for the Henry's constant of CO2 in DESs. This database was used for further verification and development of COSMO-RS.
The logarithmic CO2 solubility predicted with the original COSMO-RS shows ARDs of 62.2, 59.6, 63.0, and 59.1% for the DESs with the HBD:HBA at 1:2, 1:3, 1:4, and 1:5, respectively. The Henry's constants of CO2 in the DESs (1:1.5, 1:2, 1:3, 1:4, 1:5) predicted with the original COSMO-RS with ARDs of 13.7–36.3% are more accurate compared to the predicted CO2 solubilities. To improve the performance, COSMO-RS was corrected based on 502 data points of CO2 solubility in the DESs (1:2, 1:3, 1:4, 1:5). It shows that the adjustable parameters in the corrected COSMO-RS can be universal, the corrected COSMO-RS with the universal parameters can be used to reliably predict the CO2 solubility in DESs, and the ARDs for the logarithmic CO2 solubility in the DESs (1:2, 1:3, 1:4, 1:5) are of 6.8, 5.2, 6.6 and 4.7%, respectively. The corrected COSMO-RS with the universal parameters was further used to predict CO2 solubility in the DESs (1:6), showing that a much lower ARD (10.3%) compared to that with the original COSMO-RS (ARD, 78.2%). Additional, the σ-profiles can reflect the strength of molecular interactions between an HBA (or HBD) and CO2, and the dominant interactions for CO2 capture in DESs are the H-bond and Van der Waals force, followed by the misfit, according to the results of excess enthalpies.
This work provides a reliable tool for DESs screening and the corrected COSMO-RS can be used to quantitatively predict CO2 solubilities in DESs.
Data Availability Statement
All datasets generated for this study are included in the article/Supplementary Material.
Author Contributions
All authors listed have made a substantial, direct and intellectual contribution to the work, and approved it for publication.
Conflict of Interest
The authors declare that the research was conducted in the absence of any commercial or financial relationships that could be construed as a potential conflict of interest.
Footnotes
Funding. This work was financially supported by the National Key R&D Program of China (No. 2018YFB0605802), Carl Tryggers Stiftelse foundation, Swedish Energy Agency (P47500-1). HY and XJ thank for the financial support from the Joint Research Fund for Overseas Chinese Scholars and Scholars in Hong Kong and Macao Young Scholars (No. 21729601). YN thanks for the financial support from the National Natural Science Foundation of China (No. 21776276) and Zhengzhou High Level Talent (No. 2018030045). SZe thanks for the financial support from the National Natural Science Foundation of China (No. 21890764).
Supplementary Material
The Supplementary Material for this article can be found online at: https://www.frontiersin.org/articles/10.3389/fchem.2020.00082/full#supplementary-material
References
- Abdeen F. R. H., Mel M., Jami M. S., Ihsan S. I., Ismail A. F. (2016). A review of chemical absorption of carbon dioxide for biogas upgrading. Chinese J. Chem. Eng. 24, 693–702. 10.1016/j.cjche.2016.05.006 [DOI] [Google Scholar]
- Aki S. N. V. K., Mellern B. R., Saurer E. M., Brennecke J. F. (2004). High-pressure phase behavior of carbon dioxide with imidazolium-based ionic liquids. J. Phys. Chem. B 108, 20355–20365. 10.1021/jp046895+ [DOI] [Google Scholar]
- Atilhan M., Altamash T., Aparicio S. (2019). Quantum chemistry insight into the interactions between deep eutectic solvents and SO2. Molecules 24:2963. 10.3390/molecules24162963 [DOI] [PMC free article] [PubMed] [Google Scholar]
- Cao L. D., Huang J. H., Zhang X. P., Zhang S. J., Gao J. B., Zeng S. J. (2015). Imidazole tailored deep eutectic solvents for CO2 capture enhanced by hydrogen bonds. Phys. Chem. Chem. Phys. 17, 27306–27316. 10.1039/c5cp04050g [DOI] [PubMed] [Google Scholar]
- Casas A., Palomar J., Alonso M. V., Oliet M., Omar S., Rodriguez F. (2012). Comparison of lignin and cellulose solubilities in ionic liquids by COSMO-RS analysis and experimental validation. Ind. Crop. Prod. 37, 155–163. 10.1016/j.indcrop.2011.11.032 [DOI] [Google Scholar]
- Cerajewski U., Trager J., Henkel S., Roos A. H., Brehm M., Hinderberger D. (2018). Nanoscopic structures and molecular interactions leading to a dystectic and two eutectic points in [EMIm][Cl]/urea mixtures. Phy. Chem. Chem. Phy. 20, 29591–29600. 10.1039/C8CP04912B [DOI] [PubMed] [Google Scholar]
- Chen Y. F., Ai N., Li G. H., Shan H. F., Cui Y. H., Deng D. S. (2014). Solubilities of carbon dioxide in eutectic mixtures of choline chloride and dihydric alcohols. J. Chem. Eng. Data 59, 1247–1253. 10.1021/je400884v [DOI] [Google Scholar]
- Ghaedi H., Ayoub M., Sufian S., Shariff A. M., Hailegiorgis S. M., Khan S. N. (2017). CO2 capture with the help of Phosphonium-based deep eutectic solvents. J. Mol. Liq. 243, 564–571. 10.1016/j.molliq.2017.08.046 [DOI] [Google Scholar]
- Gonzalez-Miquel M., Palomar J., Omar S., Rodriguez F. (2011). CO2/N2 selectivity prediction in supported ionic liquid membranes (SILMs) by COSMO-RS. Ind. Eng. Chem. Res. 50, 5739–5748. 10.1021/ie102450x [DOI] [Google Scholar]
- Haider M. B., Jha D., Sivagnanam B. M., Kumar R. (2018). Thermodynamic and kinetic studies of CO2 capture by glycol and amine-based deep eutectic solvents. J. Chem. Eng. Data 63, 2671–2680. 10.1021/acs.jced.8b00015 [DOI] [Google Scholar]
- Han J. L., Dai C. N., Yu G. Q., Lei Z. G. (2018). Parameterization of COSMO-RS model for ionic liquids. Green Energy Environ. 3, 247–265. 10.1016/j.gee.2018.01.001 [DOI] [Google Scholar]
- Hanif I., Aziz B., Chaudhry I. S. (2019). Carbon emissions across the spectrum of renewable and nonrenewable energy use in developing economies of Asia. Renew. Energ. 143, 586–595. 10.1016/j.renene.2019.05.032 [DOI] [Google Scholar]
- Hayyan M., Hashim M. A., Hayyan A., Al-Saadi M. A., AlNashef I. M., Mirghani M. E., et al. (2013). Are deep eutectic solvents benign or toxic? Chemosphere 90, 2193–2195. 10.1016/j.chemosphere.2012.11.004 [DOI] [PubMed] [Google Scholar]
- Hosseini E., Stevens G. W., Scholes C. A. (2019). Membrane gas-solvent contactors undergoing oscillating solvent flow for enhanced carbon dioxide capture. Sep. Purif. Technol. 227:115653 10.1016/j.seppur.2019.05.095 [DOI] [Google Scholar]
- Kamgar A., Bakhtyari A., Mohsenpour S., D'Agostino C., Moggridge G. D., Rahimpour M. R. (2017a). Mutual diffusion in concentrated liquid solutions: a new model based on cluster theory. J. Mol. Liq. 232, 516–521. 10.1016/j.molliq.2017.02.079 [DOI] [Google Scholar]
- Kamgar A., Mohsenpour S., Esmaeilzadeh F. (2017b). Solubility prediction of CO2, CH4, H2, CO and N2 in Choline Chloride/Urea as a eutectic solvent using NRTL and COSMO-RS models. J. Mol. Liq. 247, 70–74. 10.1016/j.molliq.2017.09.101 [DOI] [Google Scholar]
- Kamps Á. P.-S., Tuma D., Xia J. Z., Maurer G. (2003). Solubility of CO2 in the ionic liquid [bmim][PF6]. J. Chem. Eng. Data 48, 746–749. 10.1021/je034023f [DOI] [Google Scholar]
- Klamt A., Eckert F., Hornig M. (2001). COSMO-RS: a novel view to physiological solvation and partition questions. J. Comput. Aid. Mol. Des. 15, 355–365. 10.1023/a:1011111506388 [DOI] [PubMed] [Google Scholar]
- Larriba M., Ayuso M., Navarro P., Delgado-Mellado N., Gonzalez-Miquel M., García J., et al. (2017). Choline chloride-based deep eutectic solvents in the dearomatization of gasolines. ACS Sustain. Chem. Eng. 6, 1039–1047. 10.1021/acssuschemeng.7b03362 [DOI] [Google Scholar]
- Leron R. B., Li M.-H. (2013). Solubility of carbon dioxide in a eutectic mixture of choline chloride and glycerol at moderate pressures. J. Chem. Thermodyn. 57, 131–136. 10.1016/j.jct.2012.08.025 [DOI] [Google Scholar]
- Li G. H., Deng D. S., Chen Y. F., Shan H. F., Ai N. (2014). Solubilities and thermodynamic properties of CO2 in choline-chloride based deep eutectic solvents. J. Chem. Thermodyn. 75, 58–62. 10.1016/j.jct.2014.04.012 [DOI] [Google Scholar]
- Li X. Y., Hou M. H., Han B. X., Wang X. L., Zou L. Z. (2008). Solubility of CO2 in a choline chloride + urea eutectic mixture. J. Chem. Eng. Data 53, 548–550. 10.1021/je700638u [DOI] [Google Scholar]
- Liu X. B., Gao B., Jiang Y. T., Ai N., Deng D. S. (2017). Solubilities and thermodynamic properties of carbon dioxide in guaiacol-based deep eutectic solvents. J. Chem. Eng. Data 62, 1448–1455. 10.1021/acs.jced.6b01013 [DOI] [Google Scholar]
- Liu X. Y., Huang Y., Zhao Y. S., Gani R., Zhang X. P., Zhang S. J. (2016). Ionic liquid design and process simulation for decarbonization of shale gas. Ind. Eng. Chem. Res. 55, 5931–5944. 10.1021/acs.iecr.6b00029 [DOI] [Google Scholar]
- Liu X. Y., Zhou T., Zhang X. P., Zhang S. J., Liang X. D., Gani R., et al. (2018). Application of COSMO-RS and UNIFAC for ionic liquids based gas separation. Chem. Eng. Sci. 192, 816–828. 10.1016/j.ces.2018.08.002 [DOI] [Google Scholar]
- Liu Y.-R., Thomsen K., Nie Y., Zhang S.-J., Meyer A. S. (2016). Predictive screening of ionic liquids for dissolving cellulose and experimental verification. Green Chem. 18, 6246–6254. 10.1039/C6GC01827K [DOI] [Google Scholar]
- Liu Y. R., Meyer A. S., Nie Y., Zhang S. J., Zhao Y. S., Fosbøl P. L., et al. (2017). Freezing point determination of water–ionic liquid mixtures. J. Chem. Eng. Data 62, 2374–2383. 10.1021/acs.jced.7b00274 [DOI] [Google Scholar]
- Loschen C., Klamt A. (2014). Prediction of solubilities and partition coefficients in polymers using COSMO-RS. Ind. Eng. Chem. Res. 53, 11478–11487. 10.1021/ie501669z [DOI] [Google Scholar]
- Lu M. Z., Han G. Q., Jiang Y. T., Zhang X. D., Deng D. S., Ai N. (2015). Solubilities of carbon dioxide in the eutectic mixture of levulinicacid (or furfuryl alcohol) and choline chloride. J. Chem. Thermodyn. 88, 72–77. 10.1016/j.jct.2015.04.021 [DOI] [Google Scholar]
- Manan N. A., Hardare C., Jacquemin J., Rooney D. W., Youngs T. G. A. (2009). Evaluation of gas solubility prediction in ionic liquids using COSMOthermX. J. Chem. Eng. Data 54, 2005–2022. 10.1021/je800857x [DOI] [Google Scholar]
- Palomar J., Gonzalez-Miquel M., Polo A., Rodriguez F. (2011). Understanding the physical absorption of CO2 in ionic liquids using the COSMO-RS method. Ind. Eng. Chem. Res. 50, 3452–3463. 10.1021/ie101572m [DOI] [Google Scholar]
- Qu T. F. (2018). The International Energy Agency Report: Global CO2 Emissions Researched an All-Time High of 33.143 Billion Tons in 2018. Available online at: http://world.huanqiu.com/exclusive/2019-03/14612504.html?agt=15438 (accessed October 1, 2019).
- Rahmanifard H., Plaksina T. (2019). Hybrid compressed air energy storage, wind and geothermal energy systems in Alberta: Feasibility simulation and economic assessment. Renew. Energ. 143, 453–470. 10.1016/j.renene.2019.05.001 [DOI] [Google Scholar]
- Riboldi L., Bolland O. (2016). Pressure swing adsorption for coproduction of power and ultrapure H2 in an IGCC plant with CO2 capture. Int. J. Hydrog. Energ. 41, 10646–10660. 10.1016/j.ijhydene.2016.04.089 [DOI] [Google Scholar]
- Sarmad S., Mikkola J. P., Ji X. Y. (2017a). Carbon dioxide capture with ionic liquids and deep eutectic solvents: a new generation of sorbents. ChemSusChem 10, 324–352. 10.1002/cssc.201600987 [DOI] [PubMed] [Google Scholar]
- Sarmad S., Xie Y. J., Mikkola J.-P., Ji X. Y. (2017b). Screening of deep eutectic solvents (DESs) as green CO2 sorbents: from solubility to viscosity. New J. Chem. 41, 290–301. 10.1039/C6NJ03140D [DOI] [Google Scholar]
- Shukla S. K., Mikkola J.-P. (2018). Intermolecular interactions upon carbon dioxide capture in deep-eutectic solvents. Phys. Chem. Chem. Phys. 20, 24591–24601. 10.1039/c8cp03724h [DOI] [PubMed] [Google Scholar]
- Xie Y. J., Dong H. F., Zhang S. J., Lu X. H., Ji X. Y. (2013). Thermophysical properties and gas solubilities in choline chloride/urea for CO2 separation, in ICAE 2013 (Pretoria, South Africa: ). [Google Scholar]
- Zubeir L. F., Lacroix M. H. M., Kroon M. C. (2014). Low transition temperature mixtures as innovative and sustainable CO2 capture solvents. J. Phy. Chem. B 118, 14429–14441. 10.1021/jp5089004 [DOI] [PubMed] [Google Scholar]
- Zubeir L. F., van Osch D. J. G. P., Rocha M. A. A., Banat F., Kroon M. C. (2018). Carbon dioxide solubilities in decanoic acid-based hydrophobic deep eutectic solvents. J. Chem. Eng. Data 63, 913–919. 10.1021/acs.jced.7b00534 [DOI] [PMC free article] [PubMed] [Google Scholar]
Associated Data
This section collects any data citations, data availability statements, or supplementary materials included in this article.
Supplementary Materials
Data Availability Statement
All datasets generated for this study are included in the article/Supplementary Material.


