

Abstract
Labeling cells with iron oxide is a useful tool for MRI based cellular imaging. Here it is demonstrated that peripheral rat T cells can be labeled in whole blood, in vitro, with streptavidin-coated micron sized iron oxide particles (MPIOs), achieving iron concentrations as high as 60 pg iron per cell. This is 30 times the amount of labeling reported with USPIOs. Labeling was mediated by use of a biotinylated CD5 antibody, which is specific for peripheral T cells. Such labeling allowed the in vitro detection of single lymphocytes by MRI, using conditions well suited for in vivo animal work. Electron microscopic analysis demonstrated that particles remained largely extracellular after labeling, with some evidence of intracellular uptake. Cell viability and cytokine release studies did not detect significant differences between labeled and unlabeled cells. Therefore, MPIOs can be used for achieving high iron concentrations for cellular MRI of lymphocytes.
Keywords: MRI, iron oxide, T cells, contrast agents
Introduction
MRI is a useful tool for tracking lymphocyte migration in intact animals. Indeed, the earliest cellular MRI experiments involved MRI-based lymphocyte tracking (1). Currently, successful labeling of lymphocytes for MRI tracking makes use of citrate coated iron oxide nanoparticles (2), TAT peptide functionalized USPIOs (3) or SPIO-transfection agent complexes (4), achieving labeling ranges from ~ 0.5–2 pg iron per cell. Receptor mediated endocytosis of SPIOs has been demonstrated for lymphocytes (5) as well as other immune cells, such as dendritic cells (6).
Recently, cell labeling with micron sized iron oxide particles (MPIOs) has been demonstrated (7, 8). MPIOs efficiently pack 0.1 pg to 10 pg of iron in an individual particle, allowing single cells labeled with only one or a few particles to be detected by MRI (9). Labeling of adherent cells in culture is accomplished by simple co-incubation of MPIOs overnight with the cells, followed by washing to remove free particles. This has been successfully implemented on a variety of cell types (10–14). Yet, while this labeling scheme is robust for adherent cells, labeling of cells in suspension, such as lymphocytes, with MPIOs has proven difficult.
Recently it has been demonstrated that MRI can detect single cells if they are sufficiently labeled with iron oxide (14–16). Indeed, heavy labeling of cells with iron was required. Shapiro, et al (14) and Heyn, et al (16) each achieved iron labeling of over 50 pg iron/cell. Since current lymphocyte labeling protocols do not yet provide iron contents this high, it was hypothesized that cell labeling with MPIOs would achieve high levels of iron loading. The affinity of the MPIOs for the lymphocytes was established by using a biotin-streptavidin system, mediated by a T cell antibody. Herein is described an antibody-mediated procedure for efficiently labeling peripheral T cells with MPIOs with sufficient iron to allow detection of single lymphocytes, in vitro, by MRI.
Materials and Methods
Cell labeling
Peripheral blood was harvested from adult Sprague-Dawley rats. Fresh, whole blood (5 × 10⁶ T cells/ml) was incubated with various amounts of biotinylated rat anti-CD5 (Cedarlane Laboratories, Ontario, Canada), a pan T-cell antibody, for one hour, both on ice and at room temperature, and with and without shaking. Antibody concentrations were 0X, .04X, .40X, 2X, 8X, 40X and 200X saturation of all CD5 receptors on each T cell, assuming 30,000 receptors/cell (17) and 100 kDa molecular weight for the antibody. After one hour, green fluorescent, 1.63 micron streptavidin-coated MPIOs (1.0 pg iron/particle, Bangs Laboratories, Fishers, IN, USA) were added to the same whole blood and incubated for one hour, either on ice or room temperature, with or without shaking. MPIO concentrations were 0, 1, 5, and 50 beads/cell. Lymphocytes were harvested from the whole blood by standard Ficoll-Paque centrifugation. Briefly, whole blood samples were diluted 1:1 with PBS and layered over Ficoll-Paque (Amersham Biosciences, Uppsala, Sweden) at 1:1 ratio. Samples were centrifuged at 400 × g for 30 minutes at 18°C. The white blood cell layer that forms following centrifugation was transferred to an eppendorf tube and microcentrifuged at 3000 RPM for 5 minutes. The supernatant was removed and 1 ml ACK lysis buffer (Quality Biological, Inc., Gaithersburg, MD, USA) was added to lyse remnant red blood cells. After two washes with PBS, cells were filtered through 40 micron filters into tubes suitable for flow cytometry. This entire protocol was performed 4 different times for statistical averaging.
Functional analysis and imaging
Flow cytometry of freshly labeled cells was used to determine percent labeling. With one preparation, manual counting using both stereo and confocal fluorescence microscopy, was also used to determine percent labeling and particle number per cell. All raw labeling data were corrected to account for the percentage of total lymphocytes that are T cells, which for rats is ~ 72%. For one preparation, lymphocyte gates were sorted into two groups based on granularity. These cells were stained with DAPI to visualize nuclei and slides were prepared for confocal fluorescence microscopy. Viability was assessed by Trypan blue exclusion tests.
For electron microscopic analysis, freshly labeled cells were fixed with 4% glutaraldehyde in 0.1 N cacodylate buffer at pH7.4 at room temperature for 1 hr, pelleted and encapsulated with low melting point agarose. The pellet was treated with 1% OsO4 in cacodylate buffer for 1 hr and 0.25% uranyl acete in acetate buffer at pH 5.0 overnight, dehydrated in a series of ethanol and embedded in epoxy resins. Thin sections were counter stained with uranyl acetate and lead citrate. Images were recorded with a CCD digital camera system (XR-100 from AMT, Danvers, MA)
To assess extended cell viability following labeling, one sample was prepared at 2X saturation of CD5 receptors and 30 beads per cell. Initial percent cell labeling was determined by manually counting cells with a stereo fluorescent microscope. Initial percent viability of labeled cells only was measured using trypan blue exclusion tests. Cells were then cultured for two days under 5% CO2 in RPMI medium (GIBCO, Gaithersburg, MD, USA) supplemented with 10% fetal bovine serum, 100 U/ml penicillin and 100 μg/ml streptomycin. After two days, cell viability was again measured of labeled cells only with trypan blue exclusion tests followed by a manual count of percent lymphocytes with fluorescent beads. All manual counting measurements were performed in triplicate.
To measure the effect of cell labeling on cytokine production and release, interferon-gamma (Pierce Biotechnology, Rockford, IL) and interleukin-2 (BioSource International, Camarillo, CA) ELISA assays were performed. Interferon-gamma production during early phases of the T cell stimulation constitutes one of the primary effector mechanism by which activated T cells mediate resistance to pathogens. Interluekin-2 is produced by activated T cells in an autocrine fashion and facilitates late proliferation of those cells in response to activation. Thus, any impairment in T cell function due to attachment of antibody or MPIO would directly compromise these signaling functions and would preclude the use of this labeling scheme. Activation of T cells through the T cell antigen receptor complex (CD3) was accomplished by incubating labeled various numbers of T cells in 100 microliters of the same growth medium for two days in anti-CD3 coated plates. Both assays were performed at 2X saturation of CD5 receptors and 5 beads per cell. Assays were performed over a wide range of cell numbers to simulate the variety in cell density lymphocytes experience in vivo.
For MRI, unsorted labeled and unlabeled lymphocytes were suspended at low density in 1% agarose containing 1 mM Gd-DTPA and imaged using 3D gradient echo at 11.7 T (Bruker Biospec, Billerica, MA, USA) using the following parameters: 30 ms TR, 8 ms TE, 100 microns isotropic over a 1.28 cm3 field of view, 8 minutes acquisition time. The Gd-DTPA was added to reduce the T1 of the agarose to allow rapid imaging. The sizes (# of pixels) of 12 hypointense contrast spots were measured using ImageJ software (NIH, Bethesda, MD, USA).
Results
Figure 1 is a graph of the labeling efficiency achieved with both different antibody and MPIO concentration. The x-axis is plotted logarithmically to allow the visualization of the wide range of concentrations used in this study. The results from flow cytometry are plotted together with the results from manual counting. Cell labeling improved with increasing antibody concentration, reaching a plateau at 2X saturation, for each MPIO concentration. Results from flow cytometry showed that at 2X saturation, % T cell labeling was 16 ± 5%, 53 ± 7%, and 83 +/− 15% for 1, 5 and 50 MPIOs/cell added, respectively. Manual counting of % cell labeling was 18%, 42% and 76% for the same MPIO/cell ratios. There was a large difference between the flow cytometry and manual microscopy measurements at low antibody concentrations with 50 MPIOs/cell, with flow cytometry detecting highly increased cell labeling in these samples compared to manual counting. For example, for the samples with no antibody and 50 MPIOs/cell, flow cytometry detected a 29 +/− 7% cell labeling, while manual counting only detected 4%. It is likely that a large number of free particles existed in these samples, which caused a high background count in the flow cytometry. Neither the temperature of the labeling reaction nor shaking the samples during labeling had any statistically significant effect on labeling efficiency. Viability as assessed by trypan blue exclusion test was >95%, even for the highest labeled cell populations.
1).
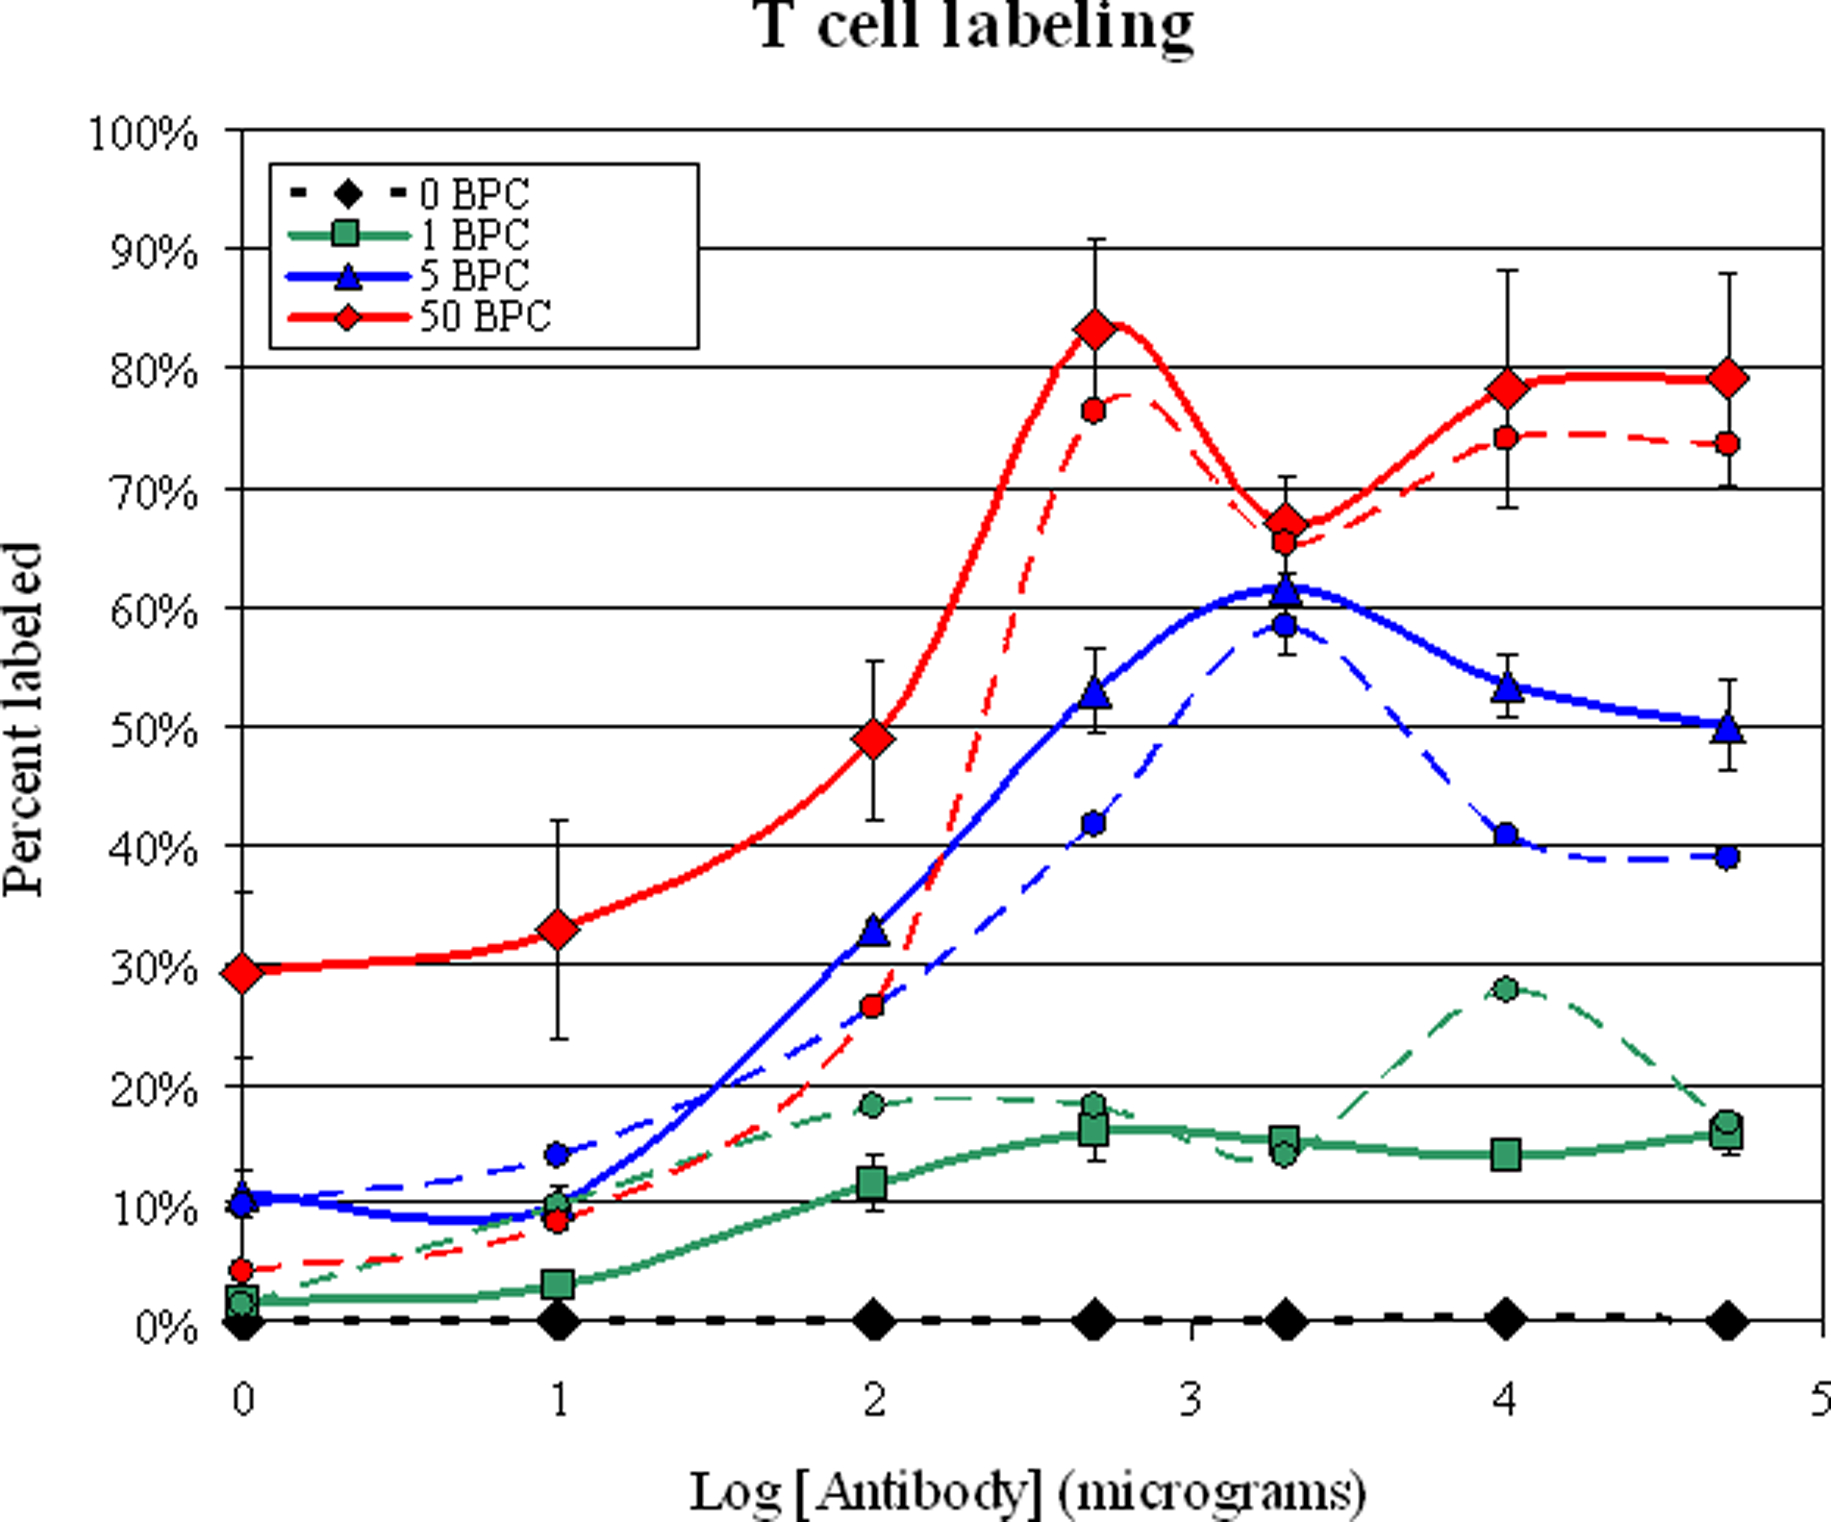
Plot of % T cell labeling versus antibody concentration. The red curves are for 50 beads per cell in the labeling procedure, the blue curves are for 5 beads per cell and the blue curves are for 1 bead per cell. The black curve is for 0 beads per cell. Solid lines are means of the flow cytometry measurements; dashed lines are the manual counts. Note that the X axis is logarithmic.
Figure 2 demonstrates that there was wide heterogeneity in number of incorporated MPIOs per T cell. Flow cytometry revealed two populations of labeled lymphocytes, both equal in linear cell size, but one appearing more granular than the other. Figure 2A is a flow cytometry report for cells stained with antibody only, revealing a single, compact lymphocyte population in gate A. Labeling with particles did not change the linear dimensions of the cells, but it can be seen in Figure 2B that the lymphocyte population smeared into gate E, increasing in apparent granularity. Following a sort of the lymphocyte gate based on granularity for a sample incubated with 2X saturating antibody and 50 MPIOs/cell, confocal fluorescent microscopy revealed that the more granular appearing cells had many more incorporated MPIOs (Range 16–56 beads/cell, Mean 35.0 +/− 11.4) than the less granular appearing population (Range 1–5 beads/cell, Mean 2.5 +/− 1.3). These two cellular subsets were equally populated for the highest labeling conditions.
2).

Example flow cytometry reports for samples without (A) and with MPIO labeling (B). This report is from cells labeled with 0.4 times saturating amounts of antibody and 5 beads per cell. Gate A is the less granular T cells, gate E is the more granular T cells. Panel C is the fluorescence measured for gate A without cell labeling. Panel D and E are the fluorescence measurements from gate A and E, respectively for labeled cells. (F) Representative labeled cell from gate E, MPIOs are green, nucleus is stained blue with DAPI. (G) Representative cell from gate A. Each T cell measures approximately 10 microns in diameter.
Electron microscopy was performed to determine the cellular location of MPIOs. Figure 3 shows several T cells with particles attached to the surface of the cells (a-f, greater than 90% of the total) and one with particles endocytosed (g-i). The particles appear heterogeneous in the density of dark iron oxide inside. This may be a real reflection of the iron oxide content of the particles or an oblique cut on the side of a particle. The surface attached particles often appear attached to cellular extensions, as in the case of a-c or in concave areas of the cell, perhaps as the cell tries to endocytose the particle (d-f). Figure 3G shows one cell which has endocytosed three particles, with expansions in 3H-I. While these particles are clearly within the cell, they are close to the edge of the cell, likely due to the low amount of cytoplasm in a T cell. No attempt was made at this stage to determine the percent of particles present extra- or intracellularly.
3).

Electron microscopy of labeled T cells. Particles were found sticking to cellular processes (A-C), in concave extracellular cavities (D-F) and sometimes in intracellular compartments (G). Panels H and I are expansions of two particles from the cell in Panel G (dashed boxes).
Cellular viability and the percentage of fluorescent cells were assessed. For this, cells were labeled with 2X saturation of the CD5 receptors and 30 beads per cell. This resulted in 57.0 +/− 2.1% T cell labeling and >95% viability. After two days in culture, cellular viability was 88.0 +/− 1.4% and the percent of T cells that had fluorescent beads was 45.2 +/− 4.4%. This was 79.3% of the original labeling percent.
Figure 4 summarizes the cytokine release assays after two day exposure to anti-CD3, an antibody against the T cell antigen receptor. Interleukin-2 production and release from stimulated, labeled T cells was not different for all experimental conditions over the entire range of cell concentrations (Figure 4A). Similarly, interferon-gamma (Figure 4B) production and release were not affected by any of the experimental conditions, except for at the highest cell concentration, where control unlabeled cells exhibited greatly augmented cytokine release. However, at 625,000 cells in 100 microliters, this exceeds the concentration of T cells in peripheral blood.
4).

ELISA cytokine assays for A) Interleukin-2 and B) Interferon-gamma production and release. The four conditions are 1) cells alone, 2) cells labeled only with anti-CD5 antibody (AB alone), 3) cells incubated only with MPIOs (MPIO alone), and 4) cells first labeled with the antibody, then incubated with the MPIOs (AB + MPIO).
MRI showed multiple punctate, isolated, hypointense spots from the labeled cells (Figure 5A). Signal attenuation from single cells at 100 microns isotropic was 78 +/− 10%, with dimensions of the enhancement of 300 microns in all three dimensions (Figure 5B). The heterogeneity of the sizes of the spots is reflective both of the differences in the number of particles incorporated on each cell, as well as partial volume effects from the large voxel sizes, with respect to the size of the cells. Unlabeled cells were undetectable, as previously demonstrated (8) (data not shown).
5).

Panel A is an MRI slice from the labeled lymphocyte phantom showing isolated, punctate, dark contrast spots. The barscale is in millimeters. Panel B is a mean plot profile through 12 spots, measuring the linear size and percent contrast generated by labeled lymphocytes in the MRI experiments performed here.
Discussion
T cells have been implicated in a number of diseases, in maladies such as multiple sclerosis (MS), and therapeutically in immunotherapy of cancer. The ability to detect the presence of T cells by MRI could assist in an early detection disease, or in the case of immunotherapy allow an analysis of homing kinetics and efficiency of T cells to tumors. Measuring these processes at the single cell level facilitates quantification of these parameters, as well as studying rare or potentially novel cellular movements.
T cells were labeled with MPIOs by way of an antibody-mediated, biotin-streptavidin recognition strategy, achieving cellular iron loads previously demonstrated to be sufficient for in vivo single cell detection (14–16). The large iron load delivered by MPIOs to T cells in this study ranged from a few pg for cells with 1–2 particles in the less granular, lightly labeled population, to as much 60 pg/cell in the highly granular, well labeled population. The iron content in the highest labeled cells was at least 30 times larger than that currently achievable with (U)SPIOs (4). The reason for the large disparity in cell labeling from cell to cell is not known. Indeed, in an effort to ensure the dispersity of the particles and antibody by shaking the samples, heterogeneous cell labeling was still observed. This may reflect a true heterogeneous expression of CD5.
In most cell labeling techniques, the iron oxide particles are endocytosed and distribute within endosomes or lysosomes. In the present work, antibody mediated coupling of MPIOs to T cells led to a predominantly extracellular label. It remains to be tested whether the presence of the MPIOs on the cell surface will interfere with migration properties of the lymphocytes. A few of the lymphocytes had taken the particles up into intracellular spaces and it may be that incubating longer or adding agents to stimulate endocytosis, such as TAT peptide (3) or polyamine groups (18) may increase the number of particles that can be endocytosed.
The high percent of live labeled cells (88%) following two days of cell culture suggests that the label does not significantly affect cellular viability. The decrease in the percentage of cells with an incorporated label during the cell culture period, 79% of the original labeling percentage, may be due to either the small percentage of cell death measured by trypan value exclusion test, through cell division of labeled cells, or simply that the label may have fallen off of the cell.
A major issue with using antibodies to label lymphocytes is that the antibody may activate the cells or alter production and release of cytokines. Activation of T cells through the T cell antigen receptor complex (CD3) results in the triggering of several signaling pathways. This leads to the induction of a number of genes, including those encoding cytokines such as interleukin-2 and interferon-gamma which have important immunoregulatory effects. ELISA assays revealed no changes in production and release by labeled cells of these two cytokines. That the labeling scheme used here had no detrimental effect on T cell behavior may be due to the number of attached particles to cells. This is an advantage of using MPIOs to label lymphocytes, in that only one or a few particles are necessary for single cell detection, requiring only a few productive antibody-receptor complexes. Lastly, antibody-mediated magnetic cell labeling with MPIOs should be particularly useful for labeling other cells in suspension such as hematopoietic stem cells or cells where low receptor copies are expressed.
References
- 1.Yeh TC, Zhang W, Ildstad ST, Ho C. Intracellular labeling of T-cells with superparamagnetic contrast agents. Magn Reson Med 1993;30(5):617–625. [DOI] [PubMed] [Google Scholar]
- 2.Hu DE, Kettunen MI, Brindle KM. Monitoring T-lymphocyte trafficking in tumors undergoing immune rejection. Magn Reson Med 2005;54(6):1473–1479. [DOI] [PubMed] [Google Scholar]
- 3.Kircher MF, Allport JR, Graves EE, Love V, Josephson L, Lichtman AH, Weissleder R. In vivo high resolution three-dimensional imaging of antigen-specific cytotoxic T-lymphocyte trafficking to tumors. Cancer Res 2003;63(20):6838–6846. [PubMed] [Google Scholar]
- 4.Arbab AS, Bashaw LA, Miller BR, Jordan EK, Bulte JW, Frank JA. Intracytoplasmic tagging of cells with ferumoxides and transfection agent for cellular magnetic resonance imaging after cell transplantation: methods and techniques. Transplantation 2003;76(7):1123–1130. [DOI] [PubMed] [Google Scholar]
- 5.Bulte JW, Hoekstra Y, Kamman RL, Magin RL, Webb AG, Briggs RW, Go KG, Hulstaert CE, Miltenyi S, The TH. Specific MR imaging of human lymphocytes by monoclonal antibody-guided dextran-magnetite particles. Magn Reson Med 1992;25(1):148–157. [DOI] [PubMed] [Google Scholar]
- 6.Ahrens ET, Feili-Hariri M, Xu H, Genove G, Morel PA. Receptor-mediated endocytosis of iron-oxide particles provides efficient labeling of dendritic cells for in vivo MR imaging. Magn Reson Med 2003;49(6):1006–1013. [DOI] [PubMed] [Google Scholar]
- 7.Hinds KA, Hill JM, Shapiro EM, Laukkanen MO, Silva AC, Combs CA, Varney TR, Balaban RS, Koretsky AP, Dunbar CE. Highly efficient endosomal labeling of progenitor and stem cells with large magnetic particles allows magnetic resonance imaging of single cells. Blood 2003;102(3):867–872. [DOI] [PubMed] [Google Scholar]
- 8.Shapiro EM, Skrtic S, Koretsky AP. Sizing it up: cellular MRI using micron-sized iron oxide particles. Magn Reson Med 2005;53(2):329–338. [DOI] [PubMed] [Google Scholar]
- 9.Shapiro EM, Skrtic S, Sharer K, Hill JM, Dunbar CE, Koretsky AP. MRI detection of single particles for cellular imaging. Proc Natl Acad Sci U S A 2004;101(30):10901–10906. [DOI] [PMC free article] [PubMed] [Google Scholar]
- 10.Hill JM, Dick AJ, Raman VK, Thompson RB, Yu ZX, Hinds KA, Pessanha BS, Guttman MA, Varney TR, Martin BJ, Dunbar CE, McVeigh ER, Lederman RJ. Serial cardiac magnetic resonance imaging of injected mesenchymal stem cells. Circulation 2003;108(8):1009–1014. [DOI] [PMC free article] [PubMed] [Google Scholar]
- 11.Zhang RL, Zhang L, Zhang ZG, Morris D, Jiang Q, Wang L, Zhang LJ, Chopp M. Migration and differentiation of adult rat subventricular zone progenitor cells transplanted into the adult rat striatum. Neuroscience 2003;116(2):373–382. [DOI] [PubMed] [Google Scholar]
- 12.Dunning MD, Kettunen MI, Ffrench CC, Franklin RJ, Brindle KM. Magnetic resonance imaging of functional Schwann cell transplants labelled with magnetic microspheres. Neuroimage 2006;31(1):172–180. [DOI] [PubMed] [Google Scholar]
- 13.Rodriguez O, Fricke S, Chien C, Dettin L, Vanmeter J, Shapiro E, Dai HN, Casimiro M, Ileva L, Dagata J, Johnson MD, Lisanti MP, Koretsky A, Albanese C. Contrast-enhanced in vivo imaging of breast and prostate cancer cells by MRI. Cell Cycle 2006;5(1):113–119. [DOI] [PubMed] [Google Scholar]
- 14.Shapiro EM, Sharer K, Skrtic S, Koretsky AP. In vivo detection of single cells by MRI. Magn Reson Med 2006;55(2):242–249. [DOI] [PubMed] [Google Scholar]
- 15.Wu YL, Ye Q, Foley LM, Hitchens TK, Sato K, Williams JB, Ho C. In situ labeling of immune cells with iron oxide particles: an approach to detect organ rejection by cellular MRI. Proc Natl Acad Sci U S A 2006;103(6):1852–1857. [DOI] [PMC free article] [PubMed] [Google Scholar]
- 16.Heyn C, Ronald JA, Mackenzie LT, MacDonald IC, Chambers AF, Rutt BK, Foster PJ. In vivo magnetic resonance imaging of single cells in mouse brain with optical validation. Magn Reson Med 2006;55(1):23–29. [DOI] [PubMed] [Google Scholar]
- 17.Dallman MJ, Thomas ML, Green JR. MRC OX-19: a monoclonal antibody that labels rat T lymphocytes and augments in vitro proliferative responses. Eur J Immunol 1984;14(3):260–267. [DOI] [PubMed] [Google Scholar]
- 18.Allen MJ, MacRenaris KW, Venkatasubramanian PN, Meade TJ. Cellular delivery of MRI contrast agents. Chem Biol 2004;11(3):301–307. [DOI] [PubMed] [Google Scholar]