Abstract
Background:
Previous studies have demonstrated the noninferiority of pathologists’ interpretation of whole slide images (WSIs) compared to microscopic slides in diagnostic surgical pathology; however, to our knowledge, no published studies have tested analytical precision of an entire WSI system.
Methods:
In this study, five pathologists at three locations tested intra-system, inter-system/site, and intra- and inter-pathologist precision of the Aperio AT2 DX System (Leica Biosystems, Vista, CA, USA). Sixty-nine microscopic slides containing 23 different morphologic features suggested by the Digital Pathology Association as important to diagnostic pathology were identified and scanned. Each of 202 unique fields of view (FOVs) had 1–3 defined morphologic features, and each feature was represented in three different tissues. For intra-system precision, each site scanned 23 slides at three different times and one pathologist interpreted all FOVs. For inter-system/site precision, all 69 slides were scanned once at each of three sites, and FOVs from each site were read by one pathologist. To test intra- and inter-pathologist precision, all 69 slides were scanned at one site, FOVs were saved in three different orientations, and the FOVs were transferred to a different site. Three different pathologists then interpreted FOVs from all 69 slides. Wildcard (unscored) slides and washout intervals were included in each study. Agreement estimates with 95% confidence intervals were calculated.
Results:
Combined precision from all three studies, representing 606 FOVs in each of the three studies, showed overall intra-system agreement of 97.9%; inter-system/site agreement was 96%, intra-pathologist agreement was 95%, and inter-pathologist agreement was 94.2%.
Conclusions:
Pathologists using the Aperio AT2 DX System identified histopathological features with high precision, providing increased confidence in using WSI for primary diagnosis in surgical pathology.
Keywords: Digital pathology, precision, whole slide images
INTRODUCTION
The integration of digital scanning technology with a robotic microscope to capture high-resolution images of an entire microscope slide has led to the commercial development of whole slide imaging (WSI) systems that are being used for research, education, and – increasingly – disease diagnosis.[1,2,3,4] Following guidelines from the Digital Pathology Association (DPA) and the College of American Pathologists,[5] many studies have compared diagnostic interpretation of microscope slides by conventional microscopy with WSI,[6,7,8,9,10,11,12,13,14,15] but few studies have evaluated the analytical precision of an entire WSI system. This study thoroughly evaluated the performance of the Aperio AT2 DX imaging system by testing the intra-system, inter-system/site, and intra- and inter-pathologist precision.
A critical skill for rendering a histopathologic diagnosis is the pathologist's ability to reproducibly identify the characteristic features of normal and diseased cells and tissues in histologic sections. While microscope quality varies considerably, it remains an open question whether WSI will be sufficiently reproducible to enable feature identification. The purpose of this report is to describe studies that tested the diagnostic precision of pathologists’ ability to identify a panel of important histopathologic features using the Aperio AT2 DX system (Leica Biosystems, Inc.). Precision was evaluated with respect to the system and pathologist. Both of these variables can affect the overall repeatability/reproducibility of the device: within-pathologist/system agreement is an estimate of repeatability, while between-pathologist/system agreement is an estimate of reproducibility. Three sets of comparisons were performed: (1) within a single imaging system (intra-system precision), (2) between three systems at three different sites (inter-system/site precision), and (3) within and between pathologists (intra- and inter-pathologist precision). We hypothesized that the overall agreement for each of the precision components would be at least 85% if a system were to be used for primary diagnosis. The results showed that all of the precision components far exceeded 85%, indicating a level of precision acceptable for diagnostic use.
METHODS
Study design
There were three participating study sites, including Pacific Rim Pathology (San Diego, CA, USA), Intermountain Biorepository (Salt Lake City, UT, USA), and a laboratory internal to Leica Biosystems (Vista, CA, USA). The study protocol and protocol amendments were submitted to the institutional review boards (IRBs) of each of the three study sites for review, and approval from each was obtained before the study was initiated. Protocol amendments were reviewed and approved by the IRBs before any changes were implemented. The study pathologists were masked to the expected results and the interpretations of the other pathologists.
System
The Aperio AT2 DX System (Leica Biosystems) consists of a slide image acquisition scanner, an image viewing station, and remote work stations running the Aperio ImageScope DX viewing application. The scanner uses a 20x/0.75 NA Plan Apo lens to create WSI of 0.5 μ/pixel, or a 2x optical magnification changer to create 40x WSI of 0.25 μ/pixel. Labeled glass microscope slides with stained tissue are loaded into the scanner, and the system scans the tissue in a series of stripes perpendicular to the long axis of the slide. The striped images are stitched into a single high-resolution image that represents the entire tissue section linked to the label and other metadata. After scanning, the WSI can be viewed locally on workstations using the ImageScope DX software (Leica Biosystems, Vista, CA).
Slide and feature selection
Before study initiation, microscope slides containing specific histologic features recommended by the DPA and Food and Drug Administration were selected for study inclusion, representing a broad spectrum of tissues. The features are listed in Table 1. The Medical Director (TB) selected slides for study inclusion and identified potential features of interest but did not participate as a study pathologist in any of the three precision studies. First, de-identified cases with selected study features were sequentially identified by a retrospective search of the Laboratory Information System (LIS) at Cleveland Clinic, not among the study sites to ensure reading pathologists at each site had not previously seen each case/fields of view (FOV). To emphasize diversity of feature context, three different tissue sites were searched for each feature. For example, for the feature “psammoma body,” cases of meningioma, papillary thyroid carcinoma, and papillary endometrial carcinoma were sought because each of those sites/diagnoses would be likely to contain psammoma bodies. Each case identified by the LIS was then reviewed by the Medical Director to identify slides that contained one or more of the selected features. Note that multiple cases were not prescreened to identify the best possible example of each feature; rather, once a case was selected as likely to contain the feature based on its diagnosis, a slide from that case was selected for study inclusion. For example, one feature was a Reed–Sternberg cell, the characteristic cell of Hodgkin's lymphoma. A LIS search “Hodgkin's lymphoma” was initiated, and cases from three different tissues – mediastinal lymph node, spleen, and liver – were selected. The Medical Director could not review multiple cases of Hodgkin's lymphoma in search of the best example of a Reed–Sternberg cell, but instead was instructed to select the best example of a Reed–Sternberg cell from the available slides of the case identified by the LIS search as Hodgkin's lymphoma from each tissue type.
Table 1.
Primary histologic features in the precision study
| Magnification level | Primary feature | Organ type |
|---|---|---|
| ×20 | Chondrocytes | Toe |
| Femoral head | ||
| Osteosarcoma of humerus | ||
| Fat cells (adipocytes) | Axillary lymph node | |
| Femoral head | ||
| Prostate | ||
| Foreign body giant cells | Left knee synovium | |
| Shoulder | ||
| Sigmoid colon | ||
| Goblet cells in intestinal mucosa or intestinal metaplasia | Gastroesophageal junction | |
| Sigmoid colon | ||
| Tubular adenoma (intestine) | ||
| Granulomas | Colon | |
| Iliac crest (bone) | ||
| Cervical lymph node | ||
| Infiltrating or metastatic lobular carcinoma | Iliac crest (bone) | |
| Jejunum | ||
| Left breast | ||
| Intraglandular necrosis | Left lung | |
| Liver | ||
| Right colon | ||
| Osteoclasts | Sacrum | |
| Toe | ||
| Paget disease of the spine | ||
| Osteocytes | Foot | |
| Maxilla | ||
| Osteosarcoma of femur | ||
| Pleomorphic nucleus of malignant cell | Left 11th rib | |
| Sacrum | ||
| Vertebra | ||
| Serrated intestinal epithelium (for example sessile serrated polyp) | Appendix | |
| Ascending colon polyp | ||
| Sigmoid colon | ||
| Skeletal muscle fibers | Right lower leg | |
| Shoulder | ||
| Spine | ||
| ×40 | Asteroid bodies | Axillary lymph node |
| Liver | ||
| Synovium | ||
| Clear cells (renal cell carcinoma) | Humerus | |
| Retroperitoneal lymph node | ||
| Right kidney | ||
| Foreign bodies (for example plant material or foreign debris) | Distal femur | |
| Foot | ||
| Wrist | ||
| Hemosiderin (pigment) | Knee synovium | |
| Liver | ||
| Osteosarcoma of femur | ||
| Megakaryocytes | Cervical spine | |
| Femur (margin of sarcoma) | ||
| Tibia | ||
| Necrosis | Femoral head | |
| Left para-aortic lymph node | ||
| Right leg | ||
| Nerve cell bodies (for example ganglion cells) | Ganglioneuroma | |
| Small bowel | ||
| Stomach | ||
| Nuclear grooves | Cervical lymph node (papillary thyroid carcinoma) | |
| Iliac crest (bone) (langerhans cell granuloma) | ||
| Ovary (Brenner tumor) | ||
| Osteoid Matrix | Femur | |
| Humerus | ||
| Lung | ||
| Psammoma bodies | Cervical lymph node (metastatic papillary carcinoma of thyroid) | |
| Fallopian tube (papillary ovarian carcinoma) | ||
| Left ventral cranial region (meningioma) | ||
| Reed-Sternberg cell | Axillary lymph node | |
| Neck mass | ||
| Spleen |
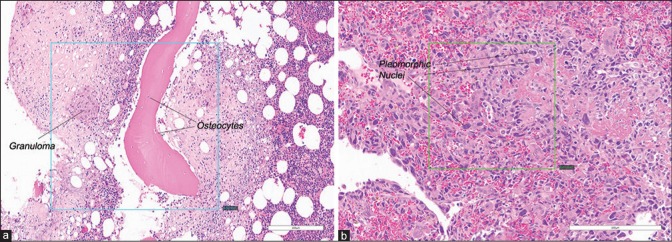
There were 36 slides (12 features in each of three organ types) scanned at × 20, and 33 slides (11 features × 3 organ types) scanned at × 40. Each slide had 1–3 individual features that were captured in a FOV. There were a total of 202 FOVs selected from the 69 slides. Of 202 FOVs, 46 FOVs (from 24 slides) contained multiple histologic features, and 156 FOVs (from 62 slides) contained one primary histologic feature; examples are shown in Figure 1a and b, respectively. While no FOVs had zero (0) histologic features to avoid any futility of a reading pathologist's ability to find any features in a FOV, additional cases representing 36 FOVs were identified as “wild card” slides that contained one or two features listed in the Case Report Form (CRF) that were among the 23 features studied but were not counted in the analysis to reduce recall bias. To further minimize study recall bias, triplicates of the same study FOV from different scans were randomly rotated clockwise in 0°, 90°, 180°, or 270° intervals [example is shown in Figure 2].
Figure 1.
Examples of extracted FOVs. (a) A single FOV containing two study features: Granuloma and osteocytes (×20). (b) A single FOV containing one study feature: Pleomorphic nuclei (×20). FOVs: Fields of views. Inset box in each panel shows FOV specified by the Medical Director
Figure 2.
Examples of the rotation of triplicates of the same study FOV from different scans. (a) FOV containing megakaryocytes (×40) rotated at 0°. (b) The same FOV containing megakaryocytes (×40) from was rotated clockwise at 90° relative to A. (c) The same FOV containing megakaryocytes (×40) from was rotated clockwise at 270° relative to A. The yellow inset box in each panel shows FO V. FOV: Fields of view
Image distribution
As noted above, three study sites participated. Study Site #1 utilized three pathologists for the intra- and inter-pathologist precision studies. There was one pathologist at Study Site #2 for the intra-system precision study, while there was one pathologist at Study Site #3 for the inter-system/site precision study. The three studies were conducted using the same set of 69 slides across sites, systems, and pathologists. WSI files were transferred to the sponsor to create FOVs as annotated by the Medical Director. For each specific feature in each WSI, a FOV was extracted. To generate randomly rotated FOVs, different scans of the same feature were rotated at 90° intervals and assigned different identification numbers to minimize recall bias [Figure 2].
Whole slide image interpretation and reporting
Study pathologists viewed FOVs using the Aperio AT2 DX Viewing Station, and for each FOV file, they recorded whether each of the features on the checklist was present or absent (1 or 2 features among 11–12 listed on the CRF among the 23 features studied could be present in each FOV). Study pathologists could identify multiple features as present, and as long as the main feature or features were identified, the interpretation was scored as correct. Patient information available at original case sign out was not available to study pathologists. So that viewing FOVs mimicked feature identification by traditional microscopy, reading pathologists were restricted to viewing the FOV at the indicated magnification (×20 or × 40) and were not able to navigate or zoom each FOV.
Precision was assessed for each set of comparisons (i.e., each study) separately by analyzing agreement within systems, between system/sites, and within and between pathologists, as described below. Overall agreements within systems, between system/sites, and within and between pathologists were also calculated.
Intra-system precision study
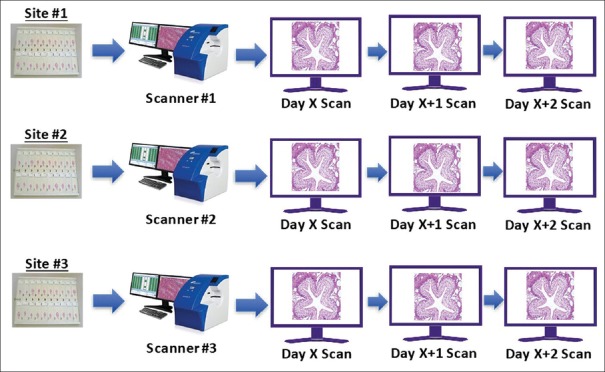
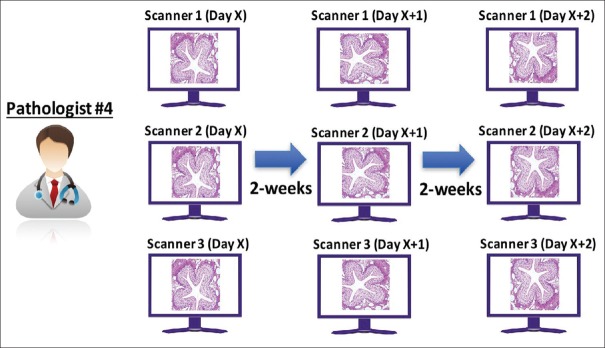
A panel of 69 microscope slides was split equally among the three study sites [Figure 3], and each site scanned 23 slides once on each of 3 days, producing three scans per slide. FOVs were prepared by the sponsor and transferred to a single study pathologist (Pathologist #4) for review. The pathologist interpreted all FOVs from all three systems and all scanning sessions [Figure 4]. At the first reading session, the pathologist read the first set of FOVs from the 1st day of scanning from all three systems. To minimize recall bias, a 14-day delay (“washout period”) was added in between each reading session, and FOVs were randomly assigned in each reading session. After the minimum 14-day washout period, the same pathologist read the second set of FOVs from the 2nd day of scanning from all three systems. After another 14-day washout period, the same pathologist read the third set of FOVs. Interpretations were recorded and transferred to the sponsor, and intra-system agreement was calculated as described below for each system and overall.
Figure 3.
Intra-system precision study: Scanning schema. The panel of 69 microscope slides was split equally among the three study sites, and each site scanned 23 slides once on each of 3 days, producing three scans per slide
Figure 4.
Intra-system precision study: Reading and analysis schema. A single pathologist interpreted all intra-system study FOVs from all three systems and all scanning sessions. FOVs: Fields of views
Inter-system/site precision study
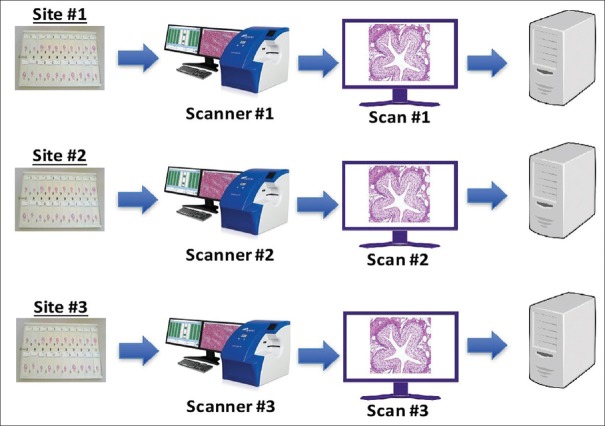
Precision was tested at three sites, each with a single scanning system. At each site, the entire set of 69 microscope slides was scanned once [Figure 5]. FOVs were generated and transferred to a single pathologist (Pathologist #5) for review. Three reading sessions were conducted [Figure 6]. In the first session, the pathologist read the first set of FOVs from Scanner #1. After a 14-day washout period, the second set of FOVs from Scanner #2 was read by the same pathologist. After another 14-day washout period, the third set of FOVs from Scanner #3 was read by the same pathologist. Interpretations were transferred to the sponsor and inter-system/site agreement calculated as described below per each pair of systems and overall.
Figure 5.
Inter-system/site precision study: Scanning schema. The entire set of 69 microscope slides was scanned once at each of the three study sites
Figure 6.
Inter-system/site precision study: Reading schema. A single pathologist interpreted all inter-system study FOVs from all three systems scanned at three study sites. FOVs: Fields of views
Intra- and inter-pathologist precision study
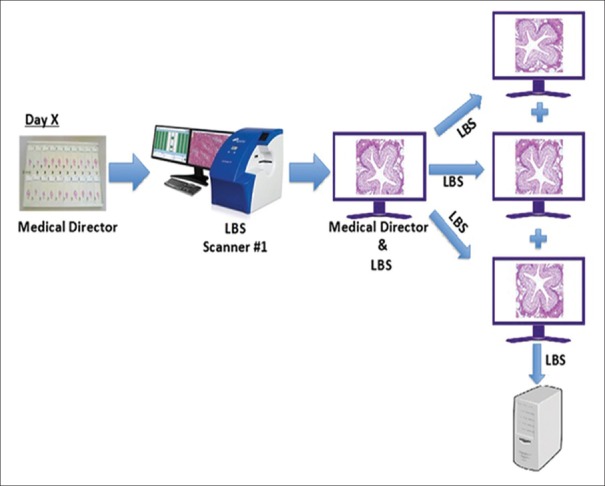
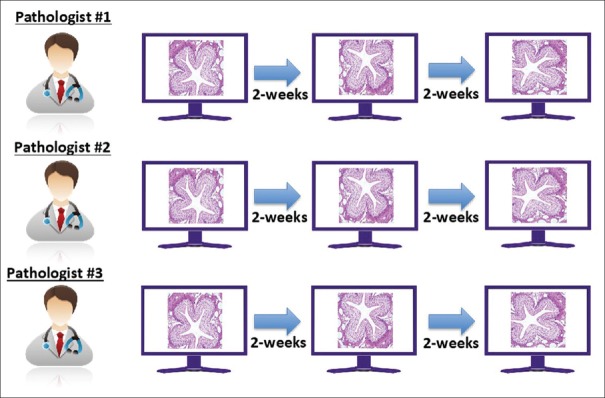
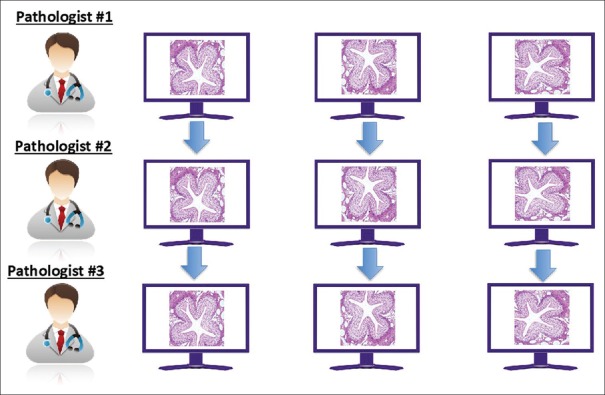
The entire set of 69 microscope slides was scanned once at Site #1 using a single scanner. For each feature, a FOV was extracted and saved in three different orientations [Figure 7]. FOVs were transferred to three different pathologists (Pathologists #1, #2, and #3), all at Study Site #3. Each of the three pathologists first evaluated the FOVs in a single orientation from all 69 slides. After at least a 14-day washout period, each of the three pathologists read the second set of FOVs, all of which were presented in different orientations. After an additional 14-day washout period, the third set of FOVs was interpreted from a third orientation by the three pathologists. The interpretations were transferred to the sponsor, and the intra- [Figure 8] and inter-pathologist [Figure 9] agreements were calculated as described below.
Figure 7.
Intra- and inter-pathologist precision study: Scanning and FOV preparation schema. The entire set of 69 microscope slides was scanned once at Site #1 using a single scanner. For each feature, a FOV was extracted and saved in three different orientations. FOV: Fields of view. LBS: Leica Biosystems
Figure 8.
Intra- and inter-pathologist precision study: Reading schema and analysis for intra-pathologist evaluation. Three pathologists each interpreted all intra-, inter-pathologist study FOVs at three different sessions with >14-day washout in between. Within-pathologist performance was evaluated. FOVs: Fields of views
Figure 9.
Intra- and inter-pathologist precision study: Analysis for inter-pathologist evaluation. The precision of performance. Three pathologists each interpreted all intra-, inter-pathologist study FOVs at three different session with >14-day washout in between. In-between-pathologist performance was evaluated. FOVs: Fields of views
Statistical methods
Precision was evaluated in terms of agreement, a typical method used to estimate precision for qualitative binary outcomes. Specifically, the precision of the Aperio AT2 DX system was evaluated by calculating agreement according to the formula:

Pairwise agreement was present if the pathologist identified the primary feature as present on paired WSI FOVs. A depiction of how pairwise agreement was determined for each FOV/feature is provided in Table 2.
Table 2.
Determination of pairwise agreement between Pathologists 1 and 2
| Pathologist 2 observed result* | Pathologist 1 observed result* | |
|---|---|---|
| Agreed with expected result | Disagreed with expected result | |
| Agreed with expected result | Pairwise agreement | Disagreement |
| Disagreed with expected result | Disagreement | Disagreement |
*A single pathologist could report the presence of multiple features in each FOV. The observed result was considered concordant if the selected feature (s) (marked “present”) included the 1-2 features expected to be identified in the FOV. The observed result was considered discordant if one or both of the reported features failed to match the feature (s) expected to be identified in the FOV. FOV: Fields of view
As noted above, the slide set used in each of the three studies consisted of 69 slides with study features and the total unique set of FOVs. The 12 “wild card” slides with FOVs were not used in the primary statistical analysis. Comparisons by study were as follows:
Intra-system
Three different systems were evaluated. A randomly selected one-third of the 69 slides were scanned on each system three times. FOVs extracted from each scan were evaluated for the presence/absence of the primary feature by one pathologist. Agreements between Scan 1 versus Scan 2, Scan 1 versus Scan 3, and Scan 2 versus Scan 3 were calculated for each system/site. The overall intra-system precision was based on the pooled data from all three systems.
Inter-system
Three different systems were evaluated. One scan of each slide was obtained on each of the three different systems. Each FOV was evaluated for the presence/absence of the primary feature by a different pathologist for each system. Agreements between System 1 versus System 2, System 1 versus System 3, and System 2 versus System 3 were calculated. The overall inter-system precision was based on the pooled data from all possible system to system comparisons.
Intra-pathologist
Each of the three orientations of each FOV was evaluated for the presence/absence of the primary feature by each of the three pathologists. Agreement between Orientation 1 versus Orientation 2, Orientation 1 versus Orientation 3, and Orientation 2 versus Orientation 3 was calculated for each pathologist. The overall intra-pathologist agreement estimate was based on pooled data from all three pathologists.
Inter-pathologist
The same set of FOVs used in intra-pathologist study was used in inter-pathologist study. Each of the three orientations of each FOV was evaluated for the presence/absence of the primary feature or features by each of the three pathologists. Agreements between Pathologist 1 versus Pathologist 2, Pathologist 1 versus Pathologist 3, and Pathologist 2 versus Pathologist 3 across orientations were calculated. The overall inter-pathologist agreement was based on pooled data all pathologist-to-pathologist comparisons.
All agreement estimates were calculated along with two-sided 95% confidence intervals (CIs). A robust nonparametric Bootstrap approach was used to calculate CIs. To preserve the study's covariance structure, each FOV was a unit of bootstrap sampling. CIs were based on the 2.5–97.5 percentile of the agreement rate distribution obtained from all 1000 bootstrap samples for each comparison. In cases where the estimated agreement rate was 100%, the Arcsine (variance-stabilizing transformation) approach that corrects for continuity was employed to generate adjusted CIs.[16] SAS Version 9.4 statistical software (SAS Institute, Cary, NC) was used for all calculations.
RESULTS
Intra-system precision
The number of FOVs obtained from single scans of 23 slides by each system/site was comparable (Site 1 = 67, Site 2 = 67, and Site 3 = 68). Combining the three systems, a total of 606 FOVs (3× [67 + 67 + 68]) were extracted and reviewed by a single study pathologist, with an average washout time between reading sessions of 17.1 days. Overall agreement was 97.9% (95% CI: 95.9%–99.5%) with agreement across systems, 96.0%–100% [Table 3].
Table 3.
Intra-system precision: Agreement within systems by a single pathologist
| System | Number of pairwise agreements | Number of comparison pairs | Agreement rate and 95% CI | ||
|---|---|---|---|---|---|
| Percentage agreement | Lower | Upper | |||
| Site 1 | 193 | 201 | 96.0 | 91.0 | 100 |
| Site 2 | 201 | 201 | 100 | 98.2 | 100 |
| Site 3 | 199 | 204 | 97.5 | 93.6 | 100 |
| Overall | 593 | 606 | 97.9 | 95.9 | 99.5 |
CI: Confidence interval
Features not identified by the Site #1 pathologist were nuclear grooves (not identified twice in each of 3 scans) and an osteoclast (not identified once). Features not identified by the Site #3 pathologist were goblet cells (not identified in one of three scans) and necrosis (not identified in two of three scans).
Inter-system/site precision study results
Combining the three systems, 606 FOVs (202 FOV from the 69 slides × 3 systems/site) were extracted. The FOVs were reviewed by a single pathologist over three reading sessions, with an average washout time of 32.9 days. Overall agreement was 96% (95% CI: 93.6%–98.2%) with agreement across sites 95.5%–96.5%. The results are shown in Table 4.
Table 4.
Inter-system/site precision study: Agreement between systems
| System | Number of pairwise agreements | Number of comparison pairs | Agreement rate and 95% CI | ||
|---|---|---|---|---|---|
| Percentage Agreement | Lower | Upper | |||
| Site 1 versus site 2 | 195 | 202 | 96.5 | 94.1 | 99.0 |
| Site 1 versus site 3 | 194 | 202 | 96.0 | 93.1 | 98.5 |
| Site 2 versus site 3 | 193 | 202 | 95.5 | 92.6 | 98.0 |
| Overall | 582 | 606 | 96.0 | 93.6 | 98.2 |
CI: Confidence interval
Features most frequently not identified in the inter-system precision study included Reed–Sternberg cells (×40, not identified in 2 of 9 scans), nuclear grooves (×40, not identified in 2 of 9 scans), osteoclasts (×20, not identified in 3 of 9 scans), and necrosis (×40, not identified in 5 of 9 scans).
Intra- and inter-pathologist precision study results
Combining the three orientations, 606 FOVs (202 FOVs from the 69 slides × 3 orientations/FOV) were extracted and transferred to each of the three study pathologists at one site. The overall intra-pathologist agreement was 95% (95% CI: 92.9%–96.8%), with a range of 92.6%–98.2% [Table 5], whereas the overall inter-pathologist agreement was 94.2% (95% CI: 91.7%–96.4%, with a range of 92.7%–95.5% [Table 6].
Table 5.
Intra-Pathologist agreements
| Pathologist | Number of pairwise agreements | Number of comparison pairs | Agreement rate and 95% CI | ||
|---|---|---|---|---|---|
| Percentage agreement | Lower | Upper | |||
| Pathologist 1 | 561 | 606 | 92.6 | 89.6 | 95.7 |
| Pathologist 2 | 595 | 606 | 98.2 | 96.3 | 99.7 |
| Pathologist 3 | 571 | 606 | 94.2 | 91.4 | 96.9 |
| Overall | 1727 | 1818 | 95.0 | 92.9 | 96.8 |
CI: Confidence interval
Table 6.
Inter-pathologist agreements
| Pathologist comparison | Number of pairwise agreements | Number of comparison pairs | Agreement rate and 95% CI | ||
|---|---|---|---|---|---|
| Percentage agreement | Lower | Upper | |||
| Pathologist 1 versus Pathologist 2 | 572 | 606 | 94.4 | 91.6 | 96.9 |
| Pathologist 1 versus Pathologist 3 | 562 | 606 | 92.7 | 89.9 | 95.4 |
| Pathologist 2 versus Pathologist 3 | 579 | 606 | 95.5 | 93.1 | 97.7 |
| Overall | 1713 | 1818 | 94.2 | 91.7 | 96.4 |
CI: Confidence interval
Features not identified most frequently in the intra-pathologist precision study included Reed–Sternberg cells, “pleomorphic nucleus of a malignant cell,” nuclear grooves, and foreign body giant cells.
Most common discrepant features
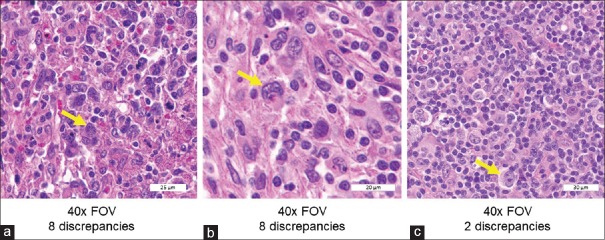
Eleven of the 23 features had at least one discrepancy in the study (data not shown). The four most frequently discrepant features in the inter-pathologist precision study were Reed–Sternberg cells (0.62% discrepancy rate among all study reads), nuclear grooves (0.46%), foreign body giant cells (0.32%), and necrosis (0.30%). Review of the three FOVs with Reed–Sternberg cells suggests that FOVs with more canonical-appearing and/or abundant Reed–Sternberg cells were more likely to be concordant [Figure 10].
Figure 10.
Extracts from the three FOVs with Reed–Sternberg cells. FOVs in A and B had eight study discrepancies each, whereas C had only two discrepancies. (a) Several atypical-appearing cells, one of which was classified as a Reed–Sternberg cell (arrow) by the Medical Director, representing the best example in the selected case (×40). (b) The second FOV from a different case at higher magnification (×40), with indicated Reed–Sternberg cell having atypical nuclear features. (c) Had typical Reed–Sternberg cells (×40). FOVs: Fields of view
DISCUSSION
There are a growing number of studies that have compared WSI with conventional microscopy for primary diagnosis in surgical pathology.[6,7,8,9,10,11,12,13,14,15] Among the largest of these studies is by Mukhopadhyay et al.,[15] who reported the results of a blinded, randomized, noninferiority study that included 1992 cases read by 16 pathologists from four institutions. Compared to the original (reference) diagnosis, they reported a major discordance rate of 4.9% for interpreting WSI and 4.6% for interpreting microscope slides. The highest frequency of discordant diagnoses for both microscope slides and WSIs involved endocrine organs, urinary bladder, prostate, and gynecologic cases; organ systems that had the highest frequency of discordant diagnoses with WSI in the Mukhopadhyay study were already known to have relatively high discrepancy rates using traditional microscopy.[17,18,19,20,21] There were no types of cases in which WSI interpretation was consistently less accurate compared with microscope slides when interpreted by multiple observers, and they concluded, consistent with previous studies, that the interpretation of WSI was not inferior to interpreting slides via a microscope for primary diagnosis. We found comparable diagnostic discordance rates for WSI versus traditional microscopy in our clinical validation studies of the AT2 DX System (manuscript in preparation). Notably, the Mukhopadhyay report did not include the results of precision tests of the type described in our study.
While the potential to make accurate diagnoses using WSI is becoming widely accepted, analytical precision is also an important part of any diagnostic system. However, publications describing WSI system development and performance have included only scant mention of a system's analytical precision.[13,22,23,24,25] Occasional studies have compared inter-scanner and inter-algorithm variability of algorithms intended to help quantify biomarker expression,[26] but we are not aware of any published studies that have used a set of defined morphologic features to test the intra-system, inter-system/site, and intra- and inter-pathologist precision of a WSI system.
Instead of employing final diagnosis as a precision study endpoint, we sought to investigate a WSI system's ability to allow identification of a set of critical histopathologic features that can contribute to many diagnoses. Thus, one unique aspect of this study was the actual list of features, originally suggested by the DPA, as fundamentally important to the practice of pathology. While this list represents only a small fraction of features recognized by pathologists, by constructing such a list, the DPA indirectly hypothesized that an inability of a pathologist to consistently identify these features using a given imaging system for diagnosis might compromise patient care. To test the versatility of WSI systems to enable feature identification, we selected examples of each of these 23 features from three different sites/tissues and selected cases for study enrollment on consecutive diagnoses, not textbook-quality examples of selected features. Furthermore, to focus on feature identification rather than diagnostic interpretation, clinical information typically provided on the pathology requisition (such as “rule out lymphoma,” “rule out breast cancer,” “history of hyperparathyroidism,” or “ovarian mass”) that pathologists commonly use to inform their differential diagnosis and thus search for specific histologic features was not provided to reading pathologists in our study.
On re-review of our study's FOVs, it is perhaps not surprising that “Reed–Sternberg cells” had the highest discrepancy rate among the 23 features tested. Possible reasons include (1) the case selection process precluded the Medical Director from selecting “textbook quality” Reed–Sternberg cells; (2) neither the Medical Director nor any of the participating pathologists considered themselves experts in hematopathology; (3) the reading pathologists were not given any clinical information, such as “rule-out lymphoma;” (4) immunohistochemical (IHC) stains such as CD30, CD15, CD20, and CD45 that are often used in clinical practice to help confirm Reed–Sternberg cells as part of the diagnosis of Hodgkin's lymphoma were not available in this study; and (5) Reed–Sternberg cells in two out of three of the FOVs with a greater number of discrepancies had fewer and/or more atypical-appearing Reed–Sternberg cells than the FOV with fewer discrepancies.
The feature with the second-highest discrepancy rate was “nuclear grooves.” This can be a subtle and rare feature even in tumors that are classically known to harbor them, such as meningioma and papillary carcinoma of the thyroid. In addition, each pathologist might have their own visual definition of what they consider a nuclear groove, and no guidelines to clarify what should have been considered a “nuclear groove” were provided. Similarly, there are several morphologic varieties of “foreign body giant cells,” and we speculate that some of our reading pathologists might have searched for an underlying morphologic cause of any necrosis present, rather than identifying “necrosis” per se. Finally, some other features, such as “pleomorphic nucleus of a malignant cell,” were themselves somewhat imprecisely worded.
While we were not able to compare WSI feature identification with glass slide-based feature identification in our study, we do not believe that the discrepancies observed in this study are likely to compromise diagnostic accuracy in practice because WSI diagnoses, like microscopy-based diagnoses, are made with additional information (clinical history, specimen type, and special/IHC stains) not provided to reading pathologists in this study.
In spite of an experimental design that presented many challenges, the lower bounds of the 95% CIs for each of the precision components in this study were far above our hypothesized 85% agreement, indicating that the Aperio AT2 DX System has high precision for diagnostic use.
CONCLUSIONS
Pathologists using the Aperio AT2 DX System identified histopathological features with high precision, providing increased confidence in using WSI for primary diagnosis in surgical pathology.
Financial support and sponsorship
The study was funded by Leica Biosystems, Inc.
Conflicts of interest
There are no conflicts of interest.
Acknowledgments
We thank Shane A. Meehan, MD, Eric Glassy, MD, Kim Oleson, Kevin Liang, Ph.D., Mark Cohn, James Wells, Daniel Schrock, Craig Fenstermaker, Yang Bai, Anish Patel, Ashley Morgan, Jill Funk, Shilpa Saklani, Kelly Paine, Michael Lung, Thom Jessen, and Ryan Chiang for support during this study.
Footnotes
Available FREE in open access from: http://www.jpathinformatics.org/text.asp?2020/11/1/3/277893
REFERENCES
- 1.Jukić DM, Drogowski LM, Martina J, Parwani AV. Clinical examination and validation of primary diagnosis in anatomic pathology using whole slide digital images. Arch Pathol Lab Med. 2011;135:372–8. doi: 10.5858/2009-0678-OA.1. [DOI] [PubMed] [Google Scholar]
- 2.Pantanowitz L, Szymas J, Yagi Y, Wilbur D. Whole slide imaging for educational purposes. J Pathol Inform. 2012;3:46. doi: 10.4103/2153-3539.104908. [DOI] [PMC free article] [PubMed] [Google Scholar]
- 3.Pantanowitz L, Valenstein PN, Evans AJ, Kaplan KJ, Pfeifer JD, Wilbur DC, et al. Review of the current state of whole slide imaging in pathology. J Pathol Inform. 2011;2:36. doi: 10.4103/2153-3539.83746. [DOI] [PMC free article] [PubMed] [Google Scholar]
- 4.Wilbur DC, Madi K, Colvin RB, Duncan LM, Faquin WC, Ferry JA, et al. Whole-slide imaging digital pathology as a platform for teleconsultation: A pilot study using paired subspecialist correlations. Arch Pathol Lab Med. 2009;133:1949–53. doi: 10.1043/1543-2165-133.12.1949. [DOI] [PMC free article] [PubMed] [Google Scholar]
- 5.Pantanowitz L, Sinard JH, Henricks WH, Fatheree LA, Carter AB, Contis L, et al. Validating whole slide imaging for diagnostic purposes in pathology: Guideline from the college of American pathologists pathology and laboratory quality center. Arch Pathol Lab Med. 2013;137:1710–22. doi: 10.5858/arpa.2013-0093-CP. [DOI] [PMC free article] [PubMed] [Google Scholar]
- 6.Bauer TW, Schoenfield L, Slaw RJ, Yerian L, Sun Z, Henricks WH. Validation of whole slide imaging for primary diagnosis in surgical pathology. Arch Pathol Lab Med. 2013;137:518–24. doi: 10.5858/arpa.2011-0678-OA. [DOI] [PubMed] [Google Scholar]
- 7.Bauer TW, Slaw RJ. Validating whole-slide imaging for consultation diagnoses in surgical pathology. Arch Pathol Lab Med. 2014;138:1459–65. doi: 10.5858/arpa.2013-0541-OA. [DOI] [PubMed] [Google Scholar]
- 8.Campbell WS, Lele SM, West WW, Lazenby AJ, Smith LM, Hinrichs SH. Concordance between whole-slide imaging and light microscopy for routine surgical pathology. Hum Pathol. 2012;43:1739–44. doi: 10.1016/j.humpath.2011.12.023. [DOI] [PubMed] [Google Scholar]
- 9.Cornish TC, Swapp RE, Kaplan KJ. Whole-slide imaging: Routine pathologic diagnosis. Adv Anat Pathol. 2012;19:152–9. doi: 10.1097/PAP.0b013e318253459e. [DOI] [PubMed] [Google Scholar]
- 10.Evans AJ, Chetty R, Clarke BA, Croul S, Ghazarian DM, Kiehl TR, et al. Primary frozen section diagnosis by robotic microscopy and virtual slide telepathology: The university health network experience. Hum Pathol. 2009;40:1070–81. doi: 10.1016/j.humpath.2009.04.012. [DOI] [PubMed] [Google Scholar]
- 11.Fallon MA, Wilbur DC, Prasad M. Ovarian frozen section diagnosis: Use of whole-slide imaging shows excellent correlation between virtual slide and original interpretations in a large series of cases. Arch Pathol Lab Med. 2010;134:1020–3. doi: 10.5858/2009-0320-OA.1. [DOI] [PubMed] [Google Scholar]
- 12.Fónyad L, Krenács T, Nagy P, Zalatnai A, Csomor J, Sápi Z, et al. Validation of diagnostic accuracy using digital slides in routine histopathology. Diagn Pathol. 2012;7:35. doi: 10.1186/1746-1596-7-35. [DOI] [PMC free article] [PubMed] [Google Scholar]
- 13.Gilbertson JR, Ho J, Anthony L, Jukic DM, Yagi Y, Parwani AV. Primary histologic diagnosis using automated whole slide imaging: A validation study. BMC Clin Pathol. 2006;6:4. doi: 10.1186/1472-6890-6-4. [DOI] [PMC free article] [PubMed] [Google Scholar]
- 14.Krishnamurthy S, Mathews K, McClure S, Murray M, Gilcrease M, Albarracin C, et al. Multi-institutional comparison of whole slide digital imaging and optical microscopy for interpretation of hematoxylin-eosin-stained breast tissue sections. Arch Pathol Lab Med. 2013;137:1733–9. doi: 10.5858/arpa.2012-0437-OA. [DOI] [PubMed] [Google Scholar]
- 15.Mukhopadhyay S, Feldman MD, Abels E, Ashfaq R, Beltaifa S, Cacciabeve NG, et al. Whole slide imaging versus microscopy for primary diagnosis in surgical pathology: A multicenter blinded randomized noninferiority study of 1992 cases (pivotal study) Am J Surg Pathol. 2018;42:39–52. doi: 10.1097/PAS.0000000000000948. [DOI] [PMC free article] [PubMed] [Google Scholar]
- 16.Pires A, Amado C. Interval estimates for a binomial proportion: Comparison of twenty methods. Revstat Stat J. 2008;6:165–97. [Google Scholar]
- 17.Allsbrook WC, Jr, Mangold KA, Johnson MH, Lane RB, Lane CG, Epstein JI. Interobserver reproducibility of Gleason grading of prostatic carcinoma: General pathologist. Hum Pathol. 2001;32:81–8. doi: 10.1053/hupa.2001.21135. [DOI] [PubMed] [Google Scholar]
- 18.Barker B, Garcia FA, Warner J, Lozerski J, Hatch K. Baseline inaccuracy rates for the comparison of cervical biopsy to loop electrosurgical excision histopathologic diagnoses. Am J Obstet Gynecol. 2002;187:349–52. doi: 10.1067/mob.2002.123199. [DOI] [PubMed] [Google Scholar]
- 19.Coblentz TR, Mills SE, Theodorescu D. Impact of second opinion pathology in the definitive management of patients with bladder carcinoma. Cancer. 2001;91:1284–90. [PubMed] [Google Scholar]
- 20.Elsheikh TM, Asa SL, Chan JK, DeLellis RA, Heffess CS, LiVolsi VA, et al. Interobserver and intraobserver variation among experts in the diagnosis of thyroid follicular lesions with borderline nuclear features of papillary carcinoma. Am J Clin Pathol. 2008;130:736–44. doi: 10.1309/AJCPKP2QUVN4RCCP. [DOI] [PubMed] [Google Scholar]
- 21.McKenney JK, Simko J, Bonham M, True LD, Troyer D, Hawley S, et al. The potential impact of reproducibility of Gleason grading in men with early stage prostate cancer managed by active surveillance: A multi-institutional study. J Urol. 2011;186:465–9. doi: 10.1016/j.juro.2011.03.115. [DOI] [PubMed] [Google Scholar]
- 22.Bernardo V, Lourenço SQ, Cruz R, Monteiro-Leal LH, Silva LE, Camisasca DR, et al. Reproducibility of immunostaining quantification and description of a new digital image processing procedure for quantitative evaluation of immunohistochemistry in pathology. Microsc Microanal. 2009;15:353–65. doi: 10.1017/S1431927609090710. [DOI] [PubMed] [Google Scholar]
- 23.Della Mea V, Demichelis F, Viel F, Dalla Palma P, Beltrami CA. User attitudes in analyzing digital slides in a quality control test bed: A preliminary study. Comput Methods Programs Biomed. 2006;82:177–86. doi: 10.1016/j.cmpb.2006.02.011. [DOI] [PubMed] [Google Scholar]
- 24.Dunn BE, Choi H, Almagro UA, Recla DL. Combined robotic and nonrobotic telepathology as an integral service component of a geographically dispersed laboratory network. Hum Pathol. 2001;32:1300–3. doi: 10.1053/hupa.2001.29644. [DOI] [PubMed] [Google Scholar]
- 25.Weinstein RS, Descour MR, Liang C, Barker G, Scott KM, Richter L, et al. An array microscope for ultrarapid virtual slide processing and telepathology.Design, fabrication, and validation study. Hum Pathol. 2004;35:1303–14. doi: 10.1016/j.humpath.2004.09.002. [DOI] [PubMed] [Google Scholar]
- 26.Keay T, Conway CM, O’Flaherty N, Hewitt SM, Shea K, Gavrielides MA. Reproducibility in the automated quantitative assessment of HER2/neu for breast cancer. J Pathol Inform. 2013;4:19. doi: 10.4103/2153-3539.115879. [DOI] [PMC free article] [PubMed] [Google Scholar]


