Graphical Abstract
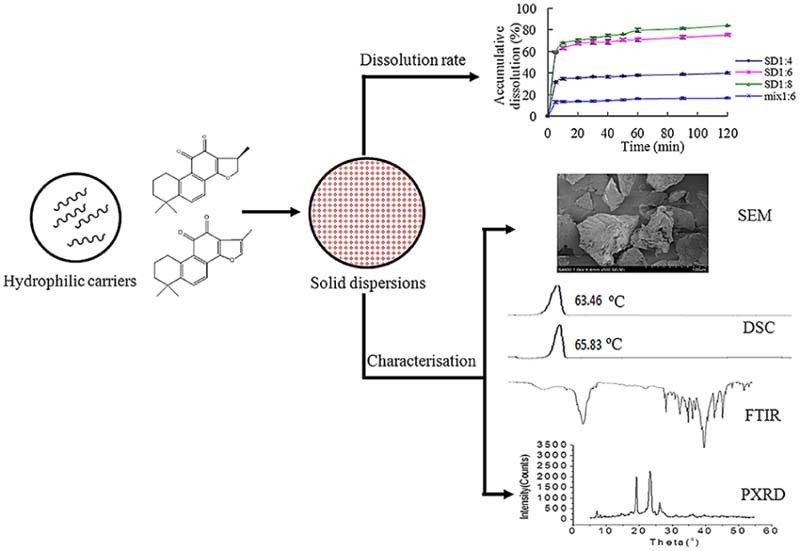
Tanshinone IIA, cryptotanshinone and total tanshinone solid dispersions were prepared by using three hydrophilic carriers including PEG 6000, poloxamer 188 and PVP K30 at different ratios, respectively. The solid dispersions were systematically evaluated by determination of solubility and dissolution rate of tanshinone IIA and cryptotanshinone, and characterised by SEM, DSC, FTIR and powder X-ray diffraction. The solubility and dissolution rate of tanshinone IIA and cryptotanshinone were significantly increased in all solid dispersions. The results indicate that the superior carrier for preparation of tanshinone IIA and total tanshinones solid dispersions is poloxamer 188, and that for cryptotanshinone is PVP K30.
Keywords: Cryptotanshinone, Tanshinone IIA, Total tanshinones, Solid dispersion, Dissolution rate
Abstract
Total tanshinones are lipophilic active constituents extracted from Salvia miltiorrhiza Bge. Tanshinone IIA and cryptotanshinone are the major components in total tanshinones. However, the bioavailability of both compounds is low due to poor water solubility. To enhance the solubility and dissolution rate of tanshinone IIA, cryptotanshinone and total tanshinones, three common used hydrophilic carriers including PEG 6000, poloxamer 188 and PVP K30 were used to prepare the solid dispersions at different ratios, respectively. The solid dispersions were characterised by scanning electron microscopy (SEM), differential scanning calorimetry (DSC) and Fourier transform infrared spectroscopy (FTIR). The results of powder X-ray diffraction confirmed the microcrystal state of total tanshinones in solid dispersions and no chemical interaction between total tanshinones and carriers was observed in FTIR spectra. The solubility and dissolution rate of tanshinone IIA and cryptotanshinone were significantly increased in all solid dispersions. Regarding tanshinone IIA, the solubility and dissolution rate of in solid dispersions prepared with poloxamer 188 were significantly higher than that with PEG 6000 and PVP K30. The higher solubility and dissolution rate of cryptotanshinone were obtained in solid dispersion of PVP K30 than that of PEG 6000 solid dispersions but no significant difference from poloxamer 188 solid dispersions. The results indicate that the superior carrier for preparation of tanshinone IIA and total tanshinones solid dispersions is poloxamer 188, and that for cryptotanshinone is PVP K30.
1. Introduction
Tanshinones, the lipophilic active constituents of Salvia miltiorrhiza Bge., have been extensively used as traditional Chinese medicine (TCM) for treating cardiovascular conditions [1], including coronary disease, angina pectoris, cerebral haemorrhage, diabetes mellitus, as well as some infectious diseases [2]. Tanshinones have also been shown to be effective in reducing brain injury induced by middle cerebral artery occlusion in animals [3], [4]. More recently, some studies have reported that tanshinones are also active against a variety of human cancer cell lines [5], [6], [7], [8], [9], [10], [11], [12], indicating its benefits to the cancer therapy.
Dosage forms of tanshinones are primarily tablets and capsules, which have been prepared and are commercially available in China. Total tanshinones mainly consist of tanshinone IIA, IIB, cryptotanshinone (CT) and tanshinone I [13]. The chemical structures of tanshinone IIA and cryptotanshinone were shown in Fig. 1. Natural tanshinones have proved to have poor bioavailability due to their poor water solubility, insufficient dissolution rates [14] and first pass metabolism [15]. For example, the p.o. and i.p. bioavailabilities of CT in rats were estimated as 2.1% and 10.6% respectively when CT was dosed at 100 mg/kg of body weight [16]. The oral bioavailability of tanshinone IIA was also extremely low with an absolute bioavailability below 3.5% [17]. The maximum plasma concentration of CT and tanshinone IIA was below 20 ng/ml [18]. Thus, improving the solubility and dissolution rate of tanshinones are important in the formulation design of tanshinone. For this, a water soluble tanshinone IIA derivative, sodium tanshinone IIA sulphonate (sodium tanshinone IIA sulphonate injection), has been used clinically for treating cardiovascular diseases for more than 30 years in China [19]. However, the intrinsic anti-tumour activities of tanshinone IIA might be eliminated due to the structure modification, while the curative effects on cardiovascular disorders still remain [9]. Therefore, it is very meaningful to explore a technology without chemical structural modifications to enhance the bioavailability of tanshinones.
Fig. 1.
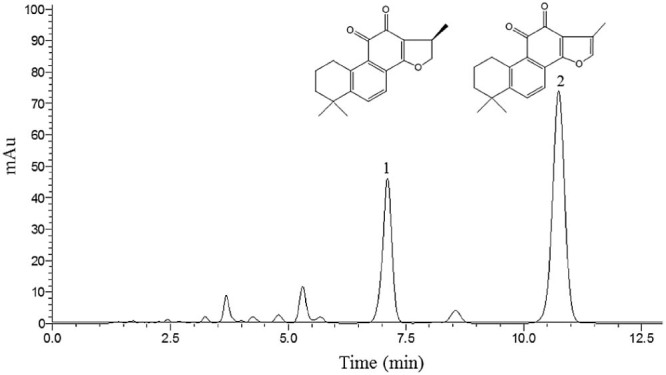
HPLC chromatogram of total tanshinones. Conditions: Column: Welchrom C18 (150 mm × 4.6 mm, 5 µm); mobile phase: methanol and water (80:20 v/v); column temperature: 30 °C; flow rate: 1.0 ml/min, detection wavelength: 270 nm.
Currently, numerous pharmaceutical strategies have been employed to overcome the poor dissolution rate of tanshinones such as solid lipid nanoparticles [20], tanshinone IIA inclusion compound with HP-β-CD [21], pulsatile release pellet [22], intravenous lipid emulsion [9] and microemulsion [23]. It is noteworthy that solid dispersion (SD) has demonstrated as a highly effective strategy to improve the dissolution rate and the bioavailability of poorly soluble drugs [24]. Solid dispersion consists of at least two different components, generally a hydrophilic matrix and a hydrophobic drug. The enhanced dissolution rate of drugs from solid dispersions may be relative to four different mechanisms, that is reduced particle size (molecular or microcrystalline dispersions), improved wettability, increased porosity or present in amorphous state by dispersing drugs into inert hydrophilic carriers in the solid state [25], [26]. However, solid dispersion of tanshinones has not been fully elucidated so far.
Various hydrophilic carriers, such as polyethylene glycols (PEG), polyvinylpyrrolidone (PVP), hydroxypropyl methylcellulose (HPMC), poloxamers, gums, sugar, mannitol, and urea, have been used in solid dispersion for improving dissolution characteristics and bioavailability of poorly aqueous-soluble drugs [27]. Among them, PEG, poloxamers and PVP are the commonly used hydrophilic carriers. PVP based SD is usually prepared by solvent evaporation method because of its higher melting point (130 °C). While poloxamer 188 and PEG 6000 based SD can be prepared by a melting method due to their lower melting point (52–57 °C, 65 °C) [28].
Recently tanshinone IIA-poloxamer 188 solid dispersion has been reported, and improved solubility and dissolution rate of tanshinone IIA were achieved [28]. However, it is not clear as to what extent of different hydrophilic carriers affects the solubility and dissolution characteristics of tanshinone IIA, especially total tanshinones. Therefore, this study was designed to investigate the effects of PEG 6000, poloxamer 188 and PVP K30 on the solubility and dissolution rate of key constituents of tanshinone IIA and CT in total tanshinones in various SDs and their physicochemical properties. Pure tanshinone IIA and CT were also studied and compared with the total tanshinones in the same conditions.
2. Material and methods
2.1. Materials
The following materials were commercially purchased: Tanshinone IIA and cryptotanshinone reference standard (National Institute for Food and Drug Control, China, purity ≥ 99%). Poloxamer 188 (Pharmaceutical Factory of Shenyang Pharmaceutical University, China), Polyethylene glycol 6000 (PEG 6000) (Tanjin Binhai Chemical Factory, China), Polyvinylpyrrolidone K30 (PVP K30) (Shanghai Lanji Technology Development Co., Ltd, China). Bulk powders of total tanshinones (purity > 90%, the content of tanshinone IIA and cryptotanshinone were 298.79 mg/g and 196.47 mg/g, respectively by HPLC), pure tanshinone IIA (purity ≥ 98%) and pure cryptotanshinone (purity ≥ 98%) were purchased from Xi'an Haoxuan Biological Technology Co., Ltd. All solvents were of chromatographic grade or analytical grade. Deionised water was purified by a Milli-Q water purification system.
2.2. Preparation of solid dispersions and physical mixtures
2.2.1. Physical mixtures
Physical mixtures of tanshinone IIA, CT and total tanshinones were prepared by mixing the compounds with poloxamer 188, PEG 6000 and PVP K30 at ratio of 1:6 (w/w), respectively. After thoroughly mixing, the powders were passed through a 60 mesh sieve for further experiments.
2.2.2. Solid dispersions
SDs of tanshinone IIA, CT and total tanshinones were prepared with poloxamer 188, PEG 6000 and PVP K30 respectively, at three different ratios (1:4, 1:6, 1:8 w/w). Briefly, poloxamer 188 or PEG 6000 was put into an evaporating dish and stirred on a water bath (70 °C), then tanshinone IIA, CT and total tanshinones powder were added respectively and mixed well. The evaporating dishes were put into a −20 °C fridge for 1 h. The solidified mass was then ground with a mortar and pestle into powder and passed through a 60 mesh sieve. For PVP K30 SDs, PVP K30 was first mixed with tanshinone IIA, CT or total tanshinones separately, and then dissolved with absolute ethanol. The ethanol was evaporated on a 60 °C water bath. The solidified mass was placed in a 40 °C drying oven for 24 h, then ground into powder and passed through a 60 mesh sieve. The obtained SDs were stored in a desiccator for further experiments.
2.3. HPLC analysis of tanshinone IIA and cryptotanshinone
The concentration of tanshinone IIA and cryptotanshinone in the testing medium was determined using a Shimadzu LC-2010AHT liquid chromatographic system (Shimadzu Corp, Japan) under the following conditions: Welchrom C18 (150 mm × 4.6 mm, 5 µm) column and a Phenomenex C18 guard column, methanol and water (80:20 v/v) as mobile phase at a flow rate of 1.0 ml/min, UV detection at 270 nm.
2.3.1. Linearity determination
Accurately weighed reference compounds tanshinone IIA and CT were dissolved in methanol to produce 50 µg/ml solutions respectively, as standard solutions, and were stored in a fridge (4 °C) for further use. The standard solutions were diluted with methanol to produce solutions containing tanshinone IIA and CT 1 µg/ml, 2 µg/ml, 5 µg/ml, 10 µg/ml, 20 µg/ml, 30 µg/ml, 40 µg/ml and 50 µg/ml, respectively. 10 µl of the above solutions were injected into column for HPLC analysis. The regression equations were calculated in the form of Y = aX + b, where Y is peak area and X is compound amount determined.
2.3.2. Precision and repeatability
The precision and repeatability were determined by analysing the same mixed standard solution in methanol for 6 times within one day (0, 2, 4, 6, 10, 24 h). The RSD% of peak areas was taken as the measures of precision and repeatability.
2.3.3. Recovery
Recovery test was conducted to evaluate accuracy of the HPLC method. Approximate amounts of total tanshinones solid dispersions (with poloxamer 188, PEG 6000 and PVP K30 at the ratio of 1:6 w/w, equivalent to total tanshinones 3 mg) were dissolved with methanol in a 10 ml volumetric flask by ultrasonication for 10 min. The samples were then replenished with methanol to the volume. 1 ml of the solution was spiked with 1 ml of the standard reference solution and mixed well. The mixtures were injected (5 µl) into column for HPLC analysis. The average recoveries were determined by the following formula: recovery (%) = (amount found − original amount)/amount spiked × 100%, and RSD (%) = (SD/mean) × 100%.
2.4. Determination of solubility
The solubility of SDs, physical mixtures and raw material of tanshinone IIA, CT and total tanshinones were determined by adding appropriate amounts of each compound(s) to test tubes containing 5 ml of degassed water. The sealed test tubes were shaken at 25 °C for 24 h, and then centrifuged at 3750 rpm for 15 min. The supernatant was filtered with 0.25 µm millipore filter and the amount of relevant compound(s) in the filtrate was determined by HPLC.
2.5. Determination of dissolution rate
Dissolution rate of samples of SD and physical mixture was performed by an intellective dissolution apparatus (D-800LS, Tianda Tianfa Technology Co. Ltd, Tianjin, China). Samples (equivalent to pure tanshinone IIA and CT 5 mg, tanshinone IIA 7.5 mg and CT 5 mg in total tanshinones) were suspended in 900 ml of degassed deionised water at 37 ± 0.5 °C. Paddle method was employed at a rotation speed of 100 rpm according to Chinese Pharmacopoeia 2010 edition. 2 ml of the samples were withdrawn at 5, 10, 20, 30, 40, 50, 60, 90, and 120 min and equal volumes of degassed deionised water were replenished into the dissolution cup after each sample was taken. The sample solutions were filtered through a 0.45 µm millipore filter, the initial sample volume (0.5 ml) was discarded and final 1.5 ml was collected and analysed by HPLC.
2.6. Characterisation of solid dispersions
2.6.1. Scanning electron microscopy
The surface morphology of tanshinone IIA, CT, total tanshinones, three hydrophilic carriers, SDs and the relevant physical mixtures were examined by scanning electron microscope (S-4800, Hitachi, Japan) at 1.0 kV. The samples were fixed on double-sided adhesive tape and made electrically conductive by sputter-coating with gold using Hitachi Ion Sputter (E-1045, Hitachi, Japan) in a vacuum (6 Pa) for 1 minute at 15 mA. Scanning electron microscopy (SEM) images were taken to show the appearance of the entire sample.
2.6.2. Differential scanning calorimetry
The differential scanning calorimetry (DSC) thermal traces were examined by a differential scanning calorimeter (PYRIS Diamond DSC, Perkin-Elmer Company, USA). The samples were encapsulated in aluminium crucible and heated at a rate of 20 °C/min from 45 °C to 260 °C. The empty aluminium crucible was used as reference. The flow rate of nitrogen gas was set at 20 ml/min during the whole study.
2.6.3. Fourier transform infrared spectroscopy analysis
Fourier transform infrared spectroscopy (FTIR) spectra were obtained by FTIR spectrometer (BRUKER TENSOR27, Germany). The samples were mixed thoroughly with potassium bromide at 1:100 (sample: potassium bromide) weight ratio. After being ground, the powders were pressed at 10 MPa for 1 min in a hydraulic press to prepare potassium bromide discs. Scans were obtained at a resolution of 4/cm from 4000 to 400/cm. All the studies were performed in triplicate.
2.6.4. Powder X-ray diffraction
Powder X-ray diffraction (PXRD) was performed on a D/max 3C X-ray diffractometer (Rigaku, Japan). Data were collected using Ni filtered, CuKα radiation at a voltage of 35 kV and a 35 mA current. The scanning rate was 1°/min over the 5 to 55° diffraction angle (2θ) range.
3. Results and discussion
3.1. HPLC analysis of tanshinone IIA and cryptotanshinone
The HPLC method used in this study showed an excellent linearity with the regression equations of tanshinone IIA and CT, which were y = 9859.8x − 61239 (r2 = 0.9997) and, y = 6761.1x − 38829 (r2 = 0.9997) respectively, within the range of 20–750 ng. The precision and repeatability of the assay are satisfactory with RSD% of tanshinone IIA 0.36% and CT 0.58%. The results of recovery test in three hydrophilic carriers were showed in Table 1.
Table 1.
Recovery of tanshinone IIA and cryptotanshinone in three hydrophilic carriers.
| Analyte | PEG 6000 | Poloxamer 188 | PVP K30 | |||
|---|---|---|---|---|---|---|
| Recovery (%) | RSD% | Recovery (%) | RSD% | Recovery (%) | RSD% | |
| Tanshinone IIA | 96.23 | 1.86 | 102.61 | 1.73 | 97.27 | 1.31 |
| Cryptotanshinone | 101.83 | 1.06 | 96.88 | 1.97 | 103.87 | 0.98 |
3.2. The solubility of tanshinone IIA and cryptotanshinone in different solid dispersions, physical mixtures and raw materials
The solubility of tanshinone IIA and CT in different SDs, physical mixtures (mix 1:6), and raw materials in degassed water was shown in Table 2. In all prepared solid dispersions, the solubilities of tanshinone IIA and CT were increased with higher ratios (w/w) of hydrophilic carriers (1:8 > 1:6 > 1:4). The solubility of physical mixtures was much less than that of solid dispersions, but still greater than relevant raw materials. Among three carriers, Poloxamer 188 was most effective in enhancing the solubility of tanshinone IIA in both tanshinone IIA and total tanshinones SDs. The solubility of tanshinone IIA in Poloxamer 188 SDs was maximum enhanced 544-fold compared to the pure drug. However, CT was most effectively enhanced by both Poloxamer 188 and PVP K30. The solubility of CT in Poloxamer 188 and PVP K30 SDs was enhanced to maximum 108-fold and 107-fold compared to the pure drug respectively. The results also indicated that the solubility of tanshinone IIA and CT from total tanshinone SDs was higher than that from pure compound SDs.
Table 2.
The solubility of tanshinone IIA and cryptotanshinone in solid dispersions, physical mixtures and raw materials (n = 3).
| Sample | Solubility (µg/ml) | ||||
|---|---|---|---|---|---|
| Hydrophilic carrier | Ratio (w/w) | Tanshinone IIA | Cryptotanshinone | Total tanshinones | |
| Tanshinone IIA | Cryptotanshinone | ||||
| PEG 6000 | SD1:8 | 5.75 ± 0.020 | 6.52 ± 0.059 | 29.64 ± 0.098 | 13.15 ± 0.031 |
| SD1:6 | 1.13 ± 0.057 | 4.39 ± 0.033 | 9.96 ± 0.087 | 5.69 ± 0.057 | |
| SD1:4 | 0.40 ± 0.006 | 1.64 ± 0.012 | 3.46 ± 0.049 | 3.01 ± 0.031 | |
| Mix 1:6 | 0.21 ± 0.005 | 1.10 ± 0.035 | 1.54 ± 0.013 | 0.83 ± 0.001 | |
| Poloxamer 188 | SD1:8 | 81.59 ± 0.022 | 18.97 ± 0.109 | 101.96 ± 0.083 | 37.03 ± 0.082 |
| SD1:6 | 49.00 ± 0.054 | 15.28 ± 0.045 | 54.74 ± 0.094 | 29.05 ± 0.088 | |
| SD1:4 | 18.95 ± 0.082 | 9.34 ± 0.053 | 28.51 ± 0.068 | 13.10 ± 0.063 | |
| Mix 1:6 | 1.58 ± 0.042 | 3.88 ± 0.075 | 25.10 ± 0.040 | 5.73 ± 0.057 | |
| PVP K30 | SD1:8 | 1.82 ± 0.039 | 17.60 ± 0.080 | 20.33 ± 0.078 | 37.40 ± 0.082 |
| SD1:6 | 0.60 ± 0.002 | 10.51 ± 0.074 | 16.19 ± 0.095 | 32.44 ± 0.049 | |
| SD1:4 | 0.34 ± 0.005 | 8.91 ± 0.033 | 14.14 ± 0.038 | 30.74 ± 0.094 | |
| Mix 1:6 | 0.26 ± 0.002 | 4.95 ± 0.015 | 6.52 ± 0.040 | 5.20 ± 0.019 | |
| Raw material | 0.15 ± 0.002 | 0.26 ± 0.012 | 0.87 ± 0.009 | 0.35 ± 0.004 | |
3.3. The dissolution rate of tanshinone IIA and cryptotanshinone in different solid dispersions and physical mixtures
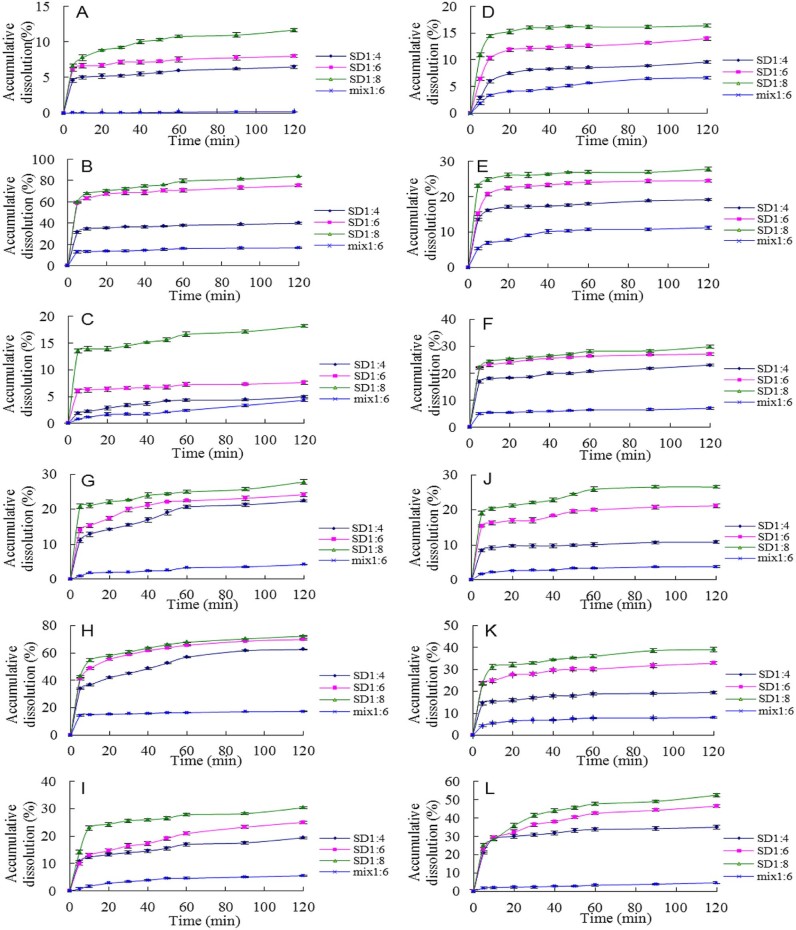
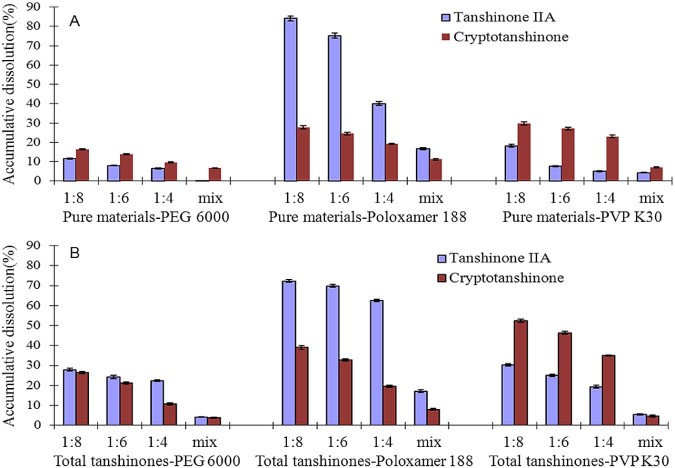
The dissolution curves of different SDs and relevant physical mixtures were shown in Fig. 2. Cumulative release of tanshinone IIA and CT from SDs and physical mixtures during 120 min dissolution tests were shown in Fig. 3. The dissolution rate was plotted as the percentage of accumulative dissolution of solutes in dissolution medium from the SDs and physical mixtures. The dissolution rates of tanshinone IIA and CT were significantly increased with the higher ratio of hydrophilic carries in all three carriers SDs. The order of ratio is 1:8 > 1:6 > 1:4 (w/w). The dissolution rate in SDs was also significantly greater than that of the corresponding physical mixtures. Similar results for tanshinone IIA-poloxamer SD have been obtained in another study [28].
Fig. 2.
Dissolution profiles of tanshinone IIA and cryptotanshinone from solid dispersions (1:4, 1:6, 1:8 w/w) and physical mixtures (mix 1:6 w/w) of tanshinone IIA and cryptotanshinone. (A) Tanshinone IIA-PEG 6000 solid dispersions and mixture, (B) tanshinone IIA-poloxamer 188 solid dispersions and mixture, (C) tanshinone IIA-PVP K30 solid dispersions and mixture, (D) cryptotanshinone-PEG 6000 solid dispersions and mixture, (E) cryptotanshinone-poloxamer 188 solid dispersions and mixture, (F) cryptotanshinone-PVP K30 solid dispersions and mixture, (G) tanshinone IIA from total tanshinones-PEG 6000 solid dispersions and mixture, (H) tanshinone IIA from total tanshinones-poloxamer 188 solid dispersions and mixture, (I) tanshinone IIA from total tanshinones-PVP K30 solid dispersions and mixture, (J) cryptotanshinone from total tanshinones-PEG 6000 solid dispersions and mixture, (K) cryptotanshinone from total tanshinones-poloxamer 188 solid dispersions and mixture, (L) cryptotanshinone from total tanshinones-PVP K30 solid dispersions and mixture.
Fig. 3.
Cumulative release of tanshinone IIA and cryptotanshinone from solid dispersions and physic mixtures during 120 min dissolution test. (A) Tanshinone IIA and cryptotanshinone solid dispersions, (B) total tanshinones solid dispersions.
The dissolution rate of tanshinone IIA from the tanshinone IIA-poloxamer 188 solid dispersions and total tanshinones-poloxamer 188 SDs was faster than that of PEG 6000 and PVP K30 SDs. On the other hand, the dissolution rate of CT from CT-PVP K30 and total tanshinones-PVP K30 SDs was great and faster than that of PEG 6000 SDs, but no significant difference was found with relevant poloxamer 188 solid dispersions. Combining the results of cumulative release of tanshinone IIA and CT from SDs and physical mixtures during 120 min dissolution test periods (Fig. 3) and solubility of solid dispersions, poloxamer 188 exhibited a significantly higher release of tanshinone IIA from tanshinone IIA and total tanshinones SDs, while PVP K30 exhibited a significantly higher release of CT from CT and total tanshinones SDs. Thus, poloxamer 188 seems to be the best carrier for preparation of tanshinone IIA and total tanshinones SDs, and PVP K30 seems to be the best carrier for CT SD. In overall consideration, poloxamer 188 would be the best carrier for total tanshinones SD.
Poloxamer 188 is a kind of nonionic surfactant. The significantly increased solubility and dissolution rate of tanshinone IIA and CT in Poloxamer 188 SDs may be relative to its wettability, emulsification and solubilisation effects.
3.4. Scanning electron microscopy
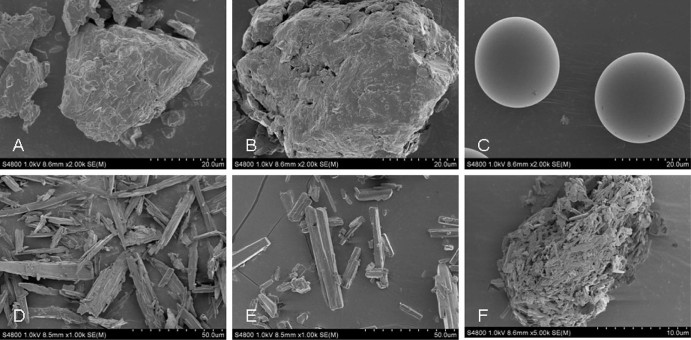
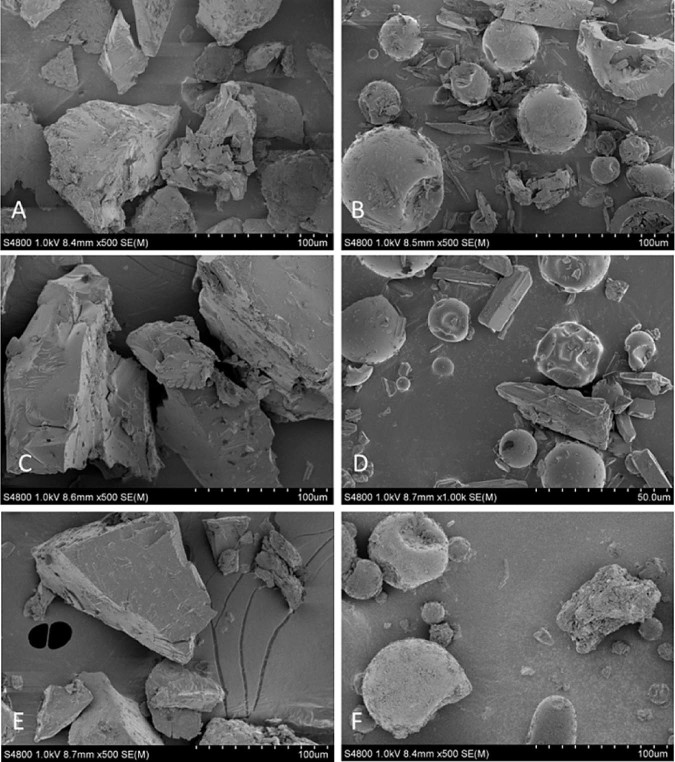
The scanning electron microscopy (SEM) images of raw materials of tanshinone IIA, CT, total tanshinones, PEG 6000, poloxamer 188 and PVP K30 were shown in Fig. 4. The crystal morphology of pure tanshinone IIA was an acicular crystal, CT was a columnar crystal and total tanshinones was a crumb composed of small columnar crystals. PEG 6000 and poloxamer 188 powder had an irregular shape. PVP K30 was a ball with a smooth surface.
Fig. 4.
Scanning electron microphotographs of raw materials (magnification 1k–5k). (A) PEG 6000, (B) poloxamer 188, (C) PVP K30, (D) tanshinone IIA, (E) cryptotanshinone, (F) total tanshinones.
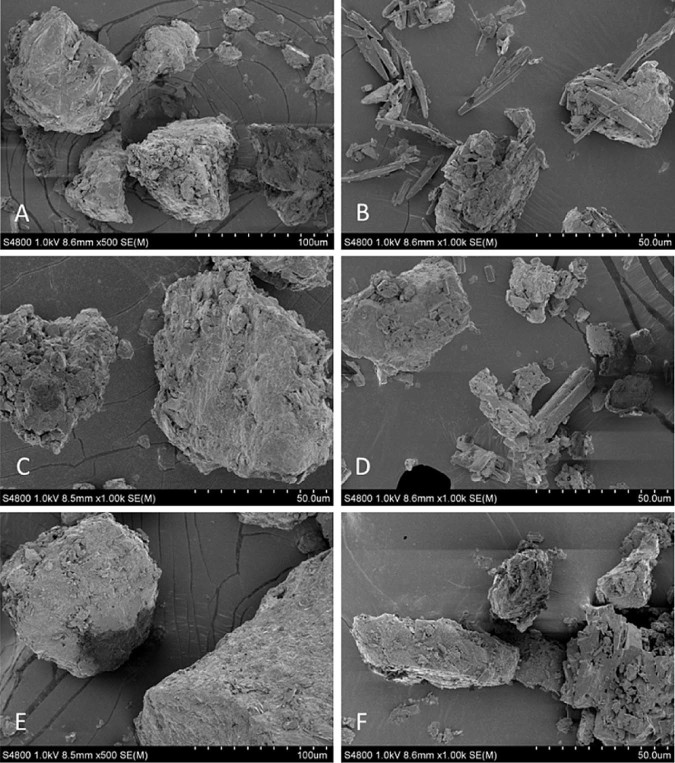
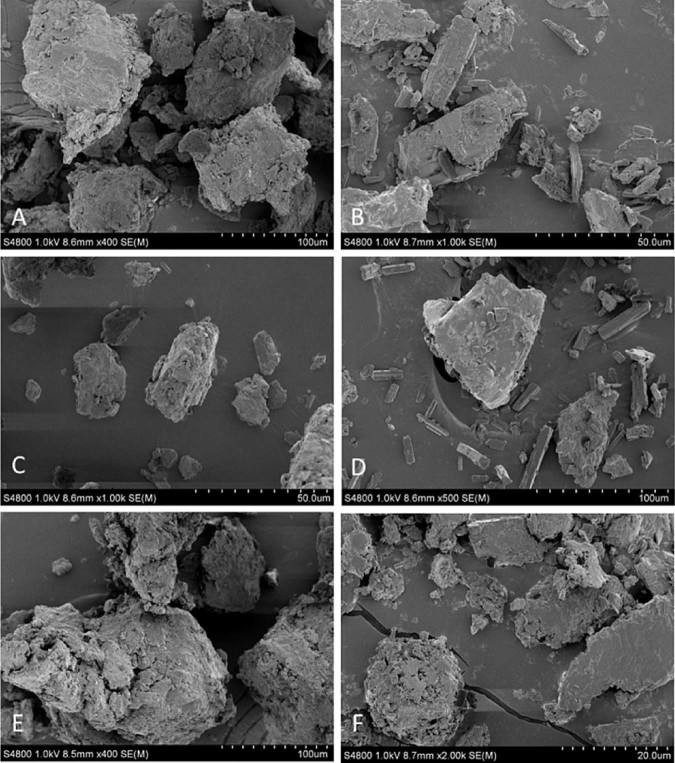
The scanning electron microphotographs of physical mixtures and SDs were shown in Figs. 5–7. Morphology of the physical mixtures clearly indicated that the crystals of tanshinone IIA, CT and total tanshinones were mixed with PEG 6000, poloxamer 188, PVP K30 particles or adhered to their surface (Fig. 5B, D, F; Fig. 6B, D, F and Fig. 7B, D, F). The results confirmed the presence of crystalline tanshinone IIA, CT and total tanshinones in physical mixtures. In contrast, the crystals of tanshinone IIA, CT and total tanshinones were invisible in SDs under the same condition. The SDs appeared in the form of irregular particles (Fig. 5A, C, E; Fig. 6A, C, E and Fig. 7A, C, E). The results demonstrated that tanshinone IIA, CT and total tanshinones possibly dispersed in solid dispersions in molecular, amorphous or microcrystal form.
Fig. 5.
Scanning electron microphotographs of solid dispersions and physical mixtures with PEG 6000 as carrier (1:6 w/w). (A) Tanshinone IIA-PEG 6000 solid dispersion, (B) tanshinone IIA-PEG 6000 physical mixture, (C) cryptotanshinone-PEG 6000 solid dispersion, (D) cryptotanshinone-PEG 6000 physical mixture, (E) total tanshinones-PEG 6000 solid dispersion, (F) total tanshinones-PEG 6000 physical mixture.
Fig. 7.
Scanning electron microphotographs of solid dispersions and physical mixtures with PVP K30 as carrier (1:6 w/w). (A) Tanshinone IIA-PVP K30 solid dispersion, (B) tanshinone IIA-PVP K30 physical mixture, (C) cryptotanshinone-PVP K30 solid dispersion, (D) cryptotanshinone-PVP K30 physical mixture, (E) total tanshinones-PVP K30 solid dispersion, (F) total tanshinones-PVP K30 physical mixture.
Fig. 6.
Scanning electron microphotographs of solid dispersions and physical mixtures with poloxamer 188 as carrier (1:6 w/w). (A) Tanshinone IIA-poloxamer 188 solid dispersion, (B) tanshinone IIA-poloxamer 188 physical mixture, (C) cryptotanshinone-poloxamer 188 solid dispersion, (D) cryptotanshinone-poloxamer 188 physical mixture, (E) total tanshinones-poloxamer 188 solid dispersion, (F) total tanshinones-poloxamer 188 physical mixture.
3.5. Differential scanning calorimetry
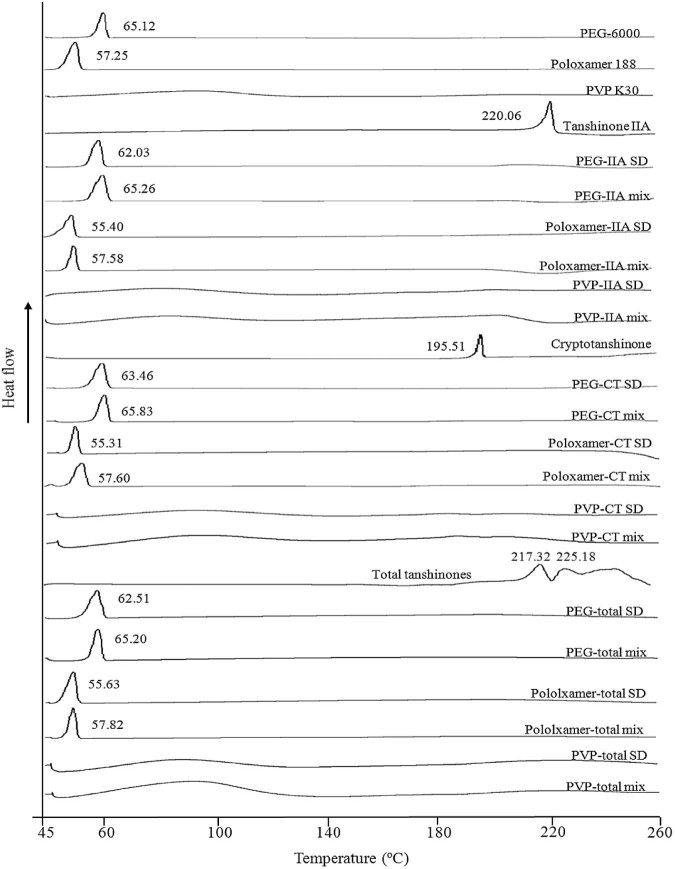
Fig. 8 represents the DSC thermograms of PEG 6000, poloxamer 188, PVP K30, tanshinone IIA, CT, total tanshinones and their SDs and physical mixtures (1:6 w/w). The thermograms revealed the single endothermic peaks of tanshinone IIA, PEG 6000 and poloxamer 188 at 220.16 °C, 65.12 °C and 57.24 °C, respectively. The heating scans for solid dispersions of PEG 600-tanshinone IIA and poloxamer 188-tanshinone IIA showed melting peak at 62.03 °C and 55.40 °C with no endothermic peak corresponding to tanshinone IIA. Similarly, physical mixtures of PEG 6000-tanshinone IIA and poloxamer 188-tanshinone IIA showed melting peak at 65.10 °C and 57.18 °C with no endothermic peak corresponding to tanshinone IIA.
Fig. 8.
DSC thermograms of raw materials, solid dispersions and physical mixtures (1:6 w/w). From the bottom: PVP K30-total tanshinones physical mixture (PVP-total mix), PVP K30-total tanshinones solid dispersion (PVP-total SD), poloxamer 188-total tanshinones physical mixture (poloxamer-total mix), poloxamer 188-total tanshinones solid dispersion (poloxamer-total SD), PEG 6000-total tanshinones mixture (PEG-total mix), PEG 6000-total tanshinones solid dispersion (PEG-total SD), total tanshinones, PVP K30-cryptotanshinone physical mixture (PVP-CT mix), PVP K30-cryptotanshinone solid dispersion (PVP-CT SD), poloxamer 188-cryptotanshinone physical mixture (poloxamer-CT mix), poloxamer 188- cryptotanshinone solid dispersion (poloxamer-CT SD), PEG 6000-cryptotanshinone mixture (PEG-CT mix), PEG 6000-cryptotanshinone solid dispersions (PEG-CT SD), pure cryptotanshinone (cryptotanshinone, PVP K30-tanshinone IIA physical mixture (PVP-IIA mix), PVP K30-tanshinone IIA solid dispersion (PVP-IIA SD), poloxamer 188-tanshinone IIA physical mixture (poloxamer-IIA mix), poloxamer 188-tanshinone IIA solid dispersion (poloxamer-IIA SD), PEG 6000-tanshinone IIA mixture (PEG-IIA mix), PEG 6000-tanshinone IIA solid dispersion (PEG-IIA SD), pure tanshinone IIA (Tanshinone IIA), PVP K30, poloxamer 188 and PEG 6000.
It is noticed that the endothermic peaks in solid dispersions of PEG 6000-tanshinone IIA and poloxamer 188-tanshinone IIA were altered from 65.12 °C and 57.24 °C to 62.03 °C and 55.40 °C, respectively. These may be due to the formation of eutectic mixtures in SDs leading to the depression of melting point. However, in physical mixtures of PEG 6000-tanshinone IIA and poloxamer 188-tanshinone IIA, the endothermic peaks of carriers remained the same as pure PEG-6000 and poloxamer 188. These unchanged endothermic peaks for carriers and disappeared peaks of tanshinone IIA in physical mixtures revealed that the drug substance was slowly dissolved in molten PEG 6000 and poloxamer 188 during the rising of temperature.
As an amorphous polymer, PVP K30 did not show any fusion peak or phase transition, apart from a broad endothermic peak, as a result of dehydration, which lies between 80 °C and 120 °C [29]. In addition, it is difficult to discern the endothermic peak of tanshinone IIA in physical mixture and SDs of the PVP K30. Similar results were observed in CT, total tanshinones SDs and the corresponding physical mixtures using PVP K30 as carrier.
3.6. Fourier transform infrared spectroscopy
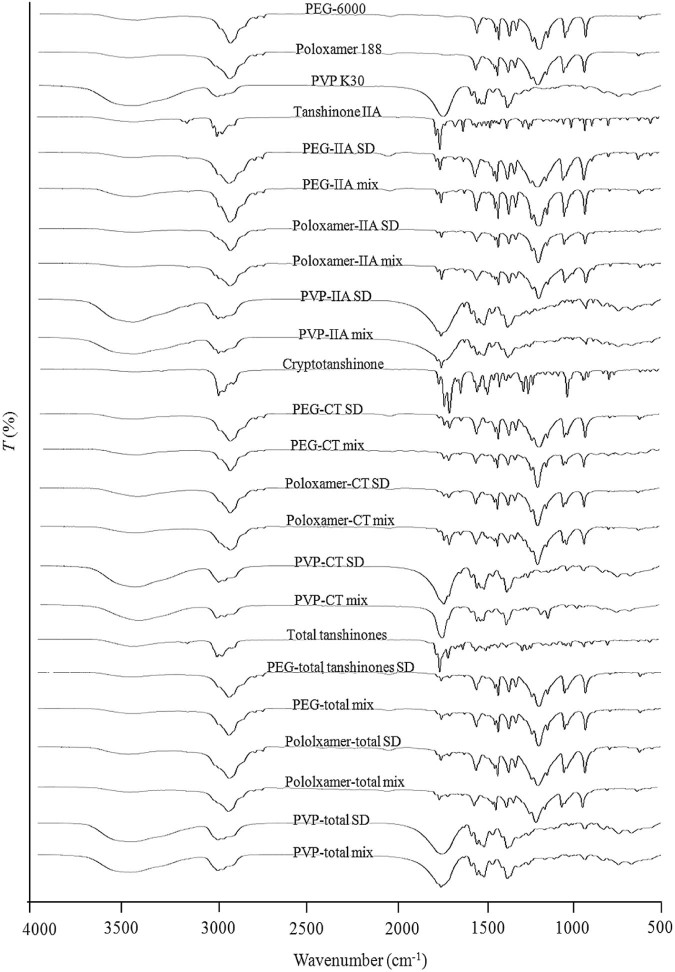
In order to characterise interactions between the drugs and carriers, infrared spectra were recorded. The FTIR spectrum of pure tanshinone IIA, CT, total tanshinones, polymer alone, SDs and physical mixtures were investigated (Fig. 9). The FTIR spectra of SDs and the corresponding physical mixture were the superposition of spectra of the individual components. Analysis of the spectra for both SDs as well as the physical mixtures did not demonstrate any changes for the specific absorption bands for the polymers or the drugs, suggesting that there were no chemical interactions between tanshinone IIA, CT, total tanshinones and carriers. Similar results have reported SDs of tanshinone IIA using poloxamer 188 as a carrier [28].
Fig. 9.
FTIR spectrogram of raw materials, solid dispersions and physical mixtures (1:6 w/w).
3.7. PXRD diffractograms
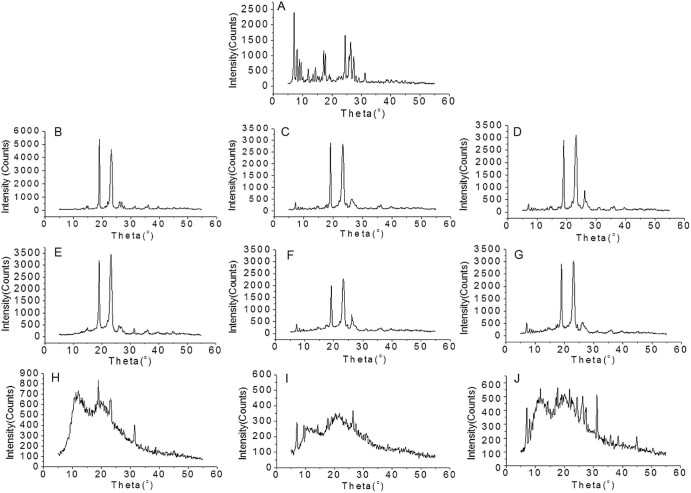
The PXRD diffractograms of total tanshinones, PEG 6000, poloxamer 188, PVP K30, the solid dispersions and physical mixtures were shown in Fig. 10. The X-ray diffractogram of total tanshinones has sharp peaks between diffraction angles (2θ) 6.85°–31.26° (Fig. 10A). In diffractograms of total tanshinones-PEG 6000, total tanshinones-poloxamer 188 SDs and physical mixtures, the major crystal peaks are characteristic crystalline peaks of PEG 6000 (Fig. 10B–D) and poloxamer 188 (Fig. 10E–G). The peaks between diffraction angles (2θ) 6.85°–9.31°of total tanshinones still remained in the SD and physical mixture systems, but the relative intensity is lower. The peaks between 24.91° and 29.12° of total tanshinones may overlap with the carriers. No visible differences in PXRD diffractograms were found between the two SDs and physical mixtures. Although in DSC thermographs, no endothermic response was recorded for total tanshinones and single ingredients due to the possible solubility of drug substances in molten carriers, the total tanshinones may exist in microcrystalline form in PEG 6000 and poloxamer 188 SDs with the formation of eutectic mixture during SD preparation. In the total tanshinones-PVP K30 SD (Fig. 10H–J), compared to the diffractograms of total tanshinones-PVP K30 SD with physical mixture, the crystal peaks of total tanshinones in the SD is obviously lower, some even disappeared. This may suggest that the crystal growth of total tanshinones may be prohibited by PVP K30 in SDs to some extent, and at this weight ratio of drug and PVP K30, total tanshinones were still in the form of microcrystal in total tanshinones-PVP K30 SD system.
Fig. 10.
PXRD diffractograms of total tanshinones solid dispersions and physical mixtures (1:6 w/w). (A) Total tanshinones, (B) PEG 6000, (C) total tanshinones-PEG 6000 solid dispersion, (D) total tanshinones-PEG 6000 physical mixture, (E) poloxamer 188, (F) total tanshinones-poloxamer 188 solid dispersion, (G) total tanshinones-poloxamer 188 physical mixture, (H) PVP k30, (I) total tanshinones-PVP K30 solid dispersion, (J) total tanshinones-PVP K30 physical mixture.
4. Conclusion
Solid dispersions of tanshinone IIA, CT and total tanshinones were successfully prepared using PEG6000, poloxamer 188, and PVP k30 as hydrophilic carriers. The solubility, dissolution rate of tanshinone IIA and CT were dramatically elevated compared with their physical mixtures and pure compounds. Among these three commonly used hydrophilic carriers, poloxamer 188 proved to be the best carrier for tanshinone IIA, CT and total tanshinones for SD preparation with higher dissolution rate and feasible manufacture method. The SDs were characterised by SEM, DSC, FTIR and PXRD and the results confirmed that tanshinone IIA, CT and total tanshinones existed in the form of microcrystal or superfine crystal in SDs prepared with hydrophilic carriers of PEG 6000, poloxamer 188 and PVP K30 at the weight ratio of 1:6. No interactions of drug substances and the carriers were found in all SDs prepared. These results suggest that SD using poloxamer 188 is a feasible and highly effective technique to improve the solubility and dissolution rate of tanshinones. As a drug candidate for various conditions such as cancer and cardiovascular diseases, further studies of tanshinones and applications of relevant SD techniques may help to improve the clinical efficacy and safety of tanshinone formulations.
Acknowledgement
The authors gratefully acknowledge Professor Xing Tang (Shenyang Pharmaceutical University, ShenYang, China) for his kind help and useful suggestions.
Footnotes
Peer review under responsibility of Shenyang Pharmaceutical University.
References
- 1.Zhou L., Zuo Z., Chow M.S. Danshen: an overview of its chemistry, pharmacology, pharmacokinetics, and clinical use. J Clin Pharmacol. 2005;45:1345–1359. doi: 10.1177/0091270005282630. [DOI] [PubMed] [Google Scholar]
- 2.Wei W. The progress of clinical application of tanshinones. Tianjin Pharmacy. 2007;19:63–65. [Google Scholar]
- 3.Yu X.Y., Lin S.G., Zhou Z.W. Tanshinone IIB, a primary active constituent from Salvia miltiorrhza, exhibits neuro-protective activity in experimentally stroked rats. Neurosci Lett. 2007;417:261–265. doi: 10.1016/j.neulet.2007.02.079. [DOI] [PubMed] [Google Scholar]
- 4.Lam B.Y., Lo A.C., Sun X. Neuroprotective effects of tanshinones in transient focal cerebral ischemia in mice. Phytomedicine. 2003;10:286–291. doi: 10.1078/094471103322004776. [DOI] [PubMed] [Google Scholar]
- 5.Wang X., Wei Y., Yuan S. Potential anticancer activity of tanshinone IIA against human breast cancer. Int J Cancer. 2005;116:799–807. doi: 10.1002/ijc.20880. [DOI] [PubMed] [Google Scholar]
- 6.Cheng C.Y., Su C.C. Tanshinone IIA may inhibit the growth of small cell lung cancer H146 cells by up-regulating the Bax/Bcl-2 ratio and decreasing mitochondrial membrane potential. Mol Med Rep. 2010;3:645–650. doi: 10.3892/mmr_00000310. [DOI] [PubMed] [Google Scholar]
- 7.Won S.H., Lee H.J., Jeong S.J. Tanshinone IIA induces mitochondria dependent apoptosis in prostate cancer cells in association with an inhibition of phosphoinositide 3-kinase/AKT pathway. Biol Pharm Bull. 2010;33:1828–1834. doi: 10.1248/bpb.33.1828. [DOI] [PubMed] [Google Scholar]
- 8.Chiu T.L., Su C.C. Tanshinone IIA induces apoptosis in human lung cancer A549 cells through the induction of reactive oxygen species and decreasing the mitochondrial membrane potential. Int J Mol Med. 2010;25:31–236. [PubMed] [Google Scholar]
- 9.Chu T., Zhang Q., Li H. Development of intravenous lipid emulsion of tanshinone IIA and evaluation of its anti-hepatoma activity in vitro. Int J Pharm. 2012;424:76–88. doi: 10.1016/j.ijpharm.2011.12.049. [DOI] [PubMed] [Google Scholar]
- 10.Yang L., Guo H., Dong L. Tanshinone IIA inhibits the growth, attenuates the stemness and induces the apoptosis of human glioma stem cells. Oncol Rep. 2014;32:1303–1311. doi: 10.3892/or.2014.3293. [DOI] [PubMed] [Google Scholar]
- 11.Zhang K., Li J., Meng W. Tanshinone IIA inhibits acute promyelocytic leukemia cell proliferation and induces their apoptosis in vivo. Blood Cells Mol Dis. 2016;56:46–52. doi: 10.1016/j.bcmd.2015.10.007. [DOI] [PubMed] [Google Scholar]
- 12.Zhu Y.Q., Wang B.Y., Wu F. Influence of tanshinone IIA on the apoptosis of human esophageal Ec-109 cells. Nat Prod Commun. 2016;11:17–19. [PubMed] [Google Scholar]
- 13.Chen F., Li Z.Y., Liu M.S. Development in preparation of radix Salviae Miltiorrhizae. China Pharm. 2006;17:1675–1677. [Google Scholar]
- 14.Mao S.J., Hou S.X., Liang Z. Ion-pair reversed-phase HPLC: assay validation of sodium tanshinone IIA sulfonate in mouse plasma. J Chromatogr B Analyt Technol Biomed Life Sci. 2006;831:63–168. doi: 10.1016/j.jchromb.2005.11.045. [DOI] [PubMed] [Google Scholar]
- 15.Hao H., Wang G., Cui N. Identification of a novel intestinal first pass metabolic pathway: NQO1 mediated quinone reduction and subsequent glucuronidation. Curr Drug Metab. 2007;8:137–149. doi: 10.2174/138920007779816011. [DOI] [PubMed] [Google Scholar]
- 16.Zhang J., Huang M., Guan S. A mechanistic study of the intestinal absorption of cryptotanshinone, the major active constituent of Salvia miltiorrhiza. J Pharmacol Exp Ther. 2006;317:1285–1294. doi: 10.1124/jpet.105.100701. [DOI] [PubMed] [Google Scholar]
- 17.Hao H., Wang G., Cui N. Pharmacokinetics, absorption and tissue distribution of tanshinone IIA solid dispersion. Planta Med. 2006;72:1311–1317. doi: 10.1055/s-2006-951698. [DOI] [PubMed] [Google Scholar]
- 18.Li J., Wang G., Li P. Simultaneous determination of tanshinone IIA and cryptotanshinone in rat plasma by liquid chromatography-electrospray ionisation-mass spectrometry. J Chromatogr B Analyt Technol Biomed Life Sci. 2005;826:26–30. doi: 10.1016/j.jchromb.2005.07.048. [DOI] [PubMed] [Google Scholar]
- 19.Shanghai Cooperative Group for the Study of Tanshinone IIA Therapeutic effect of sodium tanshinone IIA sulfonate in patients with coronary heart disease. A double blind study. J Tradit Chin Med. 1984;4:20–24. [PubMed] [Google Scholar]
- 20.Liu J., Zhu J., Du Z. Preparation and pharmacokinetic evaluation of tanshinone IIA solid lipid nanoparticles. Drug Dev Ind Pharm. 2005;31(6):551–556. doi: 10.1080/03639040500214761. [DOI] [PubMed] [Google Scholar]
- 21.Wang L., Jiang X., Xu W. Complexation of tanshinone IIA with 2-hydroxypropyl-β-cyclodextrin: effect on aqueous solubility, dissolution rate, and intestinal absorption behavior in rats. Int J Pharm. 2007;341:58–67. doi: 10.1016/j.ijpharm.2007.03.046. [DOI] [PubMed] [Google Scholar]
- 22.Liang X.D., Zheng Y., Fan T.Y. Preparation and in vitro evaluation of tanshinone IIA pulsatile release pellets. Beijing Da Xue Xue Bao. 2010;42:559–564. [PubMed] [Google Scholar]
- 23.Li H.L., Zhang Z.Y., Ma L.L. Preparation of tanshinone microemulsion and its absorption in rat intestine in situ. China J Chin Mater Med. 2007;32:1024–1027. [PubMed] [Google Scholar]
- 24.Kumar S., Gupta S.K. Pharmaceutical solid dispersion technology: a strategy to improve dissolution of poorly water-soluble drugs. Recent Pat Drug Deliv Formul. 2013;7:111–121. doi: 10.2174/18722113113079990009. [DOI] [PubMed] [Google Scholar]
- 25.Dhirendra K., Lewis S., Udupa N. Solid dispersions: a review. Pak J Pharm Sci. 2009;22:234–246. [PubMed] [Google Scholar]
- 26.Karavas E., Georgarakis E., Sigalas M.P. Investigation of the release mechanism of a sparingly water-soluble drug from solid dispersions in hydrophilic carriers based on physical state of drug, particle size distribution and drug-polymer interactions. Eur J Pharm Biopharm. 2007;66:334–347. doi: 10.1016/j.ejpb.2006.11.020. [DOI] [PubMed] [Google Scholar]
- 27.Modi A., Tayade P. Enhancement of dissolution profile by solid dispersion (kneading) technique. AAPS PharmSciTech. 2006;7:68. doi: 10.1208/pt070368. [DOI] [PMC free article] [PubMed] [Google Scholar]
- 28.Zhao X., Liu X., Gan L. Preparation and physicochemical characterizations of tanshinone IIA solid dispersion. Arch Pharm Res. 2011;34:949–959. doi: 10.1007/s12272-011-0612-3. [DOI] [PubMed] [Google Scholar]
- 29.Deng L., Zou H., Jiang X.T. Preparation and evaluation of silibinin solid dispersions in vitro. Acad J Sec Mil Med Univ. 2000;21:961–964. [Google Scholar]


