

Graphical Abstract
Keywords: ABC phenomenon, PEGylated nanoemulsions, Complement inhibition, Cobra venom factor
Abstract
Researchers reported that intravenously injected PEGylated colloidal drug carriers lose their long-circulating characteristic and accumulated extensively in liver when they are administrated twice in the same animal with certain intervals. This phenomenon was referred to as the “accelerated blood clearance (ABC) phenomenon”. Some former studies had found that complement-mediated phagocytosis, activated by antigen–antibody complex, was responsible for inducing the phenomenon. According to the theory, we have used cobra venom factor to deplete complement in vivo and to investigate the effect of complement inhibition on the ABC phenomenon. Rats were administered by injection of cobra venom factor solution to build up the model of complement exhaustion/inhibition, and the effect of the inhibition of complement on ABC phenomenon was carried out. It seemed that inhibition of complement didn't affect the pharmacokinetic of the first infection. By contrast, in rats of which complement had been depleted, the second dose of PEGylated nanoemulsions showed enhanced circulation time compared with normal rats in a complement inhibition-independent manner, but the ABC phenomenon was not completely eliminated. It indicated that complement inhibition could certainly weaken the accelerated clearance; meanwhile, there were other factors causing the ABC effect. These findings provide novel insights into the attenuating of ABC phenomenon and lay foundation for further study of immune mechanism.
1. Introduction
Colloidal drug delivery system endows the drug unique pharmacokinetic characteristics and effectively improves the therapeutic index. However, due to the nonspecific adhesion of plasma proteins on carrier surface, it is easy to be identified and captured by mononuclear phagocyte system (MPS), which stimulates the rapid disappearance from the blood circulation. In recent years, PEGylation, namely surface modification with amphiphilic polyethylene glycol (PEG), has been extensively used to protect nanocarriers from the interference of opsonins, with the aim of increasing the circulation time [1], [2], [3], [4]. Undoubtedly, PEGylation, offering sufficient steric hindrance and dense hydration layer, brings new vitality for the application and development of nanocarriers.
It is generally believed that liposomes modified with PEG have no or lower immunogenicity. Nevertheless, recent reports have demonstrated that intravenous injection of PEGylated carriers or drugs significantly alters the pharmacokinetics and biodistribution of the second dose (after an interval of several days), which is referred to as the “accelerated blood clearance (ABC) phenomenon” [5]. Furthermore, this phenomenon is elicited by pretreatment with not only PEGylated liposomes but also polymeric micelles [6] and PEG-containing polymeric nanoparticles [7], [8]. These changes will affect the therapeutic outcomes or even cause side effects. Therefore, ABC phenomenon puts forward unavoidable challenges for further study of PEGylation technology, which deserves considerable attention.
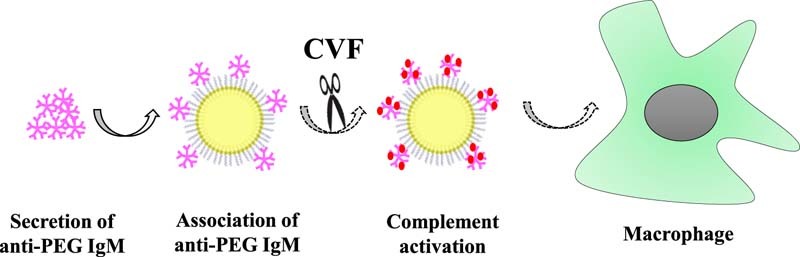
The universally accepted mechanism is as follows [9], [10], [11]: primarily injected PEGylated carriers, in a manner of class-2 of thymus-independent antigens (TI-2), stimulate proliferation and differentiation of specific B cells in the splenic marginal zone (MZ), and consequently trigger the production of anti-PEG IgM. Upon administration of the second dose, anti-PEG IgM instantly recognizes and combines with PEGylated preparations, which activate the complement system, resulting in opsonization by C3 fragments and enhanced uptake by Kupffer cells via complement receptor-mediated endocytosis; therefore, ABC phenomenon is elicited. Although the mechanism of ABC phenomenon has not been elucidated fully, it is obvious that the activation of complement system plays an essential role in the accelerated clearance.
Complement is a group of proteins with enzyme activity when revitalized in the blood and tissue fluid of normal human and animals. The complement system is broadly involved in anti-microbial defensive response and immune regulation of the body, and can mediate injury reaction of immune pathology, which is the effective system with important biological significance in vivo. It is widely accepted that complement activation via the classical pathway by antigen–antibody complex is a vital aspect for ABC phenomenon, while there are no reports focused on the application of complement inhibitors to study the relationship between the complement and ABC phenomenon so far. Cobra venom factor (CVF) has no neurotoxicity or cardiotoxicity, and has been widely used for the complement researches [12], [13], [14]. Consequently, we adopted CVF to establish the rat model of complement inhibition and explored the role of complement in the ABC phenomenon. In a previous study, we observed that the repeated intravenous administration of PEGylated nanoemulsions (PE) evoked a significant immune response in rats [15]. Therefore, in this research, PE was used as the suitable carrier to investigate the elimination or attenuation of ABC phenomenon by complement inhibition. To evaluate the ABC phenomenon, we calculated the ratio of the area under the blood concentration–time curve (AUC)(0–4 h) of the second injection to that of the first one as the ABC index, due to the high sensitivity of AUC in ANOVA (analysis of variance) tests [16].
2. Materials and methods
2.1. Materials
Tocopheryl nicotinate (TN) was purchased from Northeast Pharmaceutical Group Co. Ltd. (Shenyang, Liaoning, China). Medium chain triglycerides (MCT) were from North Medicinal Oil Co. Ltd. (Tieling, China). Soy lecithin (S75) was from Lipoid GmbH (America). N-(Carbonyl-methoxypolyethyl-eneglycol-2000)-1,2-distearoyl-sn-glycero-3-phosphoethanolamine (mPEG2000-DSPE) was purchased from Genzyme Corporation (Cambridge, MA). Vitamin E acetate (VE) was bought from BASF (Germany). Glucose injection was produced by the South of Kunming Pharmaceutical Limited Company. Sterile water for injection was offered by Shijiazhuang Pharmaceutical Co. Ltd. Four percent sheep red blood cell and rabbit anti-sheep red blood cell hemolysin was obtained from Yuhuan South Reagent Factory. CVF was purchased from Kunming Institute of Animal Science (Chinese Academy of Science). All the other reagents were of chromatographic grade.
2.2. Animals
Male Wistar rats (each weighing 180~220 g) were purchased from the Laboratory Animal Center of Shenyang Pharmaceutical University (Shenyang, Liaoning, China). All animal care and experiments were carried out in accordance with the guidelines of the Animal Welfare Committee of Shenyang Pharmaceutical University.
2.3. Preparation of PEGylated nanoemulsion
Briefly, TN, MCT, S75 (20.0/100.0/23.3, wt/wt/wt), and mPEG2000-DSPE (S75 and mPEG2000-DSPE, 9/1, molar ratio) were mixed as oil phase with constant stirring at 55 °C until dissolved. Sterile water for the injections, heated to 55 °C, was added. The mixture was immediately and quickly stirred, and incubated at 55 °C for 10 minutes to produce the prime emulsion. The entire product was sonicated using a laboratory ultrasonic cell pulverizer (JY92-II; Ningbo Scientz Biotechnology Co., Ltd, Zhejiang, China), at 200 W for 2 min and at 400 W for 6 min. The obtained emulsion was sized by extrusion through microporous membrane filters with pore sizes of 0.22 µm and was adjusted to an isotonic level with the injection of 50% glucose before administration. Nicomp 380™ Inc. (Santa Barbara CA, USA) was used to determine the particle size distribution and zeta potential. The procedures were performed in the dark.
2.4. Processing method of plasma samples and tissue samples
The concentration of TN in plasma and tissue was analyzed by high performance liquid chromatography (HPLC) using a P230 pump and a UV230 UV/Vis detector (Dalian Elite Analytical Instruments Co., Ltd., Liaoning, China) and separated using a Hypersil® BDS C18 column (200 mm × 4.6 mm) containing particles measuring 5 µm in diameter at 30 °C. The ultraviolet wavelength was 264 nm. The mobile phase was methanol/isopropanol (80/20, v/v) at a flow rate of 1 ml/min. Before the analysis, the plasma samples and tissue samples were treated as follows: 100 µl of the plasma samples or homogenates (equivalent to 0.1 g tissue) was mixed with methanol (100 µl), internal standard (100 µg/ml VE) (100 µl) and n-hexane (600 µl). The entire mixture was vortexed for 5 min and centrifuged at 10,000 rpm for 10 min. The supernatant (500 µl) was dried using a CentriVap® Centrifugal Vacuum Concentrator (Labconco Corporation, USA) and dissolved in the mobile phase (100 µl). The resulting mixture was vortexed for 1 min and centrifuged at 10,000 rpm for 10 min. The supernatant (20 µl) was collected and used for the HPLC analysis.
2.5. CH50 method for the determination of residual total complement activity in serum
In this study, we simulated the process of repeated injection of PE in vivo. The rat serum given PE 7 days before was incubated with PE, and after a certain time the residual total complement activity was determined by the 50% Hemolytic Complement (CH50) method. First dose of PE stimulated the production of anti-PEG IgM, and the antibody was combined with the second dose to activate the classical pathway of complement. This resulted in the consumption of complement components in the blood, which made the residual complement activity decrease.
CH50 assay was as follows: the complexes formed by the sheep red blood cell and hemolysin activated the complement in blood, and then led to the lysis of red cells. Via determination of the minimal serum level of 50% sensitized red blood cell (SRBC) hemolysis, the total hemolytic activity could be obtained. When the number of red cells and hemolysin was invariant, the extent of hemolysis was positively correlated with the amount and activity of complement within the given time.
2.5.1. Solution preparation
2.5.1.1. Preparation of buffer solution
A stock solution was prepared by dissolving 2.85 g Na2HPO4 ⋅ 12H2O, 0.27 g KH2PO4 and 17.00 g NaCl in 100 ml of distilled water, and was kept at 4 °C until use. Five milliliters of the stock solution and 0.1 ml 10% MgSO4 were added to 100 ml flask and diluted with distilled water to volume, and was utilized within 12 h.
2.5.1.2. Preparation of 2 U/ml hemolysin
Fifty microlitres of hemolysin (1:4000 titer) were accurately taken to 100 ml flask and diluted with buffer solution to volume.
2.5.1.3. Preparation of 2% SRBC (5 × 10⁸ cells/ml)
Four percent sheep red blood cells (1 × 10⁹ cells/ml) were mixed with 2 U/ml hemolysin, and incubated at 37 °C for 30 min in a water bath.
2.5.1.4. Preparation of 50% hemolysis tube
One milliliter 2% SRBC was blended with 1.5 ml redistilled water and 2 ml buffer was added to the mixture of same volume, and centrifuged at 2000 rpm for 10 min. The supernatant was needed.
2.5.1.5. Preparation of serum to be tested
Fresh rat blood was placed still at room temperature for 2 h, and then centrifuged at 4000 rpm for 10 min. The supernatant was separated and stored at −80 °C until use.
2.5.2. Determination of residual total complement activity of serum
Ninety microliters of serum (inactivated serum, blank serum and the rat serum given PE 7 days before) were mixed with 10 µl PE and incubated at 37 °C for 15 min in a water bath. They were added to the tubes in order, and then blended and placed at 37 °C for 30 min in a water bath. Then the test tubes were taken out and centrifuged at 3000 rpm for 10 min. The supernatant was separated to determine the OD values at 542 nm by UV spectrophotometer. The tube closest to 50% hemolysis tube was seen as terminal tube.
CH50 value was calculated using the following formula: CH50 (U/ml) = (1 / A) × D, where A represented the amount of serum and D represented the degree of dilution.
2.6. Inhibition of complement activity assay of CVF
According to the dosage of CVF, 30 healthy Wistar rats were randomly divided into 6 groups with 5 rats each, namely low dose groups (2 µg/kg, 5 µg/kg), middle dose groups (10 µg/kg, 20 µg/kg), and high dose groups (50 µg/kg, 100 µg/kg), respectively. CVF (1 mg/ml) was diluted to the desired concentration with pH 7.4 PBS buffer (0.1 mol/l), and intravenously injected into the tail vein of rats. At 0 h, 6 h, 1 d, 2 d, 3 d, 5 d, 6 d, 8 d and 10 d after the injection, blood samples were collected in a volume of 0.5 ml via eye punctures and then placed in EP tubes. After coagulation, the samples were centrifuged and measured for total complement activity (CH50) (Table 1).
Table 1.
CH50 technique measuring complement activation.
| Component | Number of the test tube | |||||||||||||||
|---|---|---|---|---|---|---|---|---|---|---|---|---|---|---|---|---|
| 0 | 1 | 2 | 3 | 4 | 5 | 6 | 7 | 8 | 9 | 10 | 11 | 12 | 13 | 14 | 15 | |
| 1:10 serum dilution (ml) | – | 0.1 | 0.2 | 0.3 | 0.4 | 0.5 | 0.6 | 0.7 | 0.8 | 0.9 | 1.0 | 1.1 | 1.2 | 1.3 | 1.4 | 1.5 |
| Buffer (ml) | 1.5 | 1.4 | 1.3 | 1.2 | 1.1 | 1.0 | 0.9 | 0.8 | 0.7 | 0.6 | 0.5 | 0.4 | 0.3 | 0.2 | 0.1 | – |
| SRBC (ml) | 1 | 1 | 1 | 1 | 1 | 1 | 1 | 1 | 1 | 1 | 1 | 1 | 1 | 1 | 1 | 1 |
2.7. Effects of complement depletion on ABC phenomenon in rats
Twenty-four healthy Wistar rats were randomly divided into 8 groups with 3 rats each, and injected via tail vein as shown in Table 2. The single injection groups were first administrated with 5% glucose solution, and repeated injection groups received the first dose of PE at 5 µmol phospholipids/kg. Six days later, the control groups were given 5% glucose solution, and test groups were injected with CVF solution at the dose of 20, 50 and 100 µg/kg respectively. Seven days after first dose, all groups received an intravenous injection of PE at the dose of 5 µmol phospholipids/kg. At 0.083, 0.25, 0.5, 1, 2 and 4 h after the injection, blood samples were obtained via eye punctures, and then centrifuged at 4000 rpm for 10 min to separate the plasma. After obtaining the last blood sample at 4 h, the livers and spleens were excised and rinsed in ice-cold normal saline. The blood samples and tissue samples were treated as “2.4”.
Table 2.
Injection scheme of PE to observe the effect of complement depletion on ABC phenomenon.
| Group | First treatment (5 µmol phospholipids/kg) | CVF treatment 1 day before the second dose | Second dose (5 µmol phospholipids/kg) |
|---|---|---|---|
| 1 | 5% glucose solution | 5% glucose solution | PE |
| 2 | 5% glucose solution | CVF (20 µg/kg) | |
| 3 | 5% glucose solution | CVF (50 µg/kg) | |
| 4 | 5% glucose solution | CVF (100 µg/kg) | |
| 5 | PE | 5% glucose solution | |
| 6 | PE | CVF (20 µg/kg) | |
| 7 | PE | CVF (50 µg/kg) | |
| 8 | PE | CVF (100 µg/kg) |
2.8. Effects of different extent of complement inhibition on ABC phenomenon in rats
Fifteen healthy Wistar rats were randomly divided into 5 groups with 3 rats each, and injected via tail vein as shown in Table 3. All groups received the first dose of PE at 5 µmol phospholipids/kg. Five days later, two groups were injected with 5 and 10 µg/kg CVF respectively. Six days after the first dose, the control group was given 5% glucose solution, and the rest of the two groups were injected with 2 and 5 µg/kg CVF respectively. Seven days after the first dose, all groups received intravenous injection of PE at the dose of 5 µmol phospholipids/kg. At 0.083, 0.25, 0.5, 1, 2 and 4 h after the injection, blood samples were obtained via eye punctures, and then centrifuged at 4000 rpm for 10 min to separate the plasma. After obtaining the last blood sample at 4 h, the livers and spleens were excised and rinsed in ice-cold normal saline. The blood samples and tissue samples were treated as “2.4”.
Table 3.
Injection scheme of PE to observe the effect of different extent of complement inhibition on ABC phenomenon.
| Group | First treatment (5 µmol phospholipids/kg) | CVF treatment before the second dose | Second dose (5 µmol phospholipids/kg) |
|---|---|---|---|
| 1 | PE | 5% glucose solution (1 day before) | PE |
| 2 | PE | 2 µg/kg CVF (1 day before) | |
| 3 | PE | 5 µg/kg CVF (1 day before) | |
| 4 | PE | 5 µg/kg CVF (2 days before) | |
| 5 | PE | 10 µg/kg CVF (2 days before) |
2.9. Statistical analysis
The data are presented as the mean ± standard deviation. The statistical analysis was performed using Student's t-test using SPSS software. P < 0.05 was considered statistically significant.
3. Results and discussion
3.1. The characteristics of PEGylated nanoemulsion
The lipid emulsion stabilized with emulsifiers such as phospholipids is a promising drug-delivery system. Nanoemulsions meet most requirements for a good parenteral delivery system since they are biodegradable, biocompatible, and physically stable [17], [18]. Once PEGylated, PE has been shown to markedly reduce recognition by the MPS and produce a prolonged blood circulation time when injected intravenously [19], [20]. As Wang et al. reported, the repeated intravenous injection of PE could elicit a significant immune response [15]. Therefore, we chose PE as proper nanocarrier to carry out further researches. Mean diameter and zeta potential of PE were 119.2 ± 1.8 nm and −30.82 ± 2.77 mV (n = 6), respectively, which showed good stability.
3.2. The relationship between ABC phenomenon and complement activation
By calculation, the CH50 value of blank serum was 44.4 U/ml, and after incubation with PE it turned out to be 40 U/ml, which indicated that there was no activation or consumption of complement components in blank serum. While incubated with rat serum given PE before, the residual total activity decreased significantly. The OD value was only 0.069 far from the 50% hemolysis tube (OD value = 0.871); hence, the residual total activity was much less than 0.670 U/ml (tube no. 15 was deemed as the terminal tube). The OD value of inactivated serum (56 °C, 30 min) was 0.051. It can be seen that complements were almost depleted via incubation with rat serum given PE before under this experimental condition. Meanwhile, it revealed that there was inevitable connection between complement activation and ABC phenomenon induced by the second dose of PEGylated preparations.
The complement system, an essential part of immune response, is activated by trigger enzyme cascade. Complement works through three means: one is opsonization, that is, via production of a mass of activated complement proteins and covalent bonding with pathogens, phagocytosis of macrophages carrying complement receptors is enhanced; another way is to recruit more phagocytes to the activated sites by some complement protein fragments with chemotactic properties; the last is to kill the bacteria through punching holes on their membrane [21]. Complement can be activated by pathogens in three different ways: classical pathway, alternative pathway and mannose-binding pectin pathway. All of them will lead to the production of a protease called C3 convertase through a series of reactions. In the early stage of complement activation, C3 is cleaved into C3a and C3b fragments by C3 convertase after binding with the surface of pathogen. The C3b fragments are the main effective molecules and can prompt corresponding phagocytes to function directionally.
Normally, PEG coating can provide dense hydration layer for nanoemulsions to avoid the adsorption of opsonic proteins effectively. Our result showed that when PE was incubated with blank serum, the residual total activity of complement did not change obviously, namely there was no consumption of complement. Accordingly, complement did not play a key role in the metabolism process of the first injected PE. After incubation with rat serum pre-injected with PE, the residual total activity of complement was almost 0, which indicated that a great deal of complement activation and consumption occurred during the incubation. It can be concluded that complement activation in blood is one of the important contributors to ABC phenomenon.
3.3. Effects of CVF on complement activity of rats
Fig. 1 showed that, at 6 h after injection, the total complement activity of other groups decreased significantly to below 2% besides the low dose groups. The complement activity of 2 µg/kg group was slightly reduced (70.05% ± 14.57%) at 1 d after injection, and it was 15.64% ± 7.82% of the initial value for 5 µg/kg group. At the same time, the complement activity of middle dose groups and high dose groups fell to the smallest, 0.93% ± 0.03% and 0.83% ± 0.17% respectively. Then the total complement activity rose gradually; it took 2 d to return to normal level for 2 µg/kg group. As for 5 µg/kg group, 10 µg/kg group and 20 µg/kg group, it required 5 d, while 50 µg/kg group and 100 µg/kg group returned to the initial after 6 d and 10 d respectively. In conclusion, the rat model of complement depletion can be established at 1 d after injection of CVF solution at a dose of 20, 50 and 100 µg/kg.
Fig. 1.
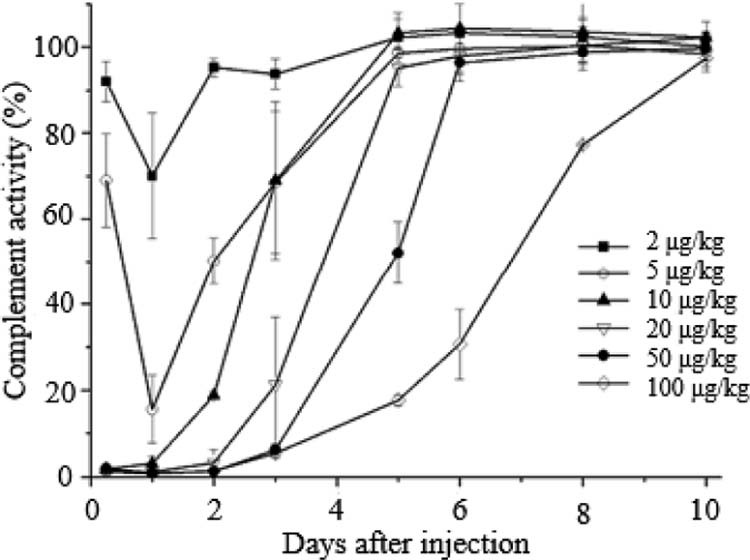
Serum complement activity in rats after i.v. injection of CVF. Data are shown as mean ± S.D., n = 5.
In fact, Flexner and Noguchi [12] proposed that the cobra venom had the anti-complementary activity in 1903, and then CVF, a certain glycoprotein in cobra venom, proved to be the active ingredient [13], [14]. CVF and factor B can form CVF-Bb complex with the function of C3 convertase to activate and deplete complement. CVF has 70% structural homology with complement C3, which activates the complement in blood via alternative pathway, resulting in the depletion of C3 and C5~C9 components. When the dose was higher than 10 µg/kg, CVF could basically deplete complement at 6 h after intravenous injection into rats. At no less than 20 µg/kg, the complement activity fell to the smallest at 1 d after administration, and the recovery time of complement activity extended with increasing dose. However, it is worth mentioning that, as a heterologous protein, CVF has antigenicity and can elicit the rapid production of anti-CVF antibody after injection. In addition, complement depletion of CVF is systemic, thus increasing the chances of infection. Considering all these factors, we chose the smaller effective dose of CVF as complement inhibitor to reduce the risk of side effects.
3.4. Effects of complement depletion on ABC phenomenon in rats
With 20, 50 and 100 µg/kg CVF solution to deplete complement the day before single injection of PE, the concentration–time curves and tissue distribution of all the groups had no significant difference; namely, complement depletion had no effect on the in vivo behavior of single injection. Taking ABC phenomenon of repeated injection of PE as a reference, ABC phenomenon of groups pre-injected with CVF was obviously attenuated, with ABC index increasing more than 3 times and drug concentration in tissues dramatically reducing (P < 0.05) (Table 4, Table 5).
Table 4.
The ABC index of each dosage regimen after the second injection (n = 3).
| Treatment before the second dose | ABC index(0–4 h) |
|---|---|
| 5% glucose solution | 0.12 ± 0.04 |
| 20 µg/kg CVF solution | 0.54 ± 0.24 |
| 50 µg/kg CVF solution | 0.51 ± 0.01 |
| 100 µg/kg CVF solution | 0.54 ± 0.21 |
Table 5.
The ABC index of PE after administrated the second injection (n = 3).
| Treatment before the second dose | ABC index (0–4 h) |
|---|---|
| 5% glucose solution | 0.12 ± 0.04 |
| 2 µg/kg CVF solution (1 day before) | 0.08 ± 0.01 |
| 5 µg/kg CVF solution (1 day before) | 0.10 ± 0.01 |
| 5 µg/kg CVF solution (2 days before) | 0.12 ± 0.01 |
| 10 µg/kg CVF solution (2 days before) | 0.11 ± 0.03 |
As shown in the complement activity–time curves, the complement activities of each test group were 70.05%, 15.64%, 50.21% and 18.84% of the activity before inhibition in this regimen, respectively. All the groups induced serious ABC effect and there was no difference with the control group. This result indicated that ABC phenomenon did not exactly rely on the complement activity.
Our experiments showed that the rats injected with (20, 50 and 100 µg/kg) CVF exhibited weakened ABC phenomenon after repeated injection of PE. The total complement activity in serum of lower dose groups was reduced in some degree, but it did not have much influence on the in vivo behavior of repeated injection of PE, with the strong ABC phenomenon. To sum up, all the rats without complement depletion could make the same disposal to repeatedly injected PE, even if there was a different total complement activity of serum. As can be seen, residual complements still played an important part in the clearance of second dose. This was highly related to the great efficiency of the body defense mechanism: repeated injection of PE, as the antigen, and anti-PEG IgM formed antigen–antibody complex, which could result in quick covalent adhesion of a small amount of complement proteins distributed in the body. Some complement fragments with chemotactic property could also be produced to recruit more phagocytes and mediate the elimination of immune complex.
Furthermore, the results showed that although CVF could cause complement depletion, the ABC phenomenon induced by PE could not be completely eliminated. This suggests that there are other mechanisms besides opsonization jointly participating in the accelerated clearance. Similar conclusion was obtained in the research of Ishida et al. [22]: in rats that were splenectomized after the first injection, the ABC phenomenon could not be totally abolished even though it was greatly attenuated. Therefore, it can be speculated that the rapid uptake and clearance of the second dose of PEGylated preparations are not entirely induced by opsonization related to the complement system.
The immune system is a complicated and delicate defense system of the body, consisting of varieties of proteins, cells, tissues and organs. Complement is the major humoral molecules of the innate immune system, but beyond that, other components of the immune system also participate in the identification and removal of alien invaders. For instance, the first dose of PEGylated preparations can irritate the lymphocytes in the thymus or the blood to produce a mass of cytokines or inflammatory chemokine factors, and then activate Kupffer cells in a opsonin-independent manner [22], [23] (Fig. 2, Fig. 3, Fig. 4, Fig. 5, Fig. 6, Fig. 7, Fig. 8).
Fig. 2.

The blood clearance profile and tissue distribution after i.v. injection of PE in rats. Each group received i.v. injections of 5% glucose solution or CVF (20 µg/kg) 1 d before the PE treatment. (A) Blood clearance and (B) hepatic and splenic accumulation 4 h after i.v. injection of the test dose. Data are shown as mean ± S.D., n = 3. P values apply to differences between the 5% glucose solution treated and CVF (20 µg/kg) treated rats before the second dose.*P < 0.05, **P < 0.01, ***P < 0.001.
Fig. 3.

The blood clearance profile and tissue distribution after i.v. injection of PE in rats. Each group received i.v. injections of 5% glucose solution or CVF (50 µg/kg) 1 d before the PE treatment. (A) Blood clearance and (B) hepatic and splenic accumulation 4 h after i.v. injection of the test dose. Data are shown as mean ± S.D., n = 3. P values apply to differences between the 5% glucose solution treated and CVF (50 µg/kg) treated rats before the second dose.*P < 0.05, **P < 0.01, ***P < 0.001.
Fig. 4.

The blood clearance profile and tissue distribution after i.v. injection of PE in rats. Each group received i.v. injections of 5% glucose solution or CVF (100 µg/kg) 1 d before the PE treatment. (A) Blood clearance and (B) hepatic and splenic accumulation 4 h after i.v. injection of the test dose. Data are shown as mean ± S.D., n = 3. P values apply to differences between the 5% glucose solution treated and CVF (100 µg/kg) treated rats before the second dose.*P < 0.05, **P < 0.01, ***P < 0.001.
Fig. 5.

The blood clearance profile and tissue distribution after i.v. injection of PE in rats. Each group received i.v. injections of 5% glucose solution or CVF (2 µg/kg) 1 d before the second treatment of PE. (A) Blood clearance and (B) hepatic and splenic accumulation 4 h after i.v. injection of the test dose. Data are shown as mean ± S.D., n = 3.
Fig. 6.

The blood clearance profile and tissue distribution after i.v. injection of PE in rats. Each group received i.v. injections of 5% glucose solution or CVF (5 µg/kg) 1 d before the second treatment of PE. (A) Blood clearance and (B) hepatic and splenic accumulation 4 h after i.v. injection of the test dose. Data are shown as mean ± S.D., n = 3.
Fig. 7.

The blood clearance profile and tissue distribution after i.v. injection of PE in rats. Each group received i.v. injections of 5% glucose solution or CVF (5 µg/kg) 2 d before the second treatment of PE. (A) Blood clearance and (B) hepatic and splenic accumulation 4 h after i.v. injection of the test dose. Data are shown as mean ± S.D., n = 3.
Fig. 8.

The blood clearance profile and tissue distribution after i.v. injection of PE in rats. Each group received i.v. injections of 5% glucose solution or CVF (10 µg/kg) 2 d before the second treatment of PE. (A) Blood clearance and (B) hepatic and splenic accumulation 4 h after i.v. injection of the test dose. Data are shown as mean ± S.D., n = 3.
Above all, it can be concluded that complement activity is not the unique factor affecting the ABC phenomenon, and there are other contributors playing an important role in the induction of ABC phenomenon. In this study, we discussed the crucial part that complement system plays in the phenomenon, and further perfected the possible mechanism of ABC phenomenon. Meanwhile, the study found that the strategy of complement inhibition can attenuate the ABC phenomenon in some degree, which provides references for making administration regimens of PEGylated preparations.
4. Conclusion
The complement activation in the blood after repeated injection of PEGylated preparations is one of the vital reasons resulting in the ABC phenomenon. The rat model of complement depletion can be well established at 1 d after injection of CVF solution at higher dose. However, the strength of ABC phenomenon does not entirely rely on the extent of the complement inhibition, and there are other contributors for the induction of ABC phenomenon besides opsonization. These findings may provide new perspectives in abrogating or attenuating the ABC phenomenon and contribute to the research of immune mechanism.
Acknowledgment
This research was supported by the National Natural Science Foundation of China (Grant No. 81373334).
Footnotes
Peer review under responsibility of Shenyang Pharmaceutical University.
References
- 1.Moghimi S., Szebeni J. Stealth liposomes and long circulating nanoparticles: critical issues in pharmacokinetics, opsonization and protein-binding properties. Prog Lipid Res. 2003;42(6):463–478. doi: 10.1016/s0163-7827(03)00033-x. [DOI] [PubMed] [Google Scholar]
- 2.Knop K., Hoogenboom R., Fischer D. Poly (ethylene glycol) in drug delivery: pros and cons as well as potential alternatives. Angew Chem Int Ed Engl. 2010;49(36):6288–6308. doi: 10.1002/anie.200902672. [DOI] [PubMed] [Google Scholar]
- 3.Cˇeh B., Winterhalter M., Frederik P.M. Stealth® liposomes: from theory to product. Adv Drug Deliv Rev. 1997;24(2):165–177. [Google Scholar]
- 4.Immordino M.L., Dosio F., Cattel L. Stealth liposomes: review of the basic science, rationale, and clinical applications, existing and potential. Int J Nanomedicine. 2006;1(3):297. [PMC free article] [PubMed] [Google Scholar]
- 5.Dams E.T.M., Laverman P., Oyen W.J.G. Accelerated blood clearance and altered biodistribution of repeated injections of sterically stabilized liposomes. J Pharmacol Exp Ther. 2000;292(3):1071–1079. [PubMed] [Google Scholar]
- 6.Kaminskas L.M., McLeod V.M., Porter C.J. Differences in colloidal structure of PEGylated nanomaterials dictate the likelihood of accelerated blood clearance. J Pharm Sci. 2011;100(11):5069–5077. doi: 10.1002/jps.22682. [DOI] [PubMed] [Google Scholar]
- 7.Zhao Y., Wang L., Yan M. Repeated injection of PEGylated solid lipid nanoparticles induces accelerated blood clearance in mice and beagles. Int J Nanomedicine. 2012;7:2891. doi: 10.2147/IJN.S30943. [DOI] [PMC free article] [PubMed] [Google Scholar]
- 8.Zhao Y., Wang C., Wang L. A frustrating problem: accelerated blood clearance of PEGylated solid lipid nanoparticles following subcutaneous injection in rats. Eur J Pharm Biopharm. 2012;81(3):506–513. doi: 10.1016/j.ejpb.2012.04.023. [DOI] [PubMed] [Google Scholar]
- 9.Shimizu T., Ishida T., Kiwada H. Transport of PEGylated liposomes from the splenic marginal zone to the follicle in the induction phase of the accelerated blood clearance phenomenon. Immunobiology. 2013;218(5):725–732. doi: 10.1016/j.imbio.2012.08.274. [DOI] [PubMed] [Google Scholar]
- 10.Ichihara M., Shimizu T., Imoto A. Anti-PEG IgM response against PEGylated liposomes in mice and rats. Pharmaceutics. 2010;3(1):1–11. doi: 10.3390/pharmaceutics3010001. [DOI] [PMC free article] [PubMed] [Google Scholar]
- 11.Koide H., Asai T., Hatanaka K. T cell-independent B cell response is responsible for ABC phenomenon induced by repeated injection of PEGylated liposomes. Int J Pharm. 2010;392(1):218–223. doi: 10.1016/j.ijpharm.2010.03.022. [DOI] [PubMed] [Google Scholar]
- 12.Flexner S., Noguchi H. Snake venom in relation to haemolysis, bacteriolysis, and toxicity. J Exp Med. 1902;6(3):277–301. doi: 10.1084/jem.6.3.277. [DOI] [PMC free article] [PubMed] [Google Scholar]
- 13.Cochrane C.G., Müller-Eberhard H.J., Aikin B.S. Depletion of plasma complement in vivo by a protein of cobra venom: its effect on various immunologic reactions. J Immunol. 1970;105(1):55–69. [PubMed] [Google Scholar]
- 14.Phillips G.B. Studies on a hemolytic factor of cobra venom requiring a heat-labile serum factor. Biochim Biophys Acta. 1970;201(2):364–374. doi: 10.1016/0304-4165(70)90311-9. [DOI] [PubMed] [Google Scholar]
- 15.Wang C., Cheng X., Sui Y. A noticeable phenomenon: thiol terminal PEG enhances the immunogenicity of PEGylated emulsions injected intravenously or subcutaneously into rats. Eur J Pharm Biopharm. 2013;85(3):744–751. doi: 10.1016/j.ejpb.2013.10.002. [DOI] [PubMed] [Google Scholar]
- 16.Bradley A.P. The use of the area under the ROC curve in the evaluation of machine learning algorithms. Pattern Recogn. 1997;30(7):1145–1159. [Google Scholar]
- 17.Rossi J., Leroux J.-C. Principles in the development of intravenous lipid emulsions. In: Wasan K., editor. Role of lipid excipients in modifying oral and parenteral drug delivery. Wiley-Interscience; Hoboken: 2007. pp. 88–123. [Google Scholar]
- 18.Hippalgaonkar K., Majumdar S., Kansara V. Injectable lipid emulsions – advancements, opportunities and challenges. AAPS PharmSciTech. 2010;11(4):1526–1540. doi: 10.1208/s12249-010-9526-5. [DOI] [PMC free article] [PubMed] [Google Scholar]
- 19.Liu F., Liu D. Amphipathic polyethylene glycol stabilized emulsions (o/w): physical characterization and in vivo distribution. Int J Pharm. 1995;125(1):73–80. [Google Scholar]
- 20.Lundberg B., Mortimer B.-C., Redgrave T. Submicron lipid emulsions containing amphipathic polyethylene glycol for use as drug-carriers with prolonged circulation time. Int J Pharm. 1996;134(1):119–127. [Google Scholar]
- 21.Janeway C.A. 5th ed. Academic Press; 2008. Immunobiology. [Google Scholar]
- 22.Ishida T., Ichihara M., Wang X.Y. Spleen plays an important role in the induction of accelerated blood clearance of PEGylated liposomes. J Control Release. 2006;115(3):243–250. doi: 10.1016/j.jconrel.2006.08.001. [DOI] [PubMed] [Google Scholar]
- 23.Ishida T., Kashima S., Kiwada H. The contribution of phagocytic activity of liver macrophages to the accelerated blood clearance (ABC) phenomenon of PEGylated liposomes in rats. J Control Release. 2008;126(2):162–165. doi: 10.1016/j.jconrel.2007.11.009. [DOI] [PubMed] [Google Scholar]