Abstract
The purpose of the present research was to develop a suitable, simple, precise, accurate, robust, and reproducible RP-HPLC method for a reliable simultaneous quantification of docetaxel (DTX) and curcumin (CCM) in rat plasma samples using paclitaxel (PTX) as an internal standard. The samples were assayed by the Agilent 1260 Infinity HPLC instrument using a Capcell Pak C8 column (4.6 mm × 150 mm, 5 µm) under isocratic conditions. The mobile phase consisted of acetonitrile and triple distilled water (40/60, v/v) with a flow rate of 1.0 ml/min. The eluent was monitored at 230 nm for simultaneous measurement of curcumin and docetaxel. The method was validated by determining system suitability, selectivity, sensitivity, linearity, inter-day and intra-day precision, accuracy, robustness, and stability in accordance with the guidelines of the United States Food and Drug Administration (FDA). The developed chromatographic method proved to be simple, precise, accurate, robust and reproducible. Moreover, the samples showed stability at room temperature over a period of 48 h. Thus, this method would be employed for routine simultaneous quantification of docetaxel and curcumin in rat plasma samples.
Keywords: Curcumin, Docetaxel, HPLC, Plasma-extraction, Simultaneous determination, Validation
1. Introduction
Docetaxel [4-acetoxy-2α-benzoyloxy-5β,20-epoxy-1,7β,10β-trihydroxy-9-oxotax-11-ene-11α-yl-(2R,3S)-3-tert-butoxycarbonylamino-2-hydroxy-3-phenylpropionate] (Fig. 1A) is a semisynthetic chemotherapeutic agent derived from a natural inactive precursor 10-deacetyl baccatin III, extracted from leaves of Taxus baccata [1], [2]. Docetaxel is approved by the United States Food and Drug Administration (FDA) for the treatment of castration resistant prostate cancer (CRPC) [3]. It possesses promising antineoplastic effects against a variety of other tumors as well [4], [5], [6], [7], [8], [9], [10]. Docetaxel possesses very poor oral bioavailability [11] due to its practical insolubility in water (4.93 µg/ml) [12] and great affinity to the multidrug efflux pump P-glycoprotein (P-gp) [13]. In long-term therapy, resistance is developed against docetaxel due to excessive activation of PI3K/AKT signaling in CRPC cells [14], [15]. Accordingly, down-regulation of PI3K/AKT signaling in CRPC cells augments the effectiveness of docetaxel [16]. Curcumin is a hydrophobic polyphenolic compound (Fig. 1B) extracted from the rhizomes of Curcuma longa. It is a potent chemoprotective and chemotherapeutic active substance against a broad spectrum of neoplasias [17], [18], [19], [20]. Also, it has been reported to have some anti-inflammatory properties. Curcumin inhibits the PI3K/AKT pathway [21], [22]. Therefore, curcumin exerts useful synergistic effects when used concomitantly with docetaxel [23], [24].
Fig. 1.
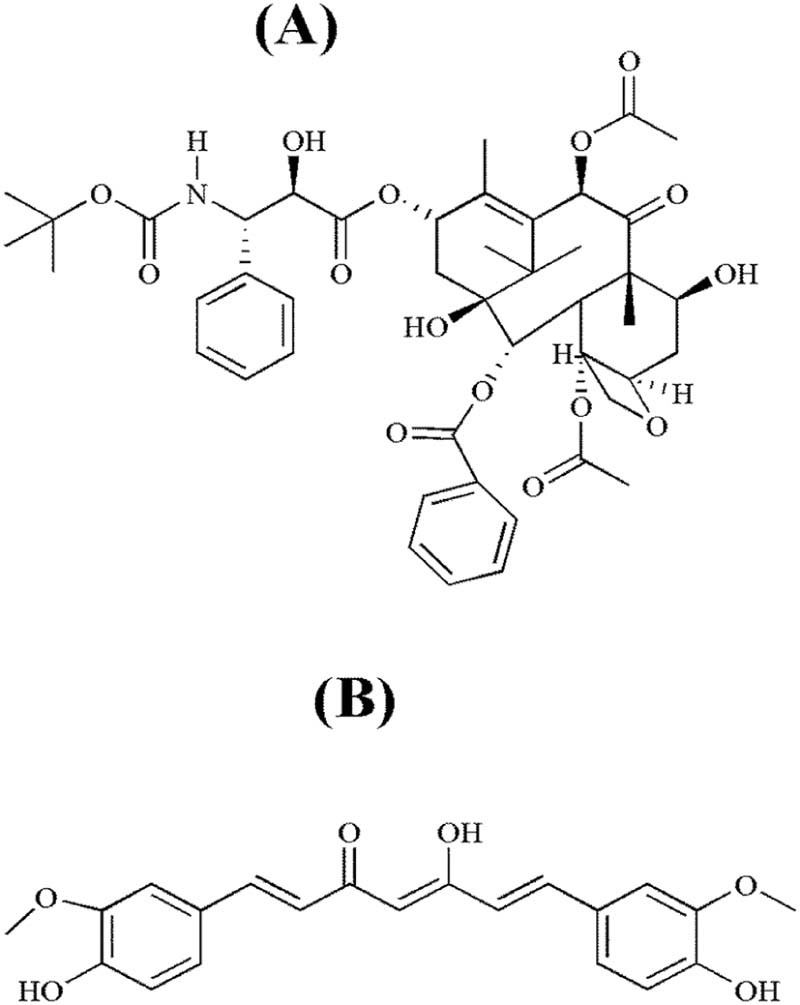
Chemical structure: (A) docetaxel; (B) curcumin.
A number of HPLC methods have been described for quantification of docetaxel in plasma samples, alone [25], [26], [27], [28], [29] or in combination with other drugs [30]. Moreover, several methods have been described for simultaneous determination of curcumin and other drugs in various pharmaceutical preparations [31], [32], [33]. However, simultaneous determination of docetaxel and curcumin in rat plasma samples has not been reported previously. Thus, the present investigation was aimed to develop a suitable, simple, precise, accurate, robust, and reproducible RP-HPLC method for simultaneous estimation of docetaxel and curcumin in rat plasma. Paclitaxel was used as an internal standard. The validation of the method was accomplished according to Food and Drug Administration (FDA) guidelines [34].
2. Materials and methods
2.1. Materials
Analytical standard grade curcumin (assay ≥ 98%; Sigma-Aldrich; St. Louis, MO, USA), paclitaxel (assay ≥ 98%; Sigma-Aldrich, St. Louis, MO, USA) and docetaxel (assay ≥ 98%; Bertin Pharma; Montigny le Bretonneux, France) pure forms were kindly provided by Hanmi Pharm. Co. (Hwasung, South Korea). The HPLC grade acetonitrile was purchased from Avantor Performance Materials, Inc. (Center Valley, PA, USA). Deionized water was obtained using Milli-Q system (Millipore; Molsheim, France). All other reagents and solvents used in this study were of analytical grade.
2.2. Instrument and chromatographic conditions
Chromatographic analysis was performed using the Agilent 1260 Infinity HPLC system (Agilent Technologies, Santa Clara, CA, USA) equipped with ChemStation software, G1311C 1260 Quat Pump, G1314B 1260 VWD VL detector and Capcell Pak C8 column (Shiseido; Tokyo, Japan, 4.6 mm I.D. × 150 mm, 5 µm). The column temperature was set at 40 °C. The mobile phase consisted of acetonitrile and triple distilled water (40/60, v/v) was used for isocratic elution at a flow rate of 1.0 ml/min. The injection volume was 10 µl. The eluent was monitored at 230 nm for simultaneous detection of curcumin and docetaxel over a period of 20 min.
2.3. Preparation of standard solutions
Accurately weighed DTX and CCM (100 mg each) were poured into a 100 ml measuring flask. They were dissolved together in 100 ml of acetonitrile to get the stock solution with a final concentration of 1 mg/ml for each analyte. Similarly, 10 mg PTX (internal standard) was dissolved in 100 ml acetonitrile in a measuring flask to get a 100 µg/ml concentration. Six standards with 3.125, 6.25, 12.5, 25, 50 and 100 µg/ml concentrations, to be used in the preparation of samples for calibration curves of DTX and CCM, were derived from the stock solution of DTX and CCM. The standards with 6.25, 10, 50, 75 and 100 µg/ml strengths, to be used in the preparation of samples for testing the other validation parameters, were also derived from the above-mentioned stock solution of DTX and CCM.
2.4. Sample preparation
Male Sprague-Dawley rats, weighing 250–280 g, were acquired from Orient Bio (Seongnam, South Korea). The procedure for the animal study was consistent with NIH Policy and the Animal Welfare Act under the approval of the Institutional Animal Care and Use Committee (IACUC) at Hanyang University. All the blank rat plasma samples were prepared by a protein precipitation technique. Each standard strength (50 µl) and internal standard (50 µl) was added to 100 µl of blank rat plasma in a microtube and vortex-mixed. Then, 1 ml of acetonitrile was added to precipitate the plasma proteins. After vortex-mixing (2 min) and centrifugation (10 min at 3000 g), the supernatant was transferred to a clean microtube and evaporated using a vacuum centrifugal evaporator. The residue was reconstituted with 100 µl of acetonitrile, vortexed for 1 min and centrifuged again for 5 min at 11,000 g. Then, 10 µl of the resulting solution was analysed by the HPLC method as described above.
2.5. Validation of the HPLC method
2.5.1. System suitability
The system suitability was assured by determining peak retention time, peak area, theoretical plates and tailing or asymmetry factor for DTX, CCM and PTX. The ideal values for system suitability are CV < 1%, asymmetry factor < 2 and theoretical plates >2000 [35]. The standard concentration of 6.25 µg/ml was used in the preparation of the samples. The sample preparation was accomplished in accordance with the method as described above in Section 2.4; therefore, the final nominal concentration, to be detected by the described method, was 3.125 µg/ml. Six replicate samples were assayed for determining the system suitability.
2.5.2. Selectivity
The blank samples of rat plasma, prepared according to the method as described in Section 2.4 but without analytes, were analysed in order to test the matrix effect. Selectivity was also ensured at the LLOQ. The plasma was obtained from six rats. Moreover, the plasma samples, obtained from the right femoral artery of the rats after concomitant administration of a dose of DTX and CCM via the oral route (in vivo testing), were also extracted according to the method described in Section 2.4, and analysed by the HPLC method as described above. Then, the samples were tested for possible interference of metabolites.
2.5.3. Sensitivity
The sensitivity for simultaneous determination of DTX and CCM was evaluated with respect to CCM peak. The limit of detection (LOD) and lower limit of quantification (LLOQ) were determined by calculating the signal/noise ratio (S/N). The sample preparation was accomplished in accordance with the method as described above in Section 2.4. According to the FDA guidelines, the analyte response (signal) at the LLOQ should be at least 5-times the response compared to blank response (noise). Moreover, the actual concentrations measured should have a precision of <20% of CV and accuracy within 20% of the nominal concentration [34].
2.5.4. Linearity
Six standard concentrations of 3.125, 6.25, 12.5, 25, 50 and 100 µg/ml were used in the preparation of calibration samples of DTX. Similarly, six standard strengths with 3.125, 6.25, 12.5, 25, 50 and 100 µg/ml were employed for the preparation of calibration samples of CCM. All the samples were prepared according to the method as described above in Section 2.4. Therefore, the nominal concentrations of DTX, to be analysed by HPLC, were 1.5625, 3.125, 6.25, 12.5, 25 and 50 µg/ml, respectively. Likewise, the nominal concentrations of CCM after sample preparation were 1.5625, 3.125, 6.25, 12.5, 25 and 50 µg/ml, respectively. The slope, intercept and correlation coefficient (r2) were calculated for regression analysis of DTX and CCM. According to the FDA guidelines, the calibrators should not deviate by more than 15% of the nominal concentrations, except at LLOQ where the calibrator should not deviate by more than 20% [34].
2.5.5. Accuracy
The accuracy was determined by the percent recovery method. Three standard concentrations of 10 µg/ml, 75 µg/ml and 100 µg/ml were used in the preparation of samples. The samples were prepared according to the method as described above in Section 2.4; thus, the final nominal concentrations, to be assayed by the described method, were 5 µg/ml, 37.5 µg/ml and 50 µg/ml, respectively. For each sample, the actual concentration was determined and the mean percent recovery was calculated (n = 6). According to the FDA guidelines, the mean value should be within 15% of the nominal value, except at LLOQ where it should not deviate by more than 20% [34].
2.5.6. Precision
For evaluating precision, intra-day and inter-day variances were determined over 1 day and 3 days, respectively. Three standard concentrations of 10, 75 and 100 µg/ml were used in the preparation of samples. All the samples were prepared in accordance with the method as described above in Section 2.4; thus, the final nominal concentrations to be assayed were 5, 37.5 and 50 µg/ml, respectively. The %CV was calculated for each sample analysed. According to the FDA guidelines, the precision determined at each concentration should not exceed 15% of the CV, except for the LLOQ where it should not exceed 20% of the CV [34].
2.5.7. Robustness
The effect of slight deliberate variation in chromatographic parameters such as column temperature, mobile phase flow rate and mobile phase composition on retention time and peak area ratio was observed one by one. The standard strength used in the preparation of the sample for this test was 100 µg/ml. The sample preparation was done according to the method as described above in Section 2.4; therefore, the final nominal concentration to be assayed was 50 µg/ml. The mean retention time and mean peak area ratio were determined for DTX and CCM against each setting (n = 6).
2.6. Stability
The standard with 50 µg/ml concentration was used in the preparation of samples for testing the stability. The samples were prepared in accordance with the method as described above in Section 2.4; therefore, the final nominal concentration was 25 µg/ml. The stability of CCM and DTX in the prepared sample was determined by analysing concentration at 1, 6, 12, 24 and 48 h. The concentration was determined for CCM and DTX at each time point (n = 3).
3. Results and discussion
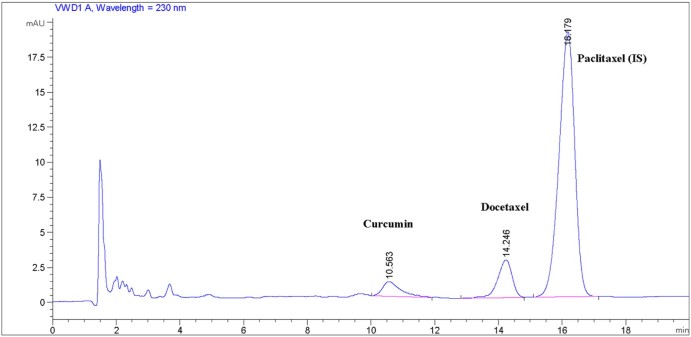
Docetaxel and curcumin are hydrophobic compounds which are practically insoluble in water [12], [36]. On the other hand, they are freely soluble in acetonitrile. In the present HPLC method, acetonitrile and triple distilled water (40/60, v/v) were used as mobile phases A and B, respectively. In a preliminary separate analysis study of CCM and DTX, not C18 but C8 column was successfully used; therefore, C8 column was easily available for their simultaneous determination. The described chromatographic conditions resulted in CCM, DTX and PTX retention at about 10.47 ± 0.29, 14.26 ± 0.21 and 16.19 ± 0.12 minutes, respectively (Fig. 2).
Fig. 2.
Chromatogram showing retention time of peaks of interest.
According to the USP, the HPLC method is considered suitable when the CV of peak area < 1%, the tailing factor < 2 and the theoretical plates > 2000 [35]. The results of system suitability are shown in Table 1. All the measured parameters are within the recommended limits. Thus, our results suggested that the described method was suitable for the simultaneous determination of DTX and CCM using PTX as an internal standard.
Table 1.
System suitability.
| Parameter | Curcumin | Docetaxel | Paclitaxel |
|---|---|---|---|
| Peak area | 53.44 ± 0.19 | 73.11 ± 0.24 | 1025.69 ± 0.23 |
| Retention time | 10.47 ± 0.29 | 14.26 ± 0.21 | 16.19 ± 0.12 |
| Theoretical plates | 3553.33 ± 0.24 | 5559.50 ± 0.27 | 5759.67 ± 0.30 |
| Tailing factor | 0.67 ± 0.59 | 1.14 ± 0.35 | 1.15 ± 0.26 |
Each value denotes the mean ± %CV (n = 6).
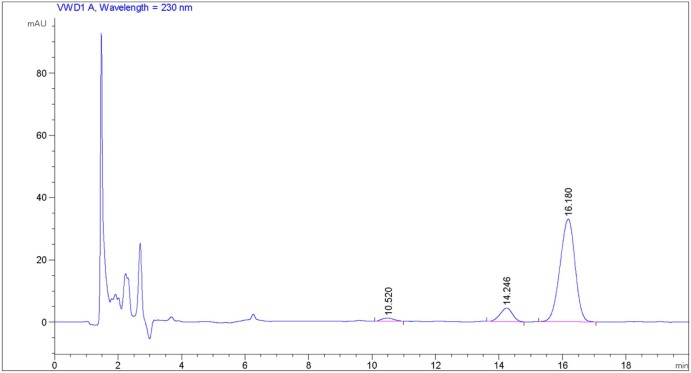
During testing selectivity, the analyses of blank samples generated some peaks within about 4 minutes of detection time. After 4 minutes, prominent signals did not appear in the chromatograms (data not shown). Moreover, the analyses of the analyte-containing samples exhibited well-differentiated peaks of the analytes at their respective retention times, even at the lower concentrations (Fig. 2, Fig. 3). Furthermore, the analyses of the plasma samples, withdrawn from rats (via the right femoral artery) after administering a dose of DTX and CCM via the oral route (in vivo testing), showed chromatograms similar to those of the samples tested in vitro. No additional peak, interfering with the analyte-peaks, was seen in the chromatogram (Fig. 4). Accordingly, our results suggested that the described analytical method demonstrated selectivity in both in vitro and in vivo samples.
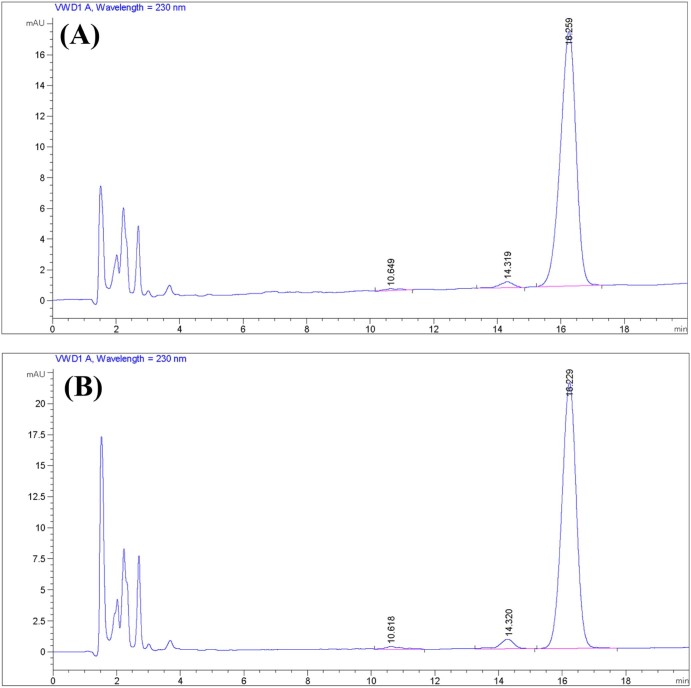
Fig. 3.
Sensitivity: (A) LOD (1.5625 µg/ml); (B) LLOQ (3.125 µg/ml).
Fig. 4.
Chromatogram of a plasma sample obtained from rat after concomitant administration of a dose of DTX and CCM via the oral route.
At the same concentration, the described method resulted in a relatively shorter peak corresponding to CCM than that corresponding to DTX; therefore, LOD and LLOQ for simultaneous determination of CCM and DTX were recorded with respect to CCM peak in our study. Fig. 3A and B shows the chromatograms corresponding to 1.5625 µg/ml and 3.125 µg/ml which resulted in an S/N ratio (mean ± SD, n = 6) of 3.03 ± 0.50 and 10.40 ± 0.87 for CCM, respectively. Accordingly, they were nominated as LOD and LLOQ, respectively. At LLOQ, the value of S/N ratio >5, a precision of the actual concentration of <20% of CV and an accuracy within 80–120% showed that they were within the recommended limits mentioned in the FDA guidelines [34].
The range for constructing the calibration curves of DTX and CCM was 1.5625–50 µg/ml (Fig. 5A, B). The response was linear throughout the range for both analytes (r2 = 0.9999 and r2 = 0.9997, respectively). The regression analysis is shown in Table 2. According to the FDA guidelines, the calibrators should not deviate by more than 15% of the nominal concentrations, except at LLOQ, where the calibrator should not deviate by more than 20% [34]. All the concentrations determined were within 85–115% of the corresponding nominal concentrations; therefore, the method exhibited linearity.
Fig. 5.
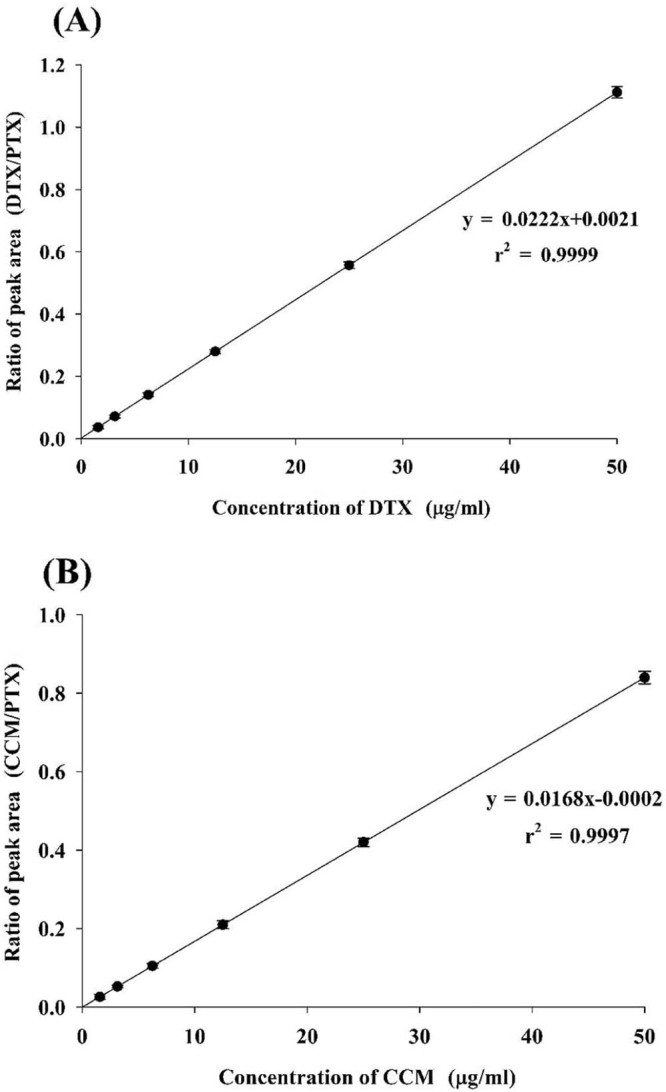
Calibration curve: (A) docetaxel; (B) curcumin.
Table 2.
Regression analysis.
| Curcumin | Docetaxel | |
|---|---|---|
| Slope | 0.0168 ± 0.00004 | 0.0222 ± 0.00002 |
| Intercept | 0.0002 ± 0.00001 | 0.0021 ± 0.00009 |
| Correlation coefficient (r2) | 0.9997 ± 0.00006 | 0.9999 ± 0.00004 |
Each value represents the mean ± SD (n = 6).
The accuracy was assessed by the percent recovery method. The accuracy data are shown in Table 3. According to the FDA guidelines, the mean value should be within 15% of the nominal value, except at LLOQ, where it should not deviate by more than 20% [34]. All the accuracy values were within 85–115% of the recovery range. Thus, our results suggested that the described method was accurate.
Table 3.
Accuracy.
| Nominal concentration (µg/ml) | Measured concentration (µg/ml)a | % Recoverya | ||
|---|---|---|---|---|
| Curcumin | Docetaxel | Curcumin | Docetaxel | |
| 5 | 5.183 ± 0.024 | 5.068 ± 0.019 | 103.66 ± 0.48 | 101.37 ± 0.38 |
| 37.5 | 37.058 ± 0.225 | 38.275 ± 0.221 | 98.822 ± 0.601 | 102.068 ± 0.589 |
| 50 | 47.610 ± 0.236 | 48.849 ± 0.252 | 95.22 ± 0.473 | 97.699 ± 0.504 |
Each value shows the mean ± SD (n = 6).
The precision was determined by %CV. The inter-day and intra-day precision data are shown in Table 4. According to the FDA guidelines, the precision determined at each concentration should not exceed 15% of the CV, except for the LLOQ where it should not exceed 20% of the CV [34]. All the tested samples showed the %CV within the accepted limits, suggesting that the described method was precise.
Table 4.
Precision.
| Nominal concentration (µg/ml) | Day | Measured concentration (µg/ml)a | Precision valueb | ||
|---|---|---|---|---|---|
| Curcumin | Docetaxel | Curcumin | Docetaxel | ||
| Intra-day variance (n = 6) | |||||
| 5 | 1 | 5.026 ± 0.039 | 5.066 ± 0.046 | 0.78 | 0.90 |
| 2 | 5.064 ± 0.035 | 5.081 ± 0.050 | 0.69 | 0.98 | |
| 3 | 5.022 ± 0.021 | 5.069 ± 0.044 | 0.42 | 0.87 | |
| 37.5 | 1 | 37.078 ± 0.30 | 37.092 ± 0.339 | 0.81 | 0.91 |
| 2 | 37.247 ± 0.320 | 37.268 ± 0.306 | 0.86 | 0.82 | |
| 3 | 37.372 ± 0.290 | 37.275 ± 0.317 | 0.78 | 0.85 | |
| 50 | 1 | 50.005 ± 0.303 | 50.303 ± 0.088 | 0.60 | 0.17 |
| 2 | 50.387 ± 0.216 | 50.241 ± 0.107 | 0.43 | 0.21 | |
| 3 | 50.177 ± 0.139 | 50.263 ± 0.145 | 0.28 | 0.29 | |
| Inter-day variance (n = 6 × 3) | |||||
| 5 | – | 5.038 ± 0.023 | 5.072 ± 0.008 | 0.46 | 0.16 |
| 37.5 | – | 37.232 ± 0.147 | 37.212 ± 0.104 | 0.39 | 0.28 |
| 50 | – | 50.190 ± 0.191 | 50.269 ± 0.171 | 0.38 | 0.34 |
Each value shows the mean ± SD.
Each value shows the %CV.
The effect of minor intentional changes in the described chromatographic conditions is shown in Table 5. According to the FDA guideline, “system suitability” and “robustness” are not necessary for the validation of bioanalytical method [34]; however, these tests were performed to further ensure the reliability of our method. Sometimes fluctuation in column temperature alters the retention time of analytes which may affect the reliability of analysis. The slight variations in the column temperature, mobile phase flow rate and mobile phase composition did not result in considerable differences in the retention time and peak area ratio of the analytes. Thus, the described method exhibited robustness.
Table 5.
Robustness testing.
| Parameter | Setting | Curcumin | Docetaxel | ||
|---|---|---|---|---|---|
| Retention timea | Peak area ratioa | Retention timea | Peak area ratioa | ||
| Column temperature (°C) | 38 | 10.473 ± 0.160 | 0.842 ± 0.513 | 14.284 ± 0.203 | 1.113 ± 0.198 |
| 40 | 10.595 ± 0.322 | 0.840 ± 0.277 | 14.294 ± 0.215 | 1.112 ± 0.265 | |
| 42 | 10.603 ± 0.398 | 0.837 ± 0.421 | 14.297 ± 0.209 | 1.112 ± 0.195 | |
| Mobile phase flow rate (ml/min) | 0.95 | 10.609 ± 0.261 | 0.840 ± 0.397 | 14.285 ± 0.200 | 1.112 ± 0.196 |
| 1.00 | 10.595 ± 0.322 | 0.840 ± 0.277 | 14.294 ± 0.215 | 1.112 ± 0.265 | |
| 1.05 | 10.460 ± 0.225 | 0.838 ± 0.255 | 14.300 ± 0.207 | 1.111 ± 0.236 | |
| Mobile phase composition (%, v/v) | 39:61 | 10.451 ± 0.156 | 0.838 ± 0.222 | 14.284 ± 0.203 | 1.113 ± 0.231 |
| 40:60 | 10.595 ± 0.322 | 0.840 ± 0.277 | 14.294 ± 0.215 | 1.112 ± 0.265 | |
| 41:59 | 10.609 ± 0.241 | 0.836 ± 0.267 | 14.304 ± 0.198 | 1.112 ± 0.264 | |
Each value shows the mean ± %CV of each setting (n = 6).
The stability test of DTX and CCM in the samples placed in the autosampler was performed at 1, 6, 12, 24 and 48 h (Table 6). The test was carried out in triplicate at each time point. The concentration of the sample increased slightly with time due to a little evaporation of acetonitrile. However, the concentration results at various time points were not significantly different from one another.
Table 6.
Stability.
| Time (h) | Concentration (µg/ml) a | |
|---|---|---|
| Curcumin | Docetaxel | |
| 1 | 24.863 ± 0.287 | 25.063 ± 0.305 |
| 6 | 24.984 ± 0.393 | 25.180 ± 0.322 |
| 12 | 25.053 ± 0.285 | 25.554 ± 0.282 |
| 24 | 25.371 ± 0.434 | 25.902 ± 0.513 |
| 48 | 25.869 ± 0.552 | 25.955 ± 0.503 |
Each value represents the mean ± %CV (n = 3).
4. Conclusion
The present HPLC method for simultaneous evaluation of DTX and CCM in rat plasma using PTX as an internal standard proved to be simple, sensitive, precise, accurate, robust and reproducible in accordance with the FDA guidelines. Furthermore, the analytes were stable in the samples placed at room temperature over a period of 48 h. Thus, the developed method can be used for routine analysis of DTX and CCM in rat plasma samples. Further study on pharmacokinetics after oral administration of a novel DTX/CCM-loaded oral product to rats will be performed with this developed method.
Acknowledgement
This work was supported by the Basic Science Research Program through the National Research Foundation of Korea (NRF) funded by the Ministry of Science, ICT and Future Planning (NRF-2015R1C1A1A01051698).
Footnotes
Peer review under responsibility of Shenyang Pharmaceutical University.
Contributor Information
Kwan Hyung Cho, Email: chokh@inje.ac.kr.
Han-Gon Choi, Email: hangon@hanyang.ac.kr.
References
- 1.Thapa R.K., Youn Y.S., Jeong J.H. Graphene oxide-wrapped PEGylated liquid crystalline nanoparticles for effective chemo-photothermal therapy of metastatic prostate cancer cells. Colloids Surf B Biointerfaces. 2016;143:271–277. doi: 10.1016/j.colsurfb.2016.03.045. [DOI] [PubMed] [Google Scholar]
- 2.Denis J.N., Greene A.E., Guenard D. Highly efficient, practical approach to natural taxol. J Am Chem Soc. 1988;110(17):5917–5919. [Google Scholar]
- 3.Galsky M., Vogelzang N. Docetaxel-based combination therapy for castration-resistant prostate cancer. Ann Oncol. 2010;21(11):2135–2144. doi: 10.1093/annonc/mdq050. mdq050. [DOI] [PubMed] [Google Scholar]
- 4.Huizing M., Misser V.S., Pieters R. Taxanes: a new class of antitumor agents. Cancer Invest. 1995;13(4):381–404. doi: 10.3109/07357909509031919. [DOI] [PubMed] [Google Scholar]
- 5.Chevallier B., Fumoleau P., Kerbrat P. Docetaxel is a major cytotoxic drug for the treatment of advanced breast cancer: a phase II trial of the Clinical Screening Cooperative Group of the European Organization for Research and Treatment of Cancer. J Clin Oncol. 1995;13(2):314–322. doi: 10.1200/JCO.1995.13.2.314. [DOI] [PubMed] [Google Scholar]
- 6.Bissett D., Setanoians A., Cassidy J. Phase I and pharmacokinetic study of Taxotere (RP 56976) administered as a 24-hour infusion. Cancer Res. 1993;53(3):523–527. [PubMed] [Google Scholar]
- 7.Tomiak E., Piccart M., Kerger J. Phase I study of docetaxel administered as a 1-hour intravenous infusion on a weekly basis. J Clin Oncol. 1994;12(7):1458–1467. doi: 10.1200/JCO.1994.12.7.1458. [DOI] [PubMed] [Google Scholar]
- 8.Piccart M.J., Gore M., Huinink W.T.B. Docetaxel: an active new drug for treatment of advanced epithelial ovarian cancer. J Natl Cancer Inst. 1995;87(9):676–681. doi: 10.1093/jnci/87.9.676. [DOI] [PubMed] [Google Scholar]
- 9.Burris H., Irvin R., Kuhn J. Phase I clinical trial of Taxotere administered as either a 2-hour or 6-hour intravenous infusion. J Clin Oncol. 1993;11(5):950–958. doi: 10.1200/JCO.1993.11.5.950. [DOI] [PubMed] [Google Scholar]
- 10.Extra J.M., Rousseau F., Bruno R. Phase I and pharmacokinetic study of Taxotere (RP 56976; NSC 628503) given as a short intravenous infusion. Cancer Res. 1993;53(5):1037–1042. [PubMed] [Google Scholar]
- 11.Kuppens I.E.L.M., Bosch T.M., van Maanen M.J. Oral bioavailability of docetaxel in combination with OC144-093 (ONT-093) Cancer Chemother Pharmacol. 2005;55(1):72–78. doi: 10.1007/s00280-004-0864-4. [DOI] [PubMed] [Google Scholar]
- 12.Gao K., Sun J., Liu K. Preparation and characterization of a submicron lipid emulsion of docetaxel: submicron lipid emulsion of docetaxel. Drug Dev Ind Pharm. 2008;34(11):1227–1237. doi: 10.1080/03639040802005057. [DOI] [PubMed] [Google Scholar]
- 13.Wils P., Phung-Ba V., Warnery A. Polarized transport of docetaxel and vinblastine mediated by P-glycoprotein in human intestinal epithelial cell monolayers. Biochem Pharmacol. 1994;48(7):1528–1530. doi: 10.1016/0006-2952(94)90580-0. [DOI] [PubMed] [Google Scholar]
- 14.Kosaka T., Miyajima A., Shirotake S. Long-term androgen ablation and docetaxel up-regulate phosphorylated Akt in castration resistant prostate cancer. J Urol. 2011;185(6):2376–2381. doi: 10.1016/j.juro.2011.02.016. [DOI] [PubMed] [Google Scholar]
- 15.Qian D.Z., Rademacher B.L., Pittsenbarger J. CCL2 is induced by chemotherapy and protects prostate cancer cells from docetaxel-induced cytotoxicity. Prostate. 2010;70(4):433–442. doi: 10.1002/pros.21077. [DOI] [PMC free article] [PubMed] [Google Scholar]
- 16.Tang Y., Parmakhtiar B., Simoneau A.R. Lycopene enhances docetaxel's effect in castration-resistant prostate cancer associated with insulin-like growth factor I receptor levels. Neoplasia. 2011;13(2):108–119. doi: 10.1593/neo.101092. [DOI] [PMC free article] [PubMed] [Google Scholar]
- 17.Moorthi C., Krishnan K., Manavalan R. Preparation and characterization of curcumin–piperine dual drug loaded nanoparticles. Asian Pac J Trop Biomed. 2012;2(11):841–848. doi: 10.1016/S2221-1691(12)60241-X. [DOI] [PMC free article] [PubMed] [Google Scholar]
- 18.Moorthi C., Kathiresan K. Curcumin–piperine/curcumin–quercetin/curcumin–silibinin dual drug-loaded nanoparticulate combination therapy: a novel approach to target and treat multidrug-resistant cancers. J Med Hypotheses Idea. 2013;7(1):5–20. [Google Scholar]
- 19.Yang C.L., Liu Y.Y., Ma Y.G. Curcumin blocks small cell lung cancer cells migration, invasion, angiogenesis, cell cycle and neoplasia through Janus kinase-STAT3 signalling pathway. PLoS ONE. 2012;7(5):e37960. doi: 10.1371/journal.pone.0037960. [DOI] [PMC free article] [PubMed] [Google Scholar]
- 20.Shishodia S., Chaturvedi M.M., Aggarwal B.B. Role of curcumin in cancer therapy. Curr Probl Cancer. 2007;31(4):243–305. doi: 10.1016/j.currproblcancer.2007.04.001. [DOI] [PubMed] [Google Scholar]
- 21.Woo J.H., Kim Y.H., Choi Y.J. Molecular mechanisms of curcumin-induced cytotoxicity: induction of apoptosis through generation of reactive oxygen species, down-regulation of Bcl-XL and IAP, the release of cytochrome c and inhibition of Akt. Carcinogenesis. 2003;24(7):1199–1208. doi: 10.1093/carcin/bgg082. [DOI] [PubMed] [Google Scholar]
- 22.Lin S.S., Huang H.P., Yang J.S. DNA damage and endoplasmic reticulum stress mediated curcumin-induced cell cycle arrest and apoptosis in human lung carcinoma A-549 cells through the activation caspases cascade-and mitochondrial-dependent pathway. Cancer Lett. 2008;272(1):77–90. doi: 10.1016/j.canlet.2008.06.031. [DOI] [PubMed] [Google Scholar]
- 23.Yin H., Guo R., Xu Y. Synergistic antitumor efficiency of docetaxel and curcumin against lung cancer. Acta Biochim Biophys Sin (Shanghai) 2011;44(2):147–153. doi: 10.1093/abbs/gmr106. gmr106. [DOI] [PubMed] [Google Scholar]
- 24.Mathur A., Elmageed Z.Y.A., Liu X. Subverting ER-stress towards apoptosis by nelfinavir and curcumin coexposure augments docetaxel efficacy in castration resistant prostate cancer cells. PLoS ONE. 2014;9(8):e103109. doi: 10.1371/journal.pone.0103109. [DOI] [PMC free article] [PubMed] [Google Scholar]
- 25.Garg M.B., Ackland S.P. Simple and sensitive high-performance liquid chromatography method for the determination of docetaxel in human plasma or urine. J Chromatogr B Biomed Sci Appl. 2000;748(2):383–388. doi: 10.1016/s0378-4347(00)00356-x. [DOI] [PubMed] [Google Scholar]
- 26.Loos W., Verweij J., Nooter K. Sensitive determination of docetaxel in human plasma by liquid–liquid extraction and reversed-phase high-performance liquid chromatography. J Chromatogr B Biomed Sci Appl. 1997;693(2):437–441. doi: 10.1016/s0378-4347(97)00089-3. [DOI] [PubMed] [Google Scholar]
- 27.Ciccolini J., Catalin J., Blachon M. Rapid high-performance liquid chromatographic determination of docetaxel (Taxotere) in plasma using liquid–liquid extraction. J Chromatogr B Biomed Sci Appl. 2001;759(2):299–306. doi: 10.1016/s0378-4347(01)00238-9. [DOI] [PubMed] [Google Scholar]
- 28.Rouini M., Lotfolahi A., Stewart D. A rapid reversed phase high performance liquid chromatographic method for the determination of docetaxel (Taxotere®) in human plasma using a column switching technique. J Pharm Biomed Anal. 1998;17(8):1243–1247. doi: 10.1016/s0731-7085(97)00233-1. [DOI] [PubMed] [Google Scholar]
- 29.Vergniol J., Bruno R., Montay G. Determination of Taxotere in human plasma by a semi-automated high-performance liquid chromatographic method. J Chromatogr B Biomed Sci Appl. 1992;582(1):273–278. doi: 10.1016/0378-4347(92)80333-l. [DOI] [PubMed] [Google Scholar]
- 30.López L.Z., Pastor A.A., Beitia J.M.A. Determination of docetaxel and paclitaxel in human plasma by high-performance liquid chromatography: validation and application to clinical pharmacokinetic studies. Ther Drug Monit. 2006;28(2):199–205. doi: 10.1097/01.ftd.0000189903.46802.1f. [DOI] [PubMed] [Google Scholar]
- 31.Moorthi C., Kathiresan K. Reversed phase high performance liquid chromatographic method for simultaneous estimation of curcumin and quercetin in pharmaceutical nanoformulation. Int J Pharm Pharm Sci. 2013;5(3):622–625. [Google Scholar]
- 32.Moorthi C., Kathiresan K. Simultaneous estimation of curcumin and silibinin using validated RP-HPLC-PDAmethod and its application in pharmaceutical nanoformulation. Int J Pharm Pharm Sci. 2013;5(3):475–478. [Google Scholar]
- 33.Moorthi C., Senthil Kumar C., Mohan S. Application of validated RP–HPLC–PDA method for the simultaneous estimation of curcumin and piperine in Eudragit E 100 nanoparticles. J Pharm Res. 2013;7(3):224–229. [Google Scholar]
- 34.Health U.D.O., Services H. Guidance for industry, bioanalytical method validation. 2013. http://www.fda.gov/downloads/drugs/guidancecomplianceregulatoryinformation/guidances/ucm368107.pdf accessed 29.03.16.
- 35.Shabir G.A. Validation of high-performance liquid chromatography methods for pharmaceutical analysis: understanding the differences and similarities between validation requirements of the US Food and Drug Administration, the US Pharmacopeia and the International Conference on Harmonization. J Chromatogr A. 2003;987(1):57–66. doi: 10.1016/s0021-9673(02)01536-4. [DOI] [PubMed] [Google Scholar]
- 36.Bisht S., Feldmann G., Soni S. Polymeric nanoparticle-encapsulated curcumin (“nanocurcumin”): a novel strategy for human cancer therapy. J Nanobiotechnol. 2007;5(3):1–18. doi: 10.1186/1477-3155-5-3. [DOI] [PMC free article] [PubMed] [Google Scholar]


