Graphical Abstract
Keywords: Three dimensional, Synchrotron radiation X-ray microcomputed tomography, Distribution, Microsphere, Sucrose stearate
Abstract
This study investigated the formulation mechanism of microspheres via internal surfactant distribution. Eudragit L100 based microspheres loaded with bovine serum albumin were prepared by solid in oil in oil emulsion solvent evaporation method using acetone and liquid paraffin system containing sucrose stearate as a surfactant. The fabricated microspheres were evaluated for encapsulation efficiency, particle size, production yield, and in vitro release characteristics. The internal structures of microspheres were characterized using synchrotron radiation X-ray microcomputed tomography (SR-µCT). The enhanced contrast made the sucrose stearate distinguished from Eudragit to have its three dimensional (3D) distribution. Results indicated that the content and concentration determined the state of sucrose stearate and had significant influences on the release kinetics of protein. The dispersity of sucrose stearate was the primary factor that controlled the structure of the microspheres and further affected the encapsulation efficiency, effective drug loading, as well as in vitro release behavior. In conclusion, the 3D internal distribution of surfactant in microspheres and its effects on protein release behaviors have been revealed for the first time. The highly resolved 3D architecture provides new evidence for the deep understanding of the microsphere formation mechanism.
1. Introduction
Microspheres have been widely used to achieve the passive and active drug targeting, controlled release and organ-targeted release through various routes of administration [1], [2]. Several techniques have been developed for the preparation of drug loaded microspheres. The emulsion solvent evaporation/extraction technique is a popular method to encapsulate the drugs into polymeric microspheres [3], [4], [5], [6], [7]. For protein/peptide drugs, the water in oil in water (W/O/W), solid in oil in water (S/O/W) and solid in oil in oil (S/O/O) solvent evaporation techniques have been frequently applied. In order to maintain the integrity and activity of proteins, the S/O/O or S/O/W method based on a suspension of dry protein powders has been proven to be the best option [5]. In this research, the S/O/O emulsion solvent evaporation technique was employed to prepare the protein loaded microspheres.
The formulation composition and preparation process are crucial in determining the particle size distribution, morphology, structure and pharmaceutical behavior of the microspheres. In addition, the drug release behavior of microspheres is the key criteria for the design and evaluation of microsphere delivery systems. Apart from the known fact that the release kinetics of loaded drugs is dependent on the polymer nature, the morphology and internal structure of the microspheres are also important for the complete description and understanding of drug release models.
A number of literature detailed the formation mechanism of microspheres [8], [9], [10], [11]. Most of these reports explained the effects of preparation method on the drug entrapment, particle morphology, drug release and the role of dispersing agents on the release behavior. However, the correlation between the mentioned above factors and the internal structures of microspheres remains challenging due to the absence of an efficient methodology. To date, the commonly used characterization methods to probe the internal structure of microspheres are conventional optical microscopy, scanning electron microscopy (SEM), and transmission electron microscopy (TEM). These approaches are limited by the penetration capability of electron beam into microspheres and unable to provide visualization of the internal structure without destruction [12], [13].
Due to the high penetration power, synchrotron radiation X-ray microcomputed tomography (SR-µCT) has been established as a powerful technique for the internal structural characterization. This technique has been well documented for investigation of morphologies and the internal structures of solid dosage forms. Pivette et al. used SR-µCT to follow the solubilization process of a drug inside the lipid matrix and the subsequent evolution of inner structure of the microparticles [14]. In a study on the relationship between particle structure and drug release from single pellets using SR-µCT in conjugation, a sensitive liquid chromatography-tandem mass spectrometry (LC/MS/MS) found that the void microstructures within the pellet were critical to the drug release profiles [15]. Recently, Huang et al. attempted to reveal the correlation between structural parameters and drug burst release using X-ray nano-CT and confocal laser scanning microscopy (CLSM) [16].
In this article, a detailed study on the formation mechanism of microspheres as well as their 3D internal structures are presented together with a quantitative description and discussion based on the details provided by the SR-µCT technique. The S/O/O emulsion solvent evaporation technique was used to prepare the bovine serum albumin (BSA)-loaded Eudragit L100 microspheres with sucrose stearate as dispersing agent. Eudragit L100 is an acrylic resin, widely applied in the preparation of controlled-release oral pharmaceutical dosage forms. As Eudragit L100 is insoluble in gastric physiological pH levels (<6.0), it has been used as a non-stomach dissolving agent for the preparation of drug products designed to release the drugs into small and large intestine regions of the gastro-intestinal tract. To investigate the microsphere formation mechanism and the relationship with the drug release behaviors, the SR-µCT was applied to obtain an accurate 3D morphology and internal structure of the microspheres.
2. Materials and methods
2.1. Materials
The materials used in this study comprised Eudragit L100 (Röhm Pharma GmbH, Weiterstadt, Germany); sucrose stearate S270 (Shanghai Shineroad Pharmaceutical Co. Ltd., China); bovine serum albumin (BSA, J&K Scientific Ltd., China); triethyl citrate (Aladdin, China); polyethylene glycol 6000 (PEG 6000, Sichuan Hanhua Medicinal Materials Co. Ltd., China); BCA Kit (Beyotime Biotechnology, China); and sodium hydroxide (NaOH, Hunan Erkang Pharmaceutical Co. Ltd., China). All other chemicals used were of analytical grade.
2.2. Preparation of PEG-BSA microparticles
PEG-BSA microparticles were prepared by co-lyophilization strategy. BSA aqueous solution was lyophilized with PEG 6000 as freeze-drying protective agent for BSA. In our previous experiments it was proved that the addition of PEG 6000 could improve the micronization of BSA and further increase the encapsulation efficiency and drug loading. Briefly, the mixture of BSA (1 g) and PEG 6000 (10 g) with ratio of 1:10 (w/w) was dissolved in distilled water (100 ml) and kept in ultra-low freezer at −80 °C for 12 h, then freeze dried for 24 h. The cold trap temperature was −45°C and the vacuum degree was set to 10 mTorr. The dried powder was sieved with 200 mesh (74 µm) and stored in dryer at 4 °C.
2.3. Preparation of microspheres
Microspheres were prepared using an S/O/O emulsion solvent evaporation method. In the present study, acetone containing 2% (v/v) water was used as the solvent for methacrylate based polymer. Eudragit of 1.65 g was dissolved completely in acetone containing 2% (v/v) water together with triethyl citrate (180 mg) by stirring at 500 rpm with a magnetic stirrer. Sucrose stearate was then added to this mixture and ultrasonicated for 5 min. The polymer solution containing sucrose stearate and 288 mg of PEG-BSA (precooled to 10 °C in an ice bath) was poured into liquid paraffin at 10 °C and mixed for 30 s using magnetic stirring (800 rpm) and then homogenized (10,000 rpm, 5 min) in an ice bath. The formed emulsion was stirred at 800 rpm and heated up to 35 °C gradually (1 °C/min), maintained at this temperature for 25 min then dried by rotary evaporation for 1 h (150 rpm, 35 °C) to remove the acetone. The ultimate solidified microspheres were centrifuged (5000 rpm for 5 min), washed three times with 50 ml of n-hexane, dried under vacuum at 35 °C for 12 h, and stored in Eppendorf tubes for further investigations.
2.4. Effects of Eudragit and sucrose stearate on microspheres
Eudragit and sucrose stearate were important factors that influenced the microspheres morphologies. Keeping the quantity of Eudragit the same, three concentrations (4.5%, 7.5% and 10.5%, w/v) of Eudragit which were controlled by the volume of acetone (15.7, 22.0 and 36.7 ml) were designed to investigate the effect of Eudragit on microspheres. Three concentrations (1%, 4% and 7%, w/v) were selected for sucrose stearate. However, owing to the variation of acetone volume, different amounts of sucrose stearate were added (Table 1).
Table 1.
Effects of Eudragit and sucrose stearate concentrations on the encapsulation efficiency (EE), drug loading (DL), production yield (PY) and effective drug loading (EDL) of different BSA microspheres formulations.
| Formulation | Sucrose stearate | Eudragit (%) | EE (%) | DL (%) | PY (%) | EDL (%) | |
|---|---|---|---|---|---|---|---|
| (%) | (g) | ||||||
| A | 1 | 0.37 | 4.5 | 76.27 | 0.62 | 79.10 | 0.73 |
| B | 1 | 0.22 | 7.5 | 66.28 | 0.60 | 72.99 | 0.66 |
| C | 1 | 0.16 | 10.5 | 79.25 | 0.58 | 71.93 | 0.63 |
| D | 4 | 1.48 | 4.5 | 99.54 | 0.76 | 65.71 | 1.28 |
| E | 4 | 0.88 | 7.5 | 95.42 | 0.34 | 74.52 | 0.84 |
| F | 4 | 0.64 | 10.5 | 99.74 | 0.61 | 71.98 | 0.80 |
| G | 7 | 2.59 | 4.5 | 101.90 | 0.45 | 62.99 | 0.99 |
| H | 7 | 1.54 | 7.5 | 100.10 | 0.56 | 62.10 | 0.97 |
| I | 7 | 1.12 | 10.5 | 99.95 | 0.73 | 64.68 | 1.12 |
2.5. Particle size distributions
Microspheres were dispersed in water and then transferred onto a glass slide to observe the morphologies under the inverted phase contrast microscope (Nikon, TS100F). Photographs were recorded for particle size measurements. Particle size distributions were measured from three random microscopic images (200 counts at least) by Image-Pro Analyzer 3D software (Version 7.0).
2.6. Encapsulation efficiency and production yield
The microspheres were destroyed and dissolved using alkaline solution. Quantitation of protein was based on the bicinchoninic acid (BCA) protein assay kit method using BSA solution as the standard. The linear concentration range for a calibration curve (A = 0.0005C+0.013, R = 0.9905) was established as 10–400 µg/ml. The encapsulation efficiency evaluation was carried out as reported [17]. Microspheres of 150 mg (W0) were dispersed into tubes containing 5 ml HCl (pH 1.2), oscillated for 5 min at 100 rpm, and centrifuged at 5000 rpm for 5 min. Supernatant solution (4 ml, V1) was removed and filtered through 0.22 µm filter membrane. Then the concentration of free BSA (C1) was determined. After that, 5 ml (V3) NaOH (0.1 M) solution was added to the remaining 1 ml (V2) HCl solution. The obtained mixture was oscillated for 30 min to ensure the polymer dissolved completely and then sonicated for 30 s. Finally, the mixture was centrifuged at 5000 rpm for 5 min and the supernatant filtered through 0.22 µm filter membrane to determine the BSA concentration (C2). The encapsulation efficiency (EE) and drug loading (DL) were calculated using the following equations:
| (1) |
| (2) |
The effective drug loading (EDL) was calculated as ratio of the encapsulated drug divided by the sum of Eudragit, BSA and PEG. The production yield (PY) was expressed as the ratio of the amounts of dried microspheres to the initial weight of the raw material of drug, polymer and other excipients.
2.7. SR-µCT measurement
The internal structures of the dried and sieved microspheres were characterized using SR-µCT tomography with the BL13W1 beam line at Shanghai Synchrotron Radiation Facility. Briefly, a pipette tip was glued with its thin end sealed by paraffin on the rotation stage. The microspheres were filled into a needle tube that also cut from the thin point of the pipette tip. And then the needle tube was fixed on the top of pipette tip. Finally, the needle tube was flipped for two or three times to compact the microspheres tighter and assured that the microspheres did not move during the image acquisition process. In consideration of the X-ray spectral flux profile, sample properties include composition and density; synchrotron radiation X-ray at 13.0 keV was used for the scans to obtain the higher spectral flux and reduction in the required imaging time. To enhance the contrast to reveal small differences in density between materials, the sample-to-detector distance was set at 12 cm after a series of preliminary experimental studies. After penetrating the sample, the X-ray was converted into visible light by a Lu2SiO5:Ce scintillator (10 µm thickness). The projections were magnified using diffraction-limited microscope optics (×10 magnification) and digitized using a high-resolution 2048 pixel × 2048 pixel sCMOS camera (ORCA Flash 4.0 Scientific CMOS, Hamamatsu K.K., Shizuoka Pref., Japan). The pixel size was 0.65 µm and the exposure time was 1 s. For each acquisition, 1080 projections over 180° were collected. Light field images (i.e. X-ray illumination on the beam path without the sample) and dark field images (i.e. X-ray illumination off) were also collected during each acquisition to account for the electronic noise and variations in the brightness of the X-ray source.
2.8. 3D reconstruction
The CT scan was a 3D map of the X-ray phase contrast. Further analysis of the data was required for a quantitative description of the microstructure. The projected images for the samples were reconstructed using the X-TRACT SSRF CWSx64 (Commonwealth Scientific and Industrial Research Organization, Australia, http://www.ts-imaging.net/Default.aspx) to perform a direct filtered back projection algorithm. To enhance the quality of reconstructed slices, propagation-based phase contrast extraction was carried out. After phase retrieval and reconstruction, a simple linear rescaling is utilized to transform the reconstructed CT images to a gray value of 0 to 255 (8 bit gray level). The 3D rendered data were analyzed with the commercially available VG Studio Max (Version 2.1, Volume Graphics GmbH, Germany) and Image Pro Analyzer 3D software (Version 7.0, Media Cybernetics, Inc., USA) to obtain qualitative and quantitative data, respectively. After the 3D reconstruction, the resolved images have a high quality phase contrast. Based on the 2D slices, materials with different density of the microspheres were distinguished by gray value and individually extracted to evaluate the relative distributions.
2.9. In vitro release
In vitro release of BSA from microspheres in HCl solution (pH 1.2) and PBS (pH 7.4) was evaluated. According to the calculated DL, microspheres equivalent to 3 mg of BSA were weighed for release experiments. In vitro release was measured by vibration method. Volume of the dissolution media was 10 ml. The temperature of the dissolution medium was maintained at 37 ± 0.5 °C and the speed of the shaker was adjusted to 100 rpm. 200 µl of samples were withdrawn at predetermined time intervals and replaced with the same volume of fresh medium. The withdrawn samples were centrifuged (12,000 rpm for 5 min) and then filtered through 0.22 µm filter membrane. The BSA content of the supernatant was determined by the above discussed BCA method. All of the experiments were performed in triplicate.
3. Results and discussion
3.1. Physical parameters
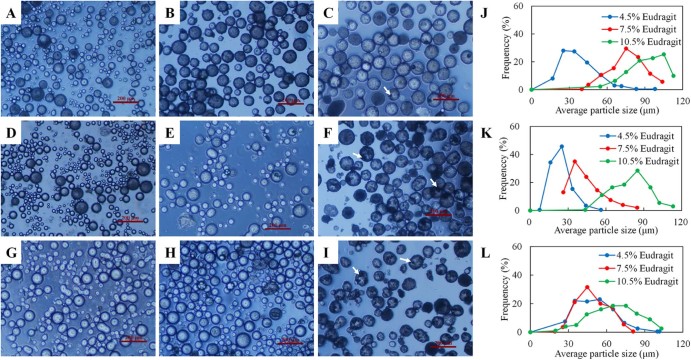
The diameter distributions and microscopic morphologies of BSA-loaded Eudragit microspheres were shown in Fig. 1. Results indicated the major influence of Eudragit and sucrose stearate concentrations on the sizes of the microspheres. The micrographs showed that all the microspheres with different concentrations of Eudragit and sucrose stearate were spherical. However, some irregular fragments attached with the microspheres could be found in the micrographs (darkest regions indicated by arrows in Fig. 1C, F, I). For sucrose stearate with the same concentration, increasing the concentration of Eudragit led to an increase in the size of the microspheres (Fig. 1J, K). The mean particle sizes of the microspheres with 4.5, 7.5 and 10.5% Eudragit were 36.75, 76.33 and 92.40 µm for 1% sucrose stearate and 23.95, 43.54 and 79.93 µm for 4% sucrose stearate, respectively. For 7% sucrose stearate, microspheres with 4.5% and 7.5% Eudragit had similar mean particle sizes of 50.25 and 49.15 µm, respectively, but recorded smaller than that with 10.5% Eudragit (65.40 µm). On the other hand, at the same concentration of Eudragit, the particle sizes also varied with the change of sucrose stearate concentrations.
Fig. 1.
Microscopic morphologies and particle size distributions of microspheres varied with the use of Eudragit and sucrose stearate concentrations. Morphologies of microspheres: The concentration of sucrose stearate was 1%, and Eudragit was 4.5% (A), 7.5% (B), and 10.5% (C), respectively; the sucrose stearate was 4%, and Eudragit was 4.5% (D), 7.5% (E), and 10.5% (F), respectively; the sucrose stearate was 7%, and the Eudragit was 4.5% (G), 7.5% (H), and 10.5% (I), respectively. Particle size distributions of microspheres with 1% (J), 4% (K) and 7% (L) sucrose stearate.
Generally, an increase in polymer concentration leads to the increase in internal phase viscosity of the emulsion and tends to form the larger size droplets during emulsification. This increased viscosity could also reduce the extent of polymer solvent partitioning into the external phase resulting in slow solidification of the polymer, and thereby an increase in microsphere particle size [7]. However, as the dispersing agent, stabilizer and surfactant, sucrose stearate reduced the interfacial tension, resulting in the inner oil phase more easily dispersed to form small size emulsion droplets.
Effects of different concentrations of Eudragit and sucrose stearate on the encapsulation efficiency (EE), drug loading (DL), production yield (PY) and effective drug loading (EDL) of different BSA microspheres formulations were shown in Table 1. The PY values of microspheres for different formulations were in the range from 62.10% to 79.10%. Sample loss was noticed during the process of microsphere solidification by solvent evaporation and washing. The EE for the microsphere formulations also varied from 66.28% to 101.90%. Formulation with 4% sucrose stearate and 4.5% Eudragit had the highest DL and EDL of 0.76% and 1.28%, respectively. The EDL values of all formulations were over 0.5%.
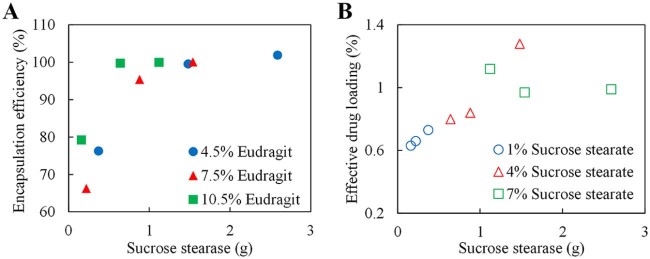
For different concentrations of Eudragit, the EE increased in line with the amount of sucrose stearate (Fig. 2A). Furthermore, the relationship between the sucrose stearate and EDL had been investigated. With increasing amount of sucrose stearate in the formulations, more BSA had been encapsulated by the same concentration of Eudragit (Fig. 2B). By keeping BSA content the same, higher DL could be obtained by increasing the amount of sucrose stearate within a certain range, as the stability of the micro emulsion system will be enhanced and more microspheres with fine structure will be fabricated.
Fig. 2.
Relationships between encapsulation efficiency, drug loading and formulation. (A) Relationship between the encapsulation efficiency (EE) and the amount of sucrose stearate. (B) Relationship between the effective drug loading (EDL) and the amount of sucrose stearate.
3.2. Microstructural determination and materials distribution
Tomographic imaging technique is helpful to understand the detailed internal structure of microspheres. The high-resolution 3D images obtained from SR-µCT refer to a model that reproduces the morphology and microstructure of a microsphere. The 3D rendering model displays completely detailed structural information about microspheres.
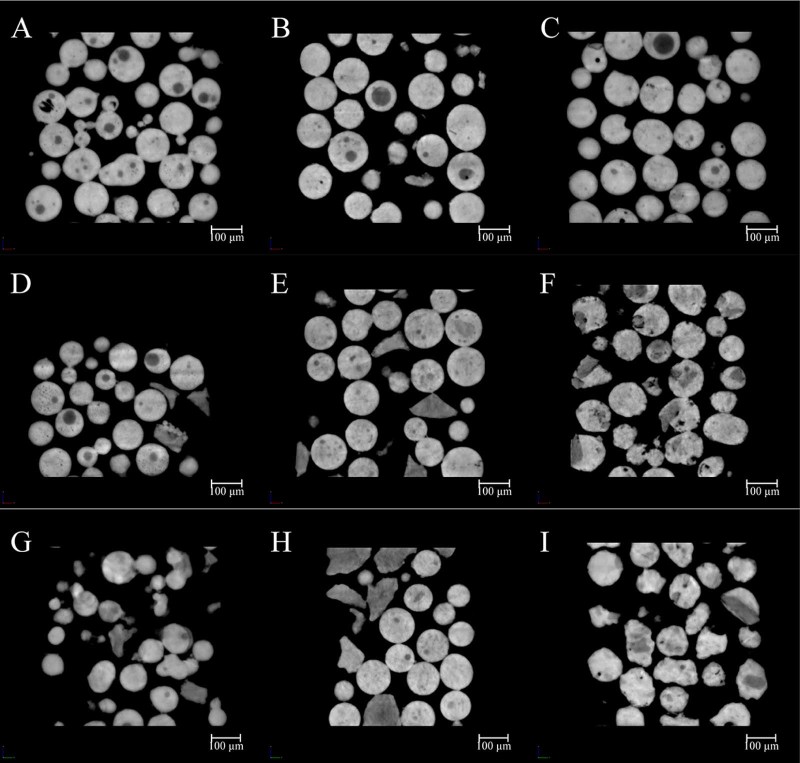
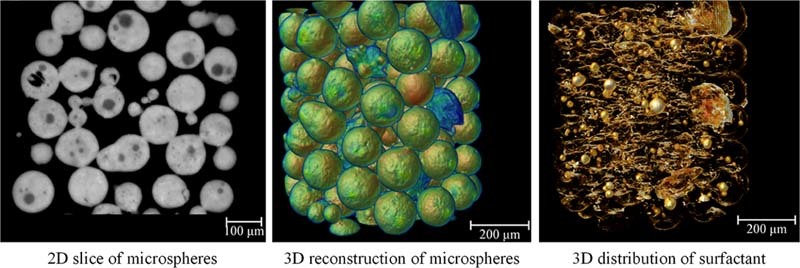
Radiographs of all samples captured by CT scans had been reconstructed and phase retrieval was performed. After linear rescaling, a series of high quality gray images were obtained and the cross sections of all formulations were shown in Fig. 3. Morphological information revealed from 2D sections indicated that the structures of microspheres were different among formulations. The variation in the gray value of the internal structure of the microspheres demonstrated the distribution of several materials in the formulations. The sum area of low gray value parts increased with the increment in sucrose stearate amount, which was related to the effect of sucrose stearate. Thus the white regions were the mixture of Eudragit and PEG-BSA. The shapes of the regions attributed to sucrose stearate were changing with its content and concentration in the inner phase.
Fig. 3.
Slides demonstrating the 2D material distribution. The concentration of sucrose stearate was 1%, and Eudragit was 4.5% (A), 7.5% (B), and 10.5% (C), respectively; the sucrose stearate was 4%, and Eudragit was 4.5% (D), 7.5% (E), and 10.5% (F), respectively; The sucrose stearate was 7%, and Eudragit was 4.5% (G), 7.5% (H), and 10.5% (I), respectively.
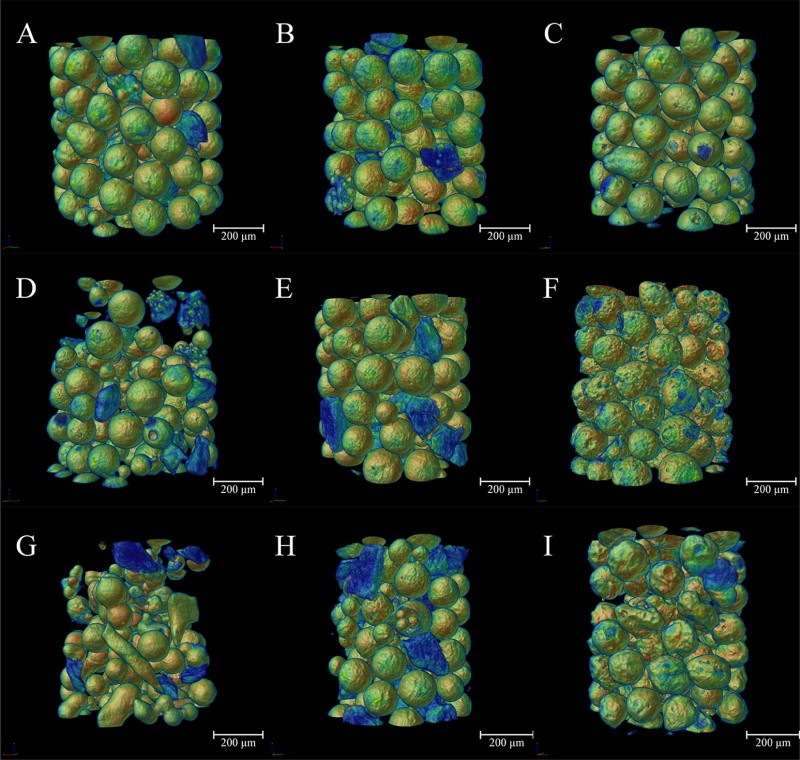
The 3D rendering model displayed the detailed structural information of the microspheres (Fig. 4), from which the morphology and microstructure of each formulation can be clearly demonstrated. In order to distinguish the sucrose stearate from other materials, models were artificially colored according to density from low to high with the jet color map which ranged from blue to red, and passed through the colors cyan, yellow, and orange. For 1% sucrose stearate samples, the microspheres were spherical with smooth surfaces, indicating the relatively fine dispersion of the system with uniform and regular emulsion droplets and microspheres formed during emulsification and solidification (Fig. 4A, B, C). When the concentration increased to 4% and 7%, solid blocks of sucrose stearate with irregular shapes (blue region in Fig. 4) formed and dispersed outside of the microspheres (Fig. 4D, E, G, H). Moreover, microspheres with rough surface were also found (Fig. 4F, I).
Fig. 4.
Images showing the morphologies at different concentrations of sucrose stearate and Eudragit. The concentration of sucrose stearate was 1%, and Eudragit was 4.5% (A), 7.5% (B), and 10.5% (C), respectively; the sucrose stearate was 4%, and Eudragit was 4.5% (D), 7.5% (E), and 10.5% (F), respectively; the sucrose stearate was 7%, and the Eudragit was 4.5% (G), 7.5% (H), and 10.5% (I), respectively. The jet color map ranges from blue to red, and passes through the colors cyan, yellow, and orange, representing the density from low to high.
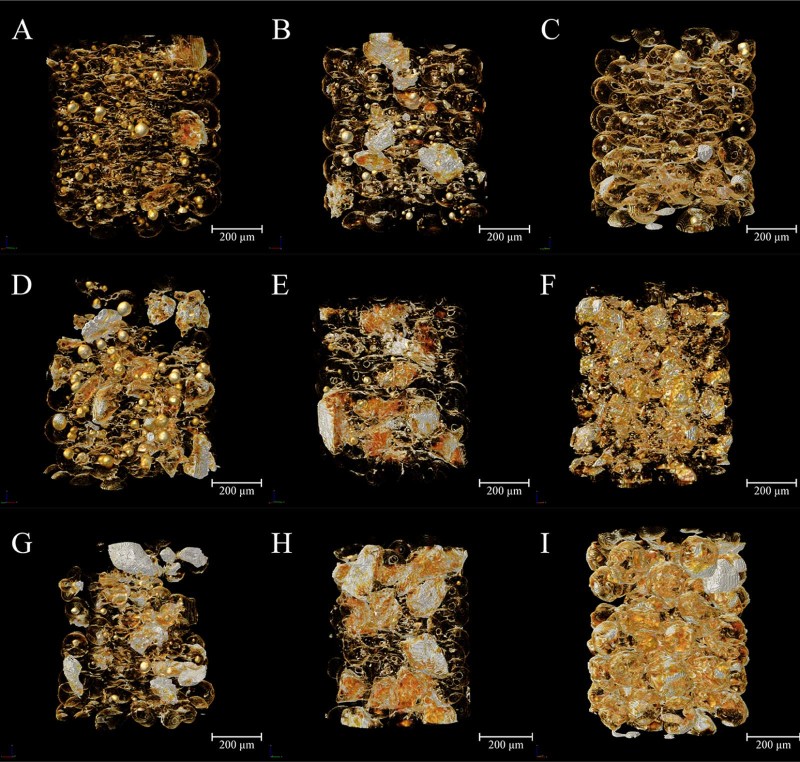
Visualization of the 3D distribution of a surfactant within particulate systems provides powerful demonstration of the interfacial effects of surfactant for the microspheres during the formation process. Based upon the structure reconstructions after SR-µCT examination and analysis, the inversed intensity extraction enables specific 3D distribution maps of individual components such as sucrose ester in the microspheres to demonstrate directly. Such quantitative details will assist in understanding the formation mechanism and process of the microparticulate systems (Fig. 5).
Fig. 5.
The 3D distribution characteristics of sucrose ester extracted from the reconstructed 3D images of microspheres based on inversed intensity extraction method. The concentration of sucrose stearate was 1%, and Eudragit was 4.5% (A), 7.5% (B), and 10.5% (C), respectively; the sucrose stearate was 4%, and Eudragit was 4.5% (D), 7.5% (E), and 10.5% (F), respectively; the sucrose stearate was 7%, and the Eudragit was 4.5% (G), 7.5% (H), and 10.5% (I), respectively. The color map ranges from red to white, and passes through the colors orange and yellow, representing the density from low to high.
It is hypothesized that the material distribution in the microspheres was determined by its status in the inner phase during emulsification. Solubility experiment showed that Eudragit had high solubility in acetone and PEG did not dissolve at low temperature, whereas it dissolved rapidly when the temperature was raised from 10 to 35 oC and did not re-precipitate at room temperature. In contrast, the dissolved sucrose stearate re-precipitated immediately when temperature reduced. The content of sucrose stearate and the volume of acetone co-determined the existing state of sucrose stearate. As mentioned above, sucrose stearate could be dissolved in acetone at relative high temperature. Beyond the required amount in stabilization of the emulsion, excessive sucrose stearate formed spherical sub-structures inside the microspheres. In formulations containing 36.7 mL of acetone and relatively low concentration of Eudragit (Table 1), the sucrose stearate partially dissolved in acetone formed the sub-structures entrapped in the microspheres and the excessive part swelled and agglomerated into large particles (Fig. 5A, D, G). When the volume of acetone reduced to 15.7 mL, the high concentration of Eudragit competitively reduced the solubility and dispersity of sucrose stearate and as a result, most of sucrose stearate existed in solid form, without cohesion (Fig. 5F, I).
As discussed above, EDL was correlated linearly with the content of sucrose stearate, which was attributed to the structure of the microspheres and sucrose stearate distribution. As the addition of sucrose stearate stabilized the emulsion droplets in the dispersion state, the probability of emulsion droplets being broken and reforming during the shearing emulsification stage would be decreased. It is reasonable to argue that any fracture and reformation of microspheres would lead to the emergence of protein to the outer phase during emulsification. In consideration of the sucrose stearate solubility in n-hexane (0.13%), washing three times with 50 mL would also significantly destroy the protective film. For 1% concentration (Fig. 3, Fig. 4, Fig. 5), a very thin protective film was formed, although a large proportion of sucrose stearate was dispersed on the surface. In contrast, at the concentration of 7%, sucrose stearate existed in solid form and being embedded on the surface of microsphere also reduced the protective effect.
3.3. In vitro release
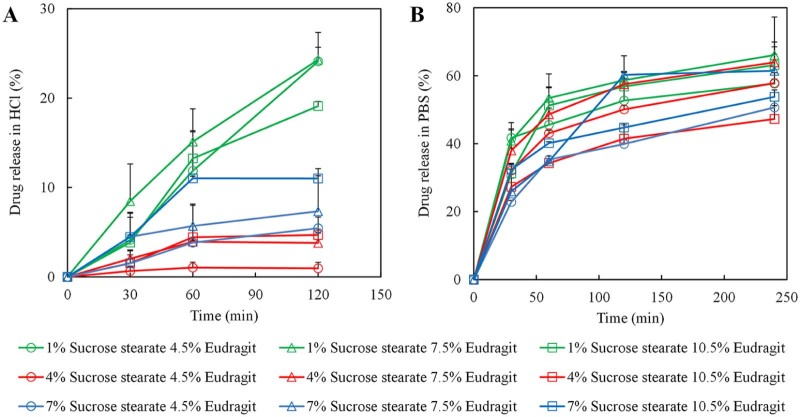
To compare the release behaviors among different formulations, in vitro release of BSA in HCl solution (pH 1.2) and phosphate buffer saline (PBS, pH 6.8) was investigated. The results indicated that the releases of microspheres were significantly dependent on pH (Fig. 6A, B). In HCl, the overall cumulative release amounts of formulations with 4% sucrose stearate were significantly lower than that with 1% and 7% sucrose stearate. However, the release profiles in PBS had no such marked tendency but better synchronicity, caused by Eudragit distribution in PBS. The BSA release profiles in HCl medium for 120 min and in PBS for 240 min were fitted by zero-order equation (Mt/M∞ = k0t), first-order equation (ln(1 − Mt/M∞) = −k0t) and Higuchi equation (Mt/M∞ = k0t1/2), respectively. Compared with zero-order fitting (average R = 0.9171 in HCl; average R = 0.9187 in PBS) and first-order fitting (average R = 0.8049 in HCl; average R = 0.8663 in PBS), Higuchi fitting had the highest correlation index (average R = 0.9540 in HCl; average R = 0.9475 in PBS). Variation in the BSA release profiles especially in pH 1.2 HCl (Fig. 6A) indicated that the lower concentration and non-intensive dispersion of sucrose stearate led to the leakage of drug. The microspheres with uniform distribution of sucrose stearate had fast drug release rate. From 1% to 4% sucrose stearate, in vitro release of microspheres with increasing intensive dispersion of surfactant decreased relatively. However, too high content of surfactant (7%) was more likely to agglomerate and distribute outside of the microspheres, further increasing drug release. The architectures of embedded sucrose stearate in the microspheres directly correlated with the drug release features. In conclusion, the dispersity of sucrose stearate was the primary factor that controlled the structure of the microspheres and further affected in vitro release behavior.
Fig. 6.
In vitro drug release of microspheres. Protein release profiles of microspheres in pH 1.2 HCl (A) and pH 6.8 PBS (B).
4. Conclusions
In this study, the 3D internal material distribution of acrylic resin microspheres containing sucrose stearate was evaluated by SR-µCT. It was found that the protein release profiles of the microspheres were controlled by the moieties of sucrose stearate. The morphology and internal structure of the microspheres had been correlated with the release kinetics, composition and formulation of the microspheres. The low density areas and architectures as embedded sucrose stearate in the microspheres were revealed by SR-µCT to have directly correlated surfactant distribution in microspheres with the drug release features, which cannot be measured by conventional methods. The 3D distributions of sucrose stearate extracted from the reconstructed microspheres have provided insight into the formation mechanism of the acrylic resin microsphere systems.
Acknowledgements
The authors are grateful for the financial support from the National Natural Science Foundation of China (No. 81430087) and the National Science and Technology Major Project (2013ZX09402103).
Contributor Information
Xianzhen Yin, Email: xzyin@mail.shcnc.ac.cn.
Jiwen Zhang, Email: jwzhang@simm.ac.cn.
References
- 1.Li M., Rouaud O., Poncelet D. Microencapsulation by solvent evaporation: state of the art for process engineering approaches. Int J Pharm. 2008;363(1–2):26–39. doi: 10.1016/j.ijpharm.2008.07.018. [DOI] [PubMed] [Google Scholar]
- 2.Kumar M.N.V.R. Nano and microparticles as controlled drug delivery devices. J Pharm Pharm Sci. 2000;3(2):234–258. [PubMed] [Google Scholar]
- 3.Du L., Cheng J.P., Chi Q. Biodegradable PLGA microspheres as a sustained release system for a new luteinizing hormone-releasing hormone (LHRH) antagonist. Chem Pharm Bull. 2006;54(9):1259–1265. doi: 10.1248/cpb.54.1259. [DOI] [PubMed] [Google Scholar]
- 4.Giteau A., Venier-Julienne M.C., Marchal S. Reversible protein precipitation to ensure stability during encapsulation within PLGA microspheres. Eur J Pharm Biopharm. 2008;70(1):127–136. doi: 10.1016/j.ejpb.2008.03.006. [DOI] [PubMed] [Google Scholar]
- 5.Montalvo-Ortiz B.L., Sosa B., Griebenow K. Improved enzyme activity and stability in polymer microspheres by encapsulation of protein nanospheres. AAPS PharmSciTech. 2012;13(2):632–636. doi: 10.1208/s12249-012-9794-3. [DOI] [PMC free article] [PubMed] [Google Scholar]
- 6.Karal-Yilmaz O., Serhatli M., Baysal K. Preparation and in vitro characterization of vascular endothelial growth factor (VEGF)-loaded poly(D,L-lactic-co-glycolic acid) microspheres using a double emulsion/solvent evaporation technique. J Microencapsul. 2011;28(1):46–54. doi: 10.3109/02652048.2010.523795. [DOI] [PubMed] [Google Scholar]
- 7.Jelvehgari M., Barar J., Valizadeh H. Formulation, characterization and in vitro evaluation of theophylline-loaded Eudragit RS 100 microspheres prepared by an emulsion-solvent diffusion/evaporation technique. Pharm Dev Technol. 2011;16(6):637–644. doi: 10.3109/10837450.2010.508075. [DOI] [PubMed] [Google Scholar]
- 8.Chen J.L., Chiang C.H., Yeh M.K. The mechanism of PLA microparticle formation by water-in-oil-in-water solvent evaporation method. J Microencapsul. 2002;19(3):333–346. doi: 10.1080/02652040110105373. [DOI] [PubMed] [Google Scholar]
- 9.Chen J.L., Yeh M.K., Chiang C.H. The mechanism of surface-indented protein-loaded PLGA microparticle formation: the effects of salt (NaCl) on the solidification process. J Microencapsul. 2004;21(8):877–888. doi: 10.1080/02652040400015387. [DOI] [PubMed] [Google Scholar]
- 10.Rosca I.D., Watari F., Uo M. Microparticle formation and its mechanism in single and double emulsion solvent evaporation. J Control Release. 2004;99(2):271–280. doi: 10.1016/j.jconrel.2004.07.007. [DOI] [PubMed] [Google Scholar]
- 11.Wang S.B., Guo S.R. Formation mechanism and release behavior of poly(epsilon-caprolactone) microspheres containing disodium norcantharidate. Eur J Pharm Biopharm. 2008;69(3):1176–1181. doi: 10.1016/j.ejpb.2008.02.020. [DOI] [PubMed] [Google Scholar]
- 12.Vazhayal L., Talasila S., Azeez P.M.A. Mesochanneled hierarchically porous aluminosiloxane aerogel microspheres as a stable support for pH-responsive controlled drug release. ACS Appl Mater Inter. 2014;6(17):15564–15574. doi: 10.1021/am504422z. [DOI] [PubMed] [Google Scholar]
- 13.Zhao X.B., Liu P. pH-Sensitive fluorescent hepatocyte-targeting multilayer polyelectrolyte hollow microspheres as a smart drug delivery system. Mol Pharm. 2014;11(5):1599–1610. doi: 10.1021/mp400774v. [DOI] [PubMed] [Google Scholar]
- 14.Pivette P., Faivre V., Mancini L. Controlled release of a highly hydrophilic API from lipid microspheres obtained by prilling: analysis of drug and water diffusion processes with X-ray-based methods. J Control Release. 2012;158(3):393–402. doi: 10.1016/j.jconrel.2011.11.027. [DOI] [PubMed] [Google Scholar]
- 15.Yang S., Yin X.Z., Wang C.F. Release behaviour of single pellets and internal fine 3D structural features co-define the in vitro drug release profile. AAPS J. 2014;16(4):860–871. doi: 10.1208/s12248-014-9611-x. [DOI] [PMC free article] [PubMed] [Google Scholar]
- 16.Huang X.Z., Li N., Wang D.J. Quantitative three-dimensional analysis of poly (lactic-co-glycolic acid) microsphere using hard X-ray nano-tomography revealed correlation between structural parameters and drug burst release. J Pharm Biomed. 2015;112:43–49. doi: 10.1016/j.jpba.2015.04.017. [DOI] [PubMed] [Google Scholar]
- 17.Squillante E., Morshed G., Bagchi S. Microencapsulation of beta-galactosidase with Eudragit L-100. J Microencapsul. 2003;20(2):153–167. [PubMed] [Google Scholar]


