Graphical Abstract
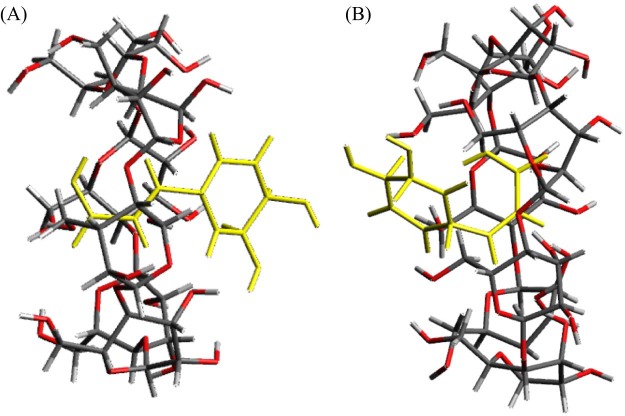
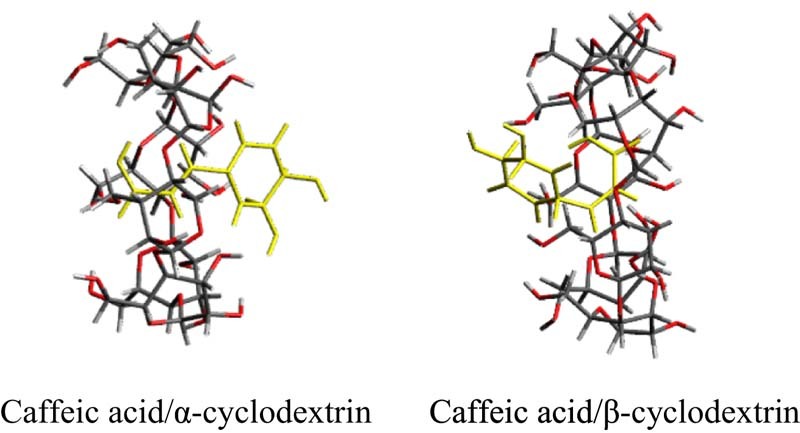
Caffeic acid/α-cyclodextrin (molar ratio = 1/1), the vinylene group of the caffeic acid molecule appears to be included from the wider to the narrower rim of the ring of α-cyclodextrin. Caffeic acid /β-cyclodextrin (molar ratio = 1/1), the aromatic ring of the caffeic acid molecule appears to be included from the wider to the narrower rim of the ring of βCD. This suggests that forms of inclusion differed in the caffeic acid /α-cyclodextrin (molar ratio = 1/1) and the caffeic acid /β-cyclodextrin (molar ratio = 1/1).
Keywords: Caffeic acid, Cyclodextrins, Inclusion, Antioxidant activity, Solubility, Ground mixture
Abstract
In the current study, we prepared a ground mixture (GM) of caffeic acid (CA) with α-cyclodextrin (αCD) and with β-cyclodextrin (βCD), and then comparatively assessed the physicochemical properties and antioxidant capacities of these GMs. Phase solubility diagrams indicated that both CA/αCD and CA/βCD formed a complex at a molar ratio of 1/1. In addition, stability constants suggested that CA was more stable inside the cavity of αCD than inside the cavity of βCD. Results of powder X-ray diffraction (PXRD) indicated that the characteristic diffraction peaks of CA and CD disappeared and a halo pattern was produced by the GMs of CA/αCD and CA/βCD (molar ratios = 1/1). Dissolution testing revealed that both GMs had a higher rate of dissolution than CA alone did. Based on the 1H-1H NOESY NMR spectra for the GM of CA/αCD, the vinylene group of the CA molecule appeared to be included from the wider to the narrower rim of the αCD ring. Based on spectra for the GM of CA/βCD, the aromatic ring of the CA molecule appeared to be included from the wider to the narrower rim of the βCD ring. This suggests that the structures of the CA inclusion complexes differed between those involving αCD rings and those involving βCD rings. Results of a DPPH radical-scavenging activity test indicated that the GM of CA/αCD had a higher antioxidant capacity than that of the GM of CA/βCD. The differences in the antioxidant capacities of the GMs of CA/αCD and CA/βCD are presumably due to differences in stability constants and structures of the inclusion complexes.
1. Introduction
In recent years, cardiovascular diseases have become the second leading cause of death in Japan, after cancer [1]. Therefore, several health foods are being investigated to treat the risk factors of cardiovascular diseases, which include dyslipidemia- and diabetes-induced atherosclerosis. Chlorogenic acid, a coffee polyphenol, is one such health food that has been reported to protect against lifestyle diseases, such as dyslipidemia and diabetes [[2], [3], [4]]. Caffeic acid (CA) is a decomposition product of chlorogenic acid that has the same physiological activity as chlorogenic acid does. Although CA has been reported to protect against dyslipidemia and blood glucose elevation owing to its antioxidant activity, its application is limited by poor water solubility and oral absorption [[5], [6]]. Cyclodextrin (CD) is a ring-shaped molecule consisting of 6, 7, or 8 glucose units for α, β, or γCD, respectively, which are linked by α-(1→4)-glucosidic bonds. In the safety assessment of the Food and Agriculture Organization of the United Nations/World Health Organization (FAO/WHO) Joint Expert Committee on Food Additives (JECFA), the acceptable daily intake (ADI) was set as ‘‘not specified’' for α- and γCD and ‘‘up to 5 mg/kg/day’' for βCD. CD molecules have a hydrophobic cavity in their center that can incorporate various guest molecules to form inclusion complexes [7]. Inclusion within CD is known to stabilize pharmaceuticals [8], and improve their bioavailability by improving their solubility [9]. Various methods, such as coprecipitation [10], kneading [11], and lyophilization [12], have been reported for the preparation of inclusion complexes. Co-grinding, a solvent-free, mechanochemical method of forming inclusion complexes, causes changes in physicochemical properties because of the application of mechanical energy (i.e., by the grinding of the solid material), and has been used for the complexation of piperine, which is poorly water soluble [[13], [14]]. The preparation of (R)-α-lipoic acid and CD inclusion complexes, which is affected by the cavity size of CD, has also been reported [15]. As the steric properties and antioxidant capacity of drugs are reported to be affected by the type of CD [16], it is useful to evaluate the physicochemical properties of inclusion complexes prepared using CDs of different cavity sizes. In addition, CDs have been reported to increase antioxidant capacity by their inclusion of polyphenols, such as chlorogenic acid [17]. However, there is no report of increased antioxidant capacity of CA using CDs. Fundamental research to evaluate the antioxidant capacity of inclusion complexes prepared using CDs of different cavity sizes to improve the antioxidant capacity of CA may have clinical applications. We have already reported the preparation of CA and γCD inclusion complexes by co-grinding and demonstrated that the antioxidant capacity is retained owing to improvement in CA inclusion and elution [18]. Since αCD and βCD have a narrower cavity than γCD does, they may form different inclusion complexes and thus affect the antioxidant capacity of drugs differently. Therefore, in this study, we prepared CA/CD inclusion complexes using αCD and βCD, and evaluated their physicochemical properties, dissolution properties, and antioxidant capacities.
2. Materials and methods
2.1. Materials
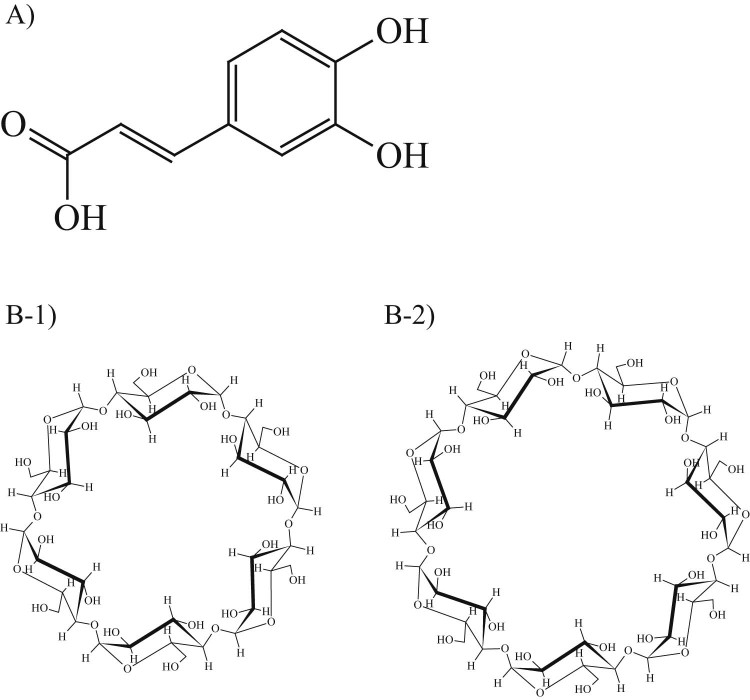
CA (Fig. 1A) was purchased from Wako Pure Chemical Industries Co. Ltd (Japan). αCD and βCD (Fig. 1B) were a generous gift from CycloChem Co. Ltd. (Tokyo, Japan) and were stored at 40 °C and 82% relative humidity for 7 days, prior to use. 2,2-Diphenyl-1-picrylhydrazyl (DPPH) was purchased from Sigma-Aldrich Co. Ltd. All other chemicals and solvents were of analytical grade and were purchased from Wako Pure Chemical Industries Co. Ltd.
Fig. 1.
Chemical structure. (A) Caffeic acid (CA), (B-1) αCyclodextrin (αCD), (B-2) βCyclodextrin (βCD)
2.2. Preparation of the physical mixture (PM) and ground mixture (GM)
The PM was prepared by mixing CA and CD in different molar ratios (2/1, 1/1, and 1/2) using a vortex mixer for 1 min. The GM was prepared by placing the PM (1 g) in an alumina cell and grinding for 60 min using a vibration rod mill (TI-500ET, CMT Co. Ltd., Japan).
2.3. Methods
2.3.1. Phase solubility studies
Phase solubility studies were performed as previously described by Higuchi and Connors [19]. A supersaturated amount of CA (100 mg) was added to an aqueous solution (10 ml) of αCD (0–40 mM) or βCD (0–15 mM), and the mixture was placed in a medium-sized, shaking instrument for 24 h at 200 rpm and 25 ± 0.5 °C. After the suspension reached equilibrium, the solution was immediately filtered through a 0.45 µm membrane filter. The solubility was quantified by high-performance liquid chromatography using a Waters® e2795 separations module (Nippon Waters Co., Ltd., Japan) and Cosmosil 5C18-AR-II packed column (4.6 mm × 150 mm) at a detection wavelength of 285 nm. The sample injection volume was 30 µl, and the column temperature was 40 °C. The mobile phase consisted of distilled water/acetonitrile/methanol/acetic acid (862/113/20/5), and the CA retention time was 10 min. The apparent stability constant (Ks) of the CA/CD inclusion complexes was calculated from the slope of the phase solubility diagram and solubility of CA in the absence of CD (S0) using Equation (1).
| (1) |
2.3.2. Differential scanning calorimetry (DSC)
The thermal behavior of samples was recorded using a differential scanning calorimeter (Thermo plus EVO, Rigaku Co., Japan). All samples were weighed (2 mg) and heated at a scanning rate of 5.0 °C/min under nitrogen flow (60 ml/min). Aluminum pans and lids were used for all samples.
2.3.3. Powder X-ray diffraction (PXRD)
PXRD studies were performed using a powder X-ray diffractometer (MiniFlex II, Rigaku Co., Japan) with Cu Kα radiation (30 kV, 15 mA). The diffraction intensity was measured using a NaI scintillation counter. The samples were scanned from 2θ = 3–35° at a scan rate of 4°/min. The powder sample was spread on a glass plate to maintain a flat sample plane, and measurements were performed.
2.3.4. Fourier transform infrared (FTIR) spectroscopy
The FTIR spectra of samples were recorded using an FTIR spectrometer (FT/IR-410, JASCO Inc., Japan) by the potassium bromide (KBr) disk method. The samples were scanned 32 times over a range of 650-4000 cm−1 with a resolution of 4 cm−1. The tablets were prepared by adding KBr to the sample (sample/KBr = 1/10 (w/w)) and manually compressing the mixture. Background correction was performed using a blank KBr tablet.
2.3.5. Measurement of 1H-1H nuclear overhauser effect spectroscopy (NOESY) NMR spectra
The NOESY spectra were recorded on a 700 MHz Varian NMR spectrometer (Agilent Technologies) under the following conditions: solvent: D2O; resonant frequency: 699.6 MHz; pulse width: 90°; relaxation delay: 0.500 s; scan time: 0.500 s; temperature: 25 °C; 256 increments.
2.3.6. Dissolution profile
Dissolution testing of samples was performed using a dissolution apparatus (NTR-593, Toyama Sangyo Co. Ltd., Japan) with 900 ml of distilled water at 37 ± 0.5 °C and 50 rpm, according to the paddle method (Japanese Pharmacopoeia 17th Edition). CA (100 mg) was weighed accurately and loaded into the paddle apparatus. Dissolved samples (10 ml) were collected at 5, 10, 15, 30, 60, 90, and 120 min through 0.45 µm membrane filters, with replacement of an equal volume of fresh dissolution medium at the same temperature, to maintain a constant volume of dissolution medium. The concentration of CA in the samples was determined by the same method as described for the phase solubility studies (Section 2.3.1).
2.3.7. DPPH radical scavenging activity
The DPPH radical scavenging activity of the samples was measured using a microplate reader (SpectraMax 190, Molecular Devices, Japan). Briefly, each sample and DPPH methanolic solution (100 µM) were mixed in a microplate at a ratio of 1/1 (v/v) and incubated at 25 °C for 5 min. The absorbance of DPPH in samples (As) was measured at 517 nm. The absorbance of a mixture of methanol/water (1/1 (v/v)) (Br), which has a radical removal rate of 100%, and a mixture of DPPH/water (1/1 (v/v)) (A0), which has a radical removal rate of 0%, was also measured. The radical scavenging rate was calculated using Equation (2) [17].
3. Results and discussion
3.1. Phase solubility studies
Phase solubility studies were conducted to assess the molar ratio of the CA/CD inclusion complexes and their stability constants in an aqueous solution. Results of the solubility testing indicated that the solubility of CA increased linearly for αCD and βCD, producing an AL type of phase solubility diagram according to the classification system of Higuchi and Connors [19], (Fig. 2). Typically, an AL diagram indicates that a complex is formed at a molar ratio of 1/1 [20], so both CA/αCD and CA/βCD formed a complex at a molar ratio of 1/1 in solution. The stability constant (Ks) was determined next. Ks was 1547.5 M−1 for αCD and 371.4 M−1 for βCD (Table 1). A study by Iacovino et al. reported that, when a complex has a stability constant exceeding 1000 M−1, the guest molecule and CD are unlikely to dissociate [21]. CA included in αCD had a stability constant of 1547.5 M−1, so CA was more stable inside the cavity of αCD than it was inside the cavity of βCD.
Fig. 2.
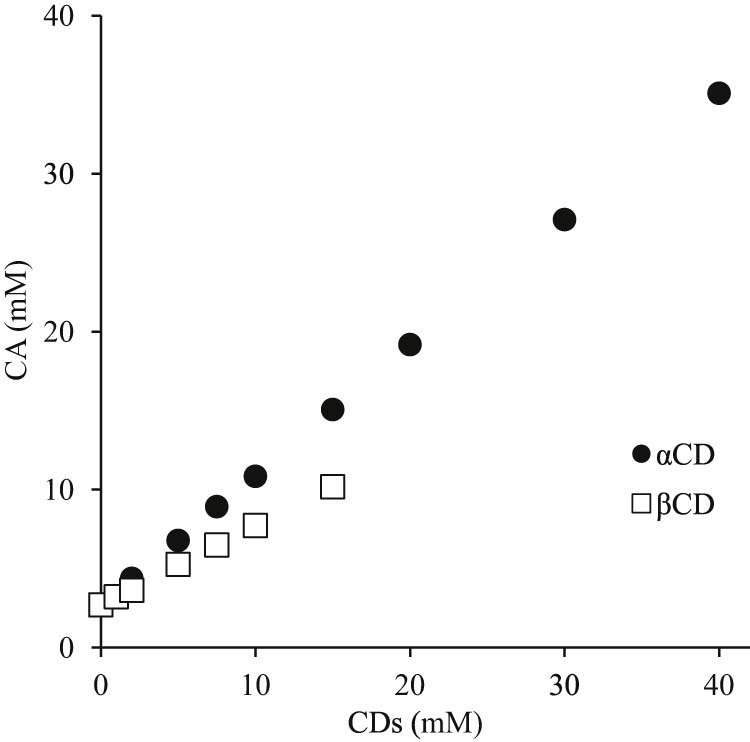
Phase solubility diagram of CA/CDs. Results are expressed as means ± SD (n = 3).
Table 1.
Apparent stability constant (Ks) of CA inclusion complexes.
| CA complex | Ks ± SD (M−1) |
|---|---|
| αCD | 1547.5 ± 30.9 |
| βCD | 371.4 ± 6.22 |
| γCD | 391.2 ± 25.8 |
3.2. Differential scanning calorimetry (DSC)
Phase solubility diagrams suggested that both CA/αCD and CA/βCD formed a complex at a molar ratio of 1/1 in an aqueous solution. When CA/αCD and CA/βCD are ground together, they presumably still form an inclusion complex at a molar ratio of 1/1. It has been reported that when a guest molecule does not melt or its peak shifts as a result of inclusion complex formation caused by co-grinding, changes in its thermal behavior become evident [22]. Thus, DSC was performed in the current study to examine the thermal behavior of the GMs. Results of DSC revealed an endothermic peak due to melting at 223 °C for intact CA (Fig. 3A). The PM of CA/αCD (molar ratio = 1/1) had an endothermic peak due to the melting of CA at 210 °C, and the PM of CA/βCD (molar ratio = 1/1) had an endothermic peak due to the melting of CA at 216 °C, so CA crystals were presumably present (Fig. 3B and F). The GM of CA/αCD (molar ratio = 2/1) had an endothermic peak due to CA at 207 °C (Fig. 3C). The endothermic peak due to CA disappeared for the GM of CA/αCD at molar ratios of 1/1 and 1/2 (Fig. 3D and E). The GM of CA/βCD (molar ratio = 2/1) had an endothermic peak due to CA at 197 °C (Fig. 3G). The endothermic peak due to CA disappeared for the GM of CA/αCD at molar ratios of 1/1 and 1/2 (Fig. 3H and I). In our previous study, the disappearance of the CA melting peak was confirmed by DSC measurement for the GM of the CA/γCD complex [18]. Therefore, the GMs of CA/αCD and CA/βCD are also considered inclusion complexes. The endothermic peak due to CA disappeared because the CA and αCD molecules and the CA and βCD molecules formed inclusion complexes. The GM of CA/αCD (molar ratio = 2/1) and the GM of CA/βCD (molar ratio = 2/1) showed an endothermic peak due to CA. The reason may be that there was excess CA that did not complex with the CDs. This suggests that both CA/αCD and CA/βCD were present in the GMs at a molar ratio of CA/CD of 1/1.
Fig. 3.
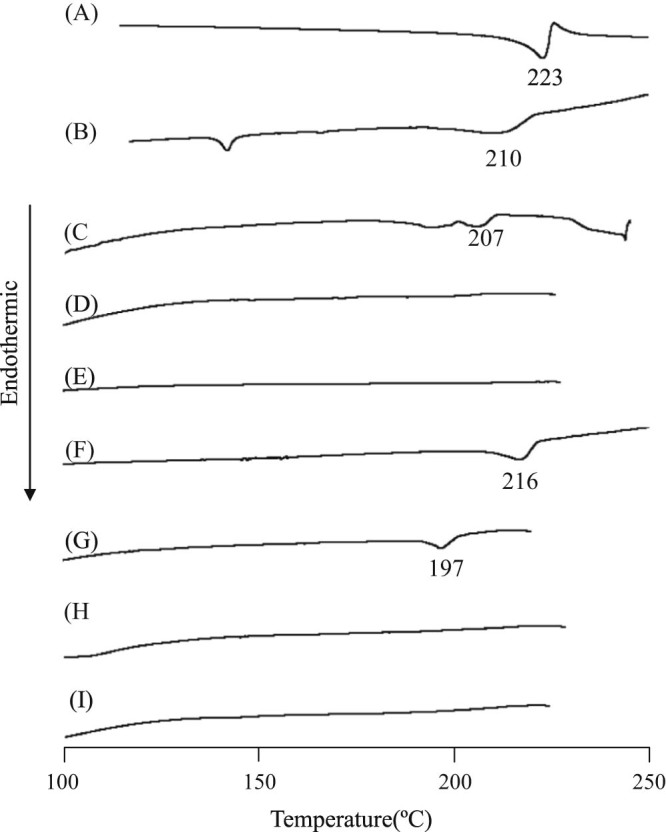
DSC curves of CA/CD systems. (A) CA intact, (B) PM (CA/αCD = 1/1), (C) GM (CA/αCD = 2/1), (D) GM (CA/αCD = 1/1), (E) GM (CA/αCD = 1/2), (F) PM (CA/βCD = 1/1), (G) GM (CA/βCD = 2/1), (H) GM (CA/βCD = 1/1), (I) GM (CA/βCD = 1/2)
3.3. Powder X-ray diffraction (PXRD)
The results of DSC suggested that CA could form an inclusion complex with either αCD or βCD at a stoichiometric ratio of 1/1. Thus, PXRD was performed to examine the crystalline state of the CA/CDs in the GMs. Intact CA and ground CA had a characteristic diffraction peak at 2θ = 26.9°, αCD had a characteristic diffraction peak at 2θ = 11.8°, and βCD had a characteristic diffraction peak at 2θ = 12.3° (Fig. 4A, C and I). The PM of CA/αCD (molar ratio = 1/1) and PM of CA/βCD (molar ratio = 1/1) had diffraction peaks due to CA at 2θ = 26.9°, αCD at 2θ = 12.1°, and βCD at 2θ = 12.3° (Fig. 4E and K). The GM of CA/αCD (molar ratio = 2/1) had a diffraction peak due to CA at 2θ = 26.9°, but the peak disappeared and a halo pattern was produced with the GM of CA/αCD at molar ratios of both 1/1 and 1/2 (Fig. 4F, G and H). The GM of CA/βCD (molar ratio = 2/1) had a diffraction peak due to CA at 2θ = 26.9°, but the peak disappeared and a halo pattern was produced by the GM of CA/βCD at molar ratios of both 1/1 and 1/2 (Fig. 4L, M and N). A halo pattern has been confirmed in the GM of the CA/γCD complex [18]. The GM of CA/αCD and CA/βCD also has similar patterns, which suggests that they form inclusion complexes. Co-grinding disrupts the structures of crystals, and these amorphous solids can produce a halo pattern [23]. A previous study has reported that supplying mechanical energy by grinding and friction can result in the formation of amorphous inclusion complexes [14]. The GMs of CA/αCD and CA/βCD (both molar ratios of 2/1) had an endothermic peak due to CA. The reason may be that excess CA exists outside the CD complexes. This suggests that both CA/αCD and CA/βCD in a GM (molar ratio = 1/1) form an inclusion complex.
Fig. 4.
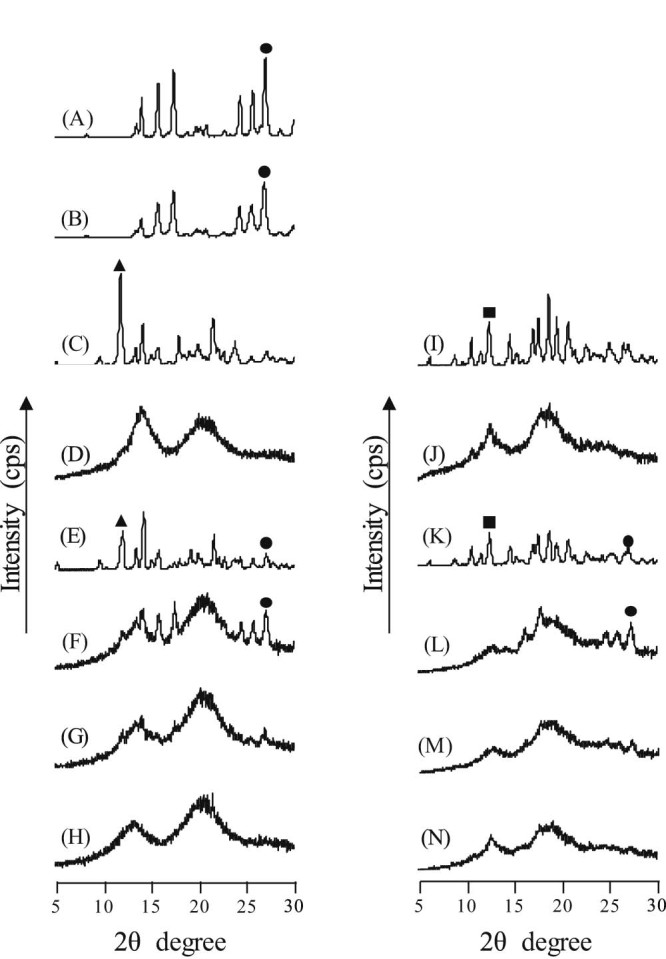
PXRD patterns of CA/CDs. (A) CA intact, (B) CA ground, (C) αCD, (D) αCD ground, (E) PM (CA/αCD = 1/1), (F) GM (CA/αCD = 2/1), (G) GM (CA/αCD = 1/1), (H) GM (CA/αCD = 1/2), (I) βCD, (J) βCD ground, (K) PM (CA/βCD = 1/1), (L) GM (CA/βCD = 2/1), (M) GM (CA/βCD = 1/1), (N) GM (CA/βCD = 1/2)
3.4. Fourier transform infrared (FTIR) spectroscopy
FTIR spectroscopy was performed in order to examine the molecular state of the complexes in a solid state. The intact CA had a peak due to the OH groups of its aromatic ring at 3433 cm−1. A peak due to the carbonyl group (C = O) was produced at 1644 cm−1, and a peak due to the aromatic ring (C = C) was produced at 1622 cm−1 (Fig. 5A). In the PM of CA/αCD (molar ratio = 1/1) and the PM of CA/βCD (molar ratio = 1/1), the OH groups from the aromatic ring in the CA molecule produced a peak at 3433 cm−1, the carbonyl group (C = O) produced a peak at 1644 cm−1, and the aromatic ring (C = C) produced a peak at 1622 cm−1 (Fig. 5D and E). In the GM of CA/αCD (molar ratio = 1/1) and the GM of CA/βCD (molar ratio = 1/1), the O-H stretching band attributed to the hydroxyl groups of the aromatic ring in the CA molecules were still observed at the same position as with the CA crystals. However, the peaks assigned to aromatic ring (C-C) and the carbonyl group of CA were significantly shifted to 1622 and 1685 cm−1, respectively. The results suggest a molecular interaction between the CA and CD molecules (Fig. 5F and G). Shifts in the CA aromatic rings and carbonyl group peaks have already been confirmed in the GM of CA/γCD complexes [18]. The GMs of CA/αCD and CA/βCD have similar peak shifts, which suggest that they also form inclusion complexes. CA is known to form a dimeric structure as a result of intermolecular hydrogen bonding between the carbonyl group (C = O) of one carboxylic acid and the hydroxyl group (-OH) of another [24]. Higashi et al. reported that complex formation by molecules with this dimeric structure causes hydrogen bonds between molecules to dissociate, resulting in an upward shift in the peak due to carbonyl groups (C = O) [25]. Thus, molecular interaction is presumably occurring between CA and αCD and between CA and βCD in the GMs (both molar ratios of 1/1) in the solid state. Since the peak corresponding to the hydroxyl groups (-OH) of the aromatic ring of CA at 3433 cm−1 did not change, the CD cavity and OH groups of CA presumably do not interact in the GM of CA/αCD or in the GM of CA/βCD (both molar ratios of 1/1).
Fig. 5.
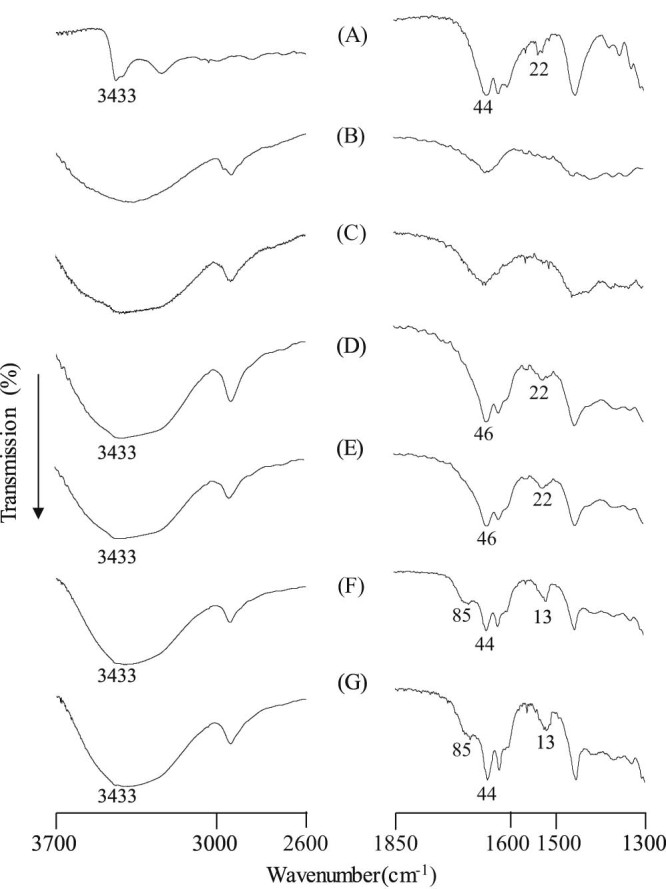
FTIR spectra of CA/CD systems. (A) CA intact, (B) αCD, (C) βCD, (D) PM (CA/αCD = 1/1), (E) PM (CA/βCD = 1/1), (F) GM (CA/αCD = 1/1), (G) GM (CA/βCD = 1/1)
3.5. Dissolution profile
The results of the DSC, PXRD, and FTIR spectra suggest that CA and αCD as well as CA and βCD in the GMs (both at molar ratios of 1/1) form an inclusion complex in the solid state. Thus, dissolution testing was performed next to ascertain changes in the dissolution behavior of CA as a result of the formation of the inclusion complexes. Test samples were intact CA, ground CA, PM of CA/αCD, PM of CA/βCD, GM of CA/αCD, and GM of CA/βCD (all mixtures at molar ratios of 1/1). The dissolution rate of CA after 5 min was 24% for intact CA and 23% for ground CA, so both had a slow rate of dissolution (Fig. 6). The dissolution rate of CA after 5 min was 37% for the PM of CA/αCD and 59% for the PM of CA/βCD, so the PMs showed a higher rate of dissolution than that of the intact CA. The dissolution rate of CA after 5 min was 100% for both the GM of CA/αCD and the GM of CA/βCD, so the GMs demonstrated improved dissolution in comparison to that of intact CA and the PMs. It has been reported that disrupting the molecular arrangement of a drug by rendering it amorphous and inclusion complex formation were possible mechanisms of enhanced dissolution [[26], [27]]. The results of the PXRD revealed that CA was amorphous, and they indicated inclusion complex formation (Fig. 2). The FTIR spectra revealed the interaction between the aromatic ring of CA (which is a hydrophobic group) and the CDs. Thus, multiple factors, such as CA in an amorphous form and inclusion complex formation, help improve the elution of CA in CA/CDs. The improved dissolution in the PM of CA/αCD and in the PM of CA/βCD (both molar ratios of 1/1) was presumably due to the formation of inclusion complexes in an aqueous solution. In addition, improvement of dissolution was confirmed in the GM of the CA/γCD complex [18]. Similarly, the GM of CA/αCD and the GM of CA/βCD have improved solubility. It is likely that the formation of inclusion complexes contributes to the dissolution property.
Fig. 6.
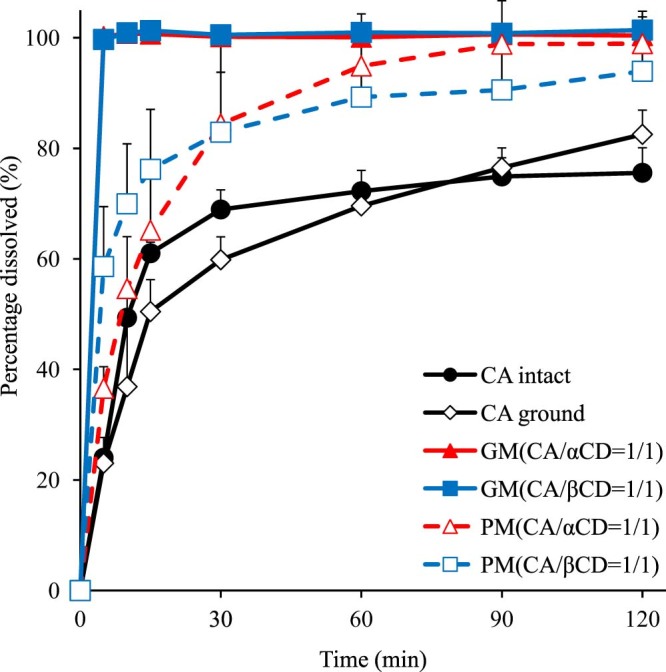
Dissolution profiles of CA/CD systems. Results are expressed as means ± SD (n = 3).
3.6. Measurement of 1H-1H nuclear Overhauser effect spectroscopy (NOESY) NMR spectra
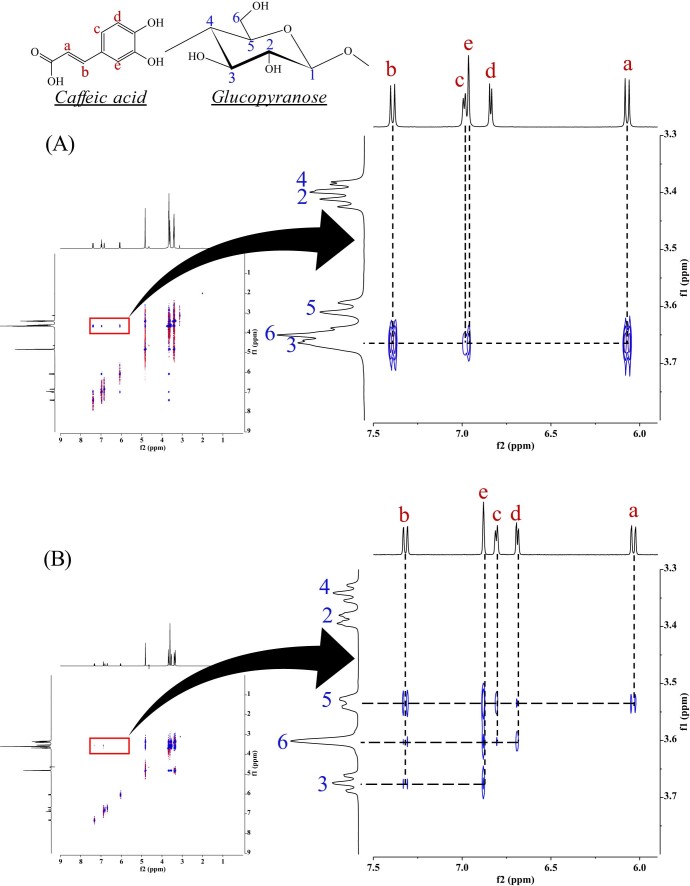
The results of the dissolution tests revealed that the GMs had an improved rate of dissolution compared to that of intact CA. The molecular interaction between CA and αCD and between CA and βCD (both molar ratios of 1/1) in the GMs in solution may affect their solubility. 1H-1H NOESY NMR spectroscopy was performed to examine these molecular interactions in detail. 1H-1H NOESY NMR spectroscopy can reveal spatial interactions between a guest molecule and the CD cavity, so it is used to predict the positioning of the guest molecule within the inclusion complex [28]. In the GM of CA/αCD (molar ratio = 1/1), the H-3 proton (3.66 ppm) in the CD cavity, the H-a proton (6.08, 6.06 ppm) and H-b proton (7.38, 7.40 ppm) of the vinylene group of CA, and the H-c proton (6.98, 6.99 ppm) and H-e proton (6.96 ppm) of the aromatic ring produced cross peaks (Fig. 7A). The H-a and H-b protons of the vinylene group of CA and the H-3 proton in the cavity of αCD in particular produced intense cross peaks. Typically, the H-3 proton is found at the wider rim of the ring of CD and the H-6 proton is found at the narrower rim of the ring of CD [28]. The appearance of cross peaks indicates that the distance between protons is less than 4Å, and a more intense peak indicates a smaller distance [29]. Thus, the vinylene group of the CA molecule appears to be oriented from the wider to the narrower rim of the αCD ring (Fig. 8A). In the GM of CA/βCD (molar ratio = 1/1), cross peaks were produced by H-3 (3.67 ppm), H-5 (3.53, 3.54 ppm), and H-6 (3.60 ppm) in the cavity, by H-a (6.02, 6.05 ppm) and H-b (7.31, 7.33 ppm) in the vinylene group of CA, and by H-c (6.80, 6.81 ppm), H-d (6.68, 6.69 ppm), and H-e (6.88 ppm) in the aromatic ring (Fig. 7B). In the GM of CA/βCD, intense cross peaks were produced by H-b in the vinylene group of CA, by H-e in the aromatic ring, and by H-5 in the cavity of βCD. No cross peaks were produced by H-c or H-d in the benzene ring or by H-3 in the cavity of βCD. Thus, the aromatic ring of the CA molecule appears to be oriented from the wider to the narrower rim of the ring of βCD (Fig. 8B). The results of the FTIR revealing an interaction between the aromatic ring and vinylene group of the CA and the CDs has been confirmed. This result suggests that the inclusion complex of the GM CA/CDs also involves interactions of the aromatic ring and vinylene group of CA similar to that observed in aqueous solution. In the GM of CA/αCD (molar ratio = 1/1), the aromatic ring was partially included, while the aromatic ring was completely included in the GM of CA/βCD (molar ratio = 1/1). In the CA/γCD complex, there was a strong cross peak between the proton derived from the aromatic ring of the CA molecule and the narrow edge of γCD [18]. Thus, the aromatic ring of the CA molecule appears to be oriented from the wider to the narrower rim of the ring of γCD. This result suggests that the GM of CA/αCD has a different inclusion form compared to that of CA/βCD and CA/γCD.
Fig. 7.
1H-1H NOESY NMR spectra of CA/CD systems. (A) GM (CA/αCD = 1/1), (B) GM (CA/βCD = 1/1)
Fig. 8.
Proposed structural images of CA/CDs complex. (A) side view of GM (CA/αCD), (B) side view of GM (CA/βCD)
3.7. DPPH radical scavenging test
It has been reported that inclusion complex formation increases antioxidant capacity [17]. The presence of a guest molecule in a CD molecule results in increased electron density, resulting in a greater likelihood that the guest molecule will release protons as radicals to quench the DPPH radical. Thus, a DPPH radical-scavenging activity test was conducted to assess antioxidant capacity in the GM of CA/αCD (molar ratio = 1/1) and the GM of CA/βCD (molar ratio = 1/1). The results of this test indicate that the 50% inhibitory concentration (IC50) of DPPH radical scavenging was 2.57 µg/ml for intact CA, 1.42 µg/ml for the GM of CA/αCD, and 1.77 µg/ml for the GM of CA/βCD (Fig. 9). The IC50 was significantly lower for the GMs of CA/αCD and CA/βCD (both molar ratios of 1/1) compared to that of intact CA, and increased antioxidant capacity was noted. The GM of CA/αCD (molar ratio = 1/1) tended to have higher antioxidant capacity. This might be explained by the stability constant in aqueous solution affecting the antioxidant capacity; the results of solubility testing indicated that CA/αCD had a higher stability constant than CA/βCD did [30]. 1H-1H NOESY NMR spectra revealed that the form of the inclusion complex in the GM of CA/αCD (molar ratio = 1/1) was different from that of the GM of CA/βCD (molar ratio = 1/1) (Fig. 7). Additionally, βCD has a more hydrophobic cavity than αCD does [31]. Thus, the form of the CA inclusion in the GM of CA/βCD involves capture of the aromatic ring. In the GM of CA/αCD, the inclusion primarily involves the vinylene group and not the aromatic ring. The antioxidant capacity of CA is due to the hydroxyl groups attached to the aromatic ring, suggesting that the differences in the orientation of the CA within the CD affected the antioxidant capacity [32]. The GM of the CA/γCD complex did not improve antioxidant capacity [18]. The GM of the CA/γCD complex has a lower stability constant than the GM of the CA/αCD complex has, and the CA of the latter is complexed in a manner that captures the aromatic rings. We believe that these two reasons explain the improved antioxidant capacity of the GM of CA/αCD.
Fig. 9.
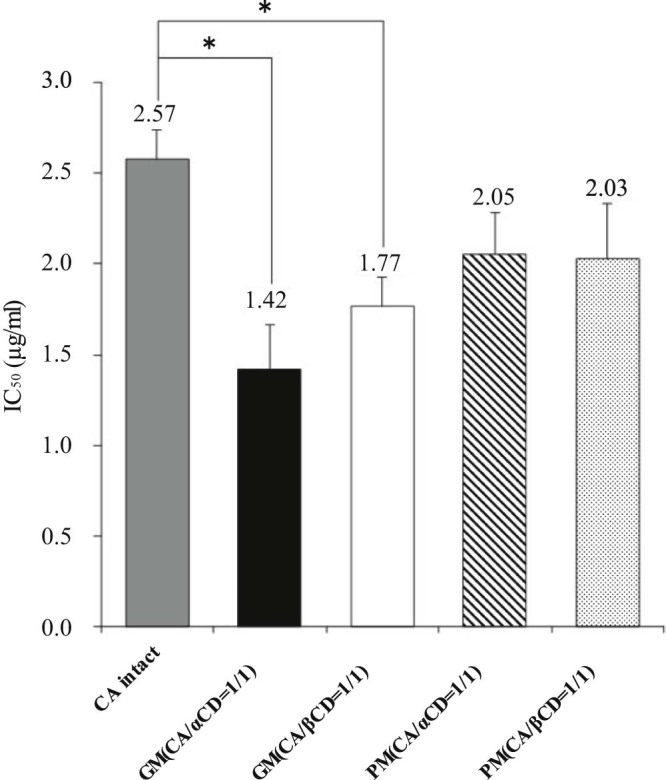
IC50 of DPPH radical scavenging test of CA/CD systems. Results are expressed as means ± SD (n = 3) * P < 0.05 vs CA (Tukey's test).
4. Conclusion
In the current study, phase solubility diagrams indicated that both CA/αCD and CA/βCD form a complex at a molar ratio of 1/1. In addition, the results revealed that CA was accommodated more stably inside the cavity of αCD than inside the cavity of βCD.
The results of the DSC, PXRD, FTIR, and dissolution tests revealed that both CA/αCD and CA/βCD could form a 1/1 inclusion complex with an enhanced dissolution rate through the co-grinding method. 1H-1H NOESY NMR spectra revealed that the orientation of the guest molecule inclusion differed depending on the form of CD. The results of a test of DPPH radical-scavenging activity revealed that differences in stability constants and forms of inclusion affected the antioxidant capacity of CA. These findings indicate that the complexes of CA/αCD and CA/βCD have improved solubility and improved antioxidant capacity, suggesting that CA may warrant increased use in functional foods.
Conflict of interests
This research did not receive any specific grant from funding agencies in the public, commercial, or not-for-profit sectors.
Acknowledgments
The authors are grateful to Cyclo Chem Co., Ltd. for the provision of αCD and βCD.
Footnotes
Peer review under responsibility of Shenyang Pharmaceutical University.
References
- 1.Ministry of Health, Labour and Welfare General Welfare and Labour. 2015. http://www.mhlw.go.jp/english/wp/wp-hw9/dl/01e.pdf Available at:
- 2.Ishikawa A., Yamashita H., Hiemori M. Characterization of inhibitors of postprandial hyperglycemia from the leaves of nerium indicum. J Nutr Sci Vitaminol. 2007;53:166–173. doi: 10.3177/jnsv.53.166. [DOI] [PubMed] [Google Scholar]
- 3.Hemmerle H., Burger H.J., Below P. Chlorogenic acid and synthetic chlorogenic acid derivatives: novel inhibitors of hepatic glucose-6-phosphate translocase. J Med Chem. 1997;40(2):137–145. doi: 10.1021/jm9607360. [DOI] [PubMed] [Google Scholar]
- 4.Ghadieh H.E., Smiley Z.N., Kopfman M.W. Chlorogenic acid/chromium supplement rescues diet-induced insulin resistance and obesity in mice. Nutr Metab. 2015;22:12–19. doi: 10.1186/s12986-015-0014-5. [DOI] [PMC free article] [PubMed] [Google Scholar]
- 5.Jung U.J., Lee M.K., Park Y.B. Antihyperglycemic and antioxidant properties of caffeic acid in db/db mice. J Pharmacol Exp Ther. 2006;318(2):476–483. doi: 10.1124/jpet.106.105163. [DOI] [PubMed] [Google Scholar]
- 6.Natella F., Nardini M., Belelli F. Coffee drinking induces incorporation of phenolic acids into LDL and increases the resistance of LDL to ex vivo oxidation in humans. Am J Clin Nutr. 2007;86(3):604–609. doi: 10.1093/ajcn/86.3.604. [DOI] [PubMed] [Google Scholar]
- 7.Brewster M.E., Loftsson T. Cyclodextrins as pharmaceutical solubilizers. Adv Drug Deliv Rev. 2007;59(7):645–666. doi: 10.1016/j.addr.2007.05.012. [DOI] [PubMed] [Google Scholar]
- 8.Inoue Y., Iohara D., Sekiya N. Ternary inclusion complex formation and stabilization of limaprost, a prostaglandin E1 derivative, in the presence of α- and β-cyclodextrins in the solid state. Int J Pharm. 2016;509(1–2):338–347. doi: 10.1016/j.ijpharm.2016.06.018. [DOI] [PubMed] [Google Scholar]
- 9.Arima H., Yunomae K., Miyake K. Comparative studies of the enhancing effects of cyclodextrins on the solubility and oral bioavailability of tacrolimus in rats. J Pharm Sci. 2001;90(6):690–701. doi: 10.1002/jps.1025. [DOI] [PubMed] [Google Scholar]
- 10.Anselmi C., Centini M., Ricci M. Analytical characterization of a ferulic acid/gamma-cyclodextrin inclusion complex. J Pharm Biomed Anal. 2005;40(4):875–881. doi: 10.1016/j.jpba.2005.08.019. [DOI] [PubMed] [Google Scholar]
- 11.Yáñez C., Cañete-Rosales P., Castillo J.P. Cyclodextrin inclusion complex to improve physicochemical properties of herbicide bentazon: exploring better formulations. PLoS ONE. 2012;7(8):e41072. doi: 10.1371/journal.pone.0041072. [DOI] [PMC free article] [PubMed] [Google Scholar]
- 12.Wang J., Cao Y., Sun B. Characterisation of inclusion complex of trans-ferulic acid and hydroxypropyl-β-cyclodextrin. Food Chem. 2011;124:1069–1075. [Google Scholar]
- 13.Hu Y., Gniado K., Erxleben A. Mechanochemical reaction of sulfathiazole with carboxylic acids: formation of a cocrystal, a salt, and coamorphous solids cryst. Growth Des. 2014;14(2):803–813. [Google Scholar]
- 14.Ezawa T., Inoue Y., Tunvichien S. Changes in the physicochemical properties of piperine/β-cyclodextrin due to the formation of inclusion complexes. Int J Med Chem. 2016 doi: 10.1155/2016/8723139. [DOI] [PMC free article] [PubMed] [Google Scholar]
- 15.Ikeda H., Ikuta N., Nakata D. NMR studies of inclusion complexes formed by (R)-α-lipoic acid with α-, β-, and γ-cyclodextrins. Bull Chem Soc Jpn. 2015;88(8):1123–1127. [Google Scholar]
- 16.Pápay Z.E., Sebestyén Z., Ludányi K. Comparative evaluation of the effect of cyclodextrins and pH on aqueous solubility of apigenin. J Pharm Biomed Anal. 2016;117:210–216. doi: 10.1016/j.jpba.2015.08.019. [DOI] [PubMed] [Google Scholar]
- 17.Chao J., Wang H., Zhao W. Investigation of the inclusion behavior of chlorogenic acid with hydroxypropyl-β cyclodextrin. Int J Biol Macromol. 2012;50:277–282. doi: 10.1016/j.ijbiomac.2011.11.008. [DOI] [PubMed] [Google Scholar]
- 18.Inoue Y., Suzuki K., Ezawa T. Examination of the physicochemical properties of caffeic acid complexed with γ-cyclodextrin. J Incl Phenom Macrocycl Chem. 2015;83:289–298. [Google Scholar]
- 19.Higuchi T., Connors K.A. Phase-solubility techniques. Adv Anal Chem Instrum. 1961;4:117–212. [Google Scholar]
- 20.Göktürk S., Çalışkan E., Talman R.Y. A study on solubilization of poorly soluble drugs by cyclodextrins and micelles:complexation and binding characteristics of sulfamethoxazole and trimethoprim. Sci World J. 2012;2012 doi: 10.1100/2012/718791. 718791. [DOI] [PMC free article] [PubMed] [Google Scholar]
- 21.Iacovino R., Rapuano F., Caso J.V. β-cyclodextrin inclusion complex to improve physicochemical properties of pipemidic acid: characterization and bioactivity evaluation. Int J Mol Sci. 2013;14(7):13022–13041. doi: 10.3390/ijms140713022. [DOI] [PMC free article] [PubMed] [Google Scholar]
- 22.Suzuki R., Inoue Y., Tsunoda Y. Effect of γ-cyclodextrin derivative complexation on the physicochemical properties and antimicrobial activity of hinokitiol. J Incl Phenom Macrocycl Chem. 2015;83:177–186. [Google Scholar]
- 23.Iwata M., Fukami T., Kawashima D. Effectiveness of mechanochemical treatment with cyclodextrins on increasing solubility of glimepiride. Pharmazie. 2009;64(6):390–394. [PubMed] [Google Scholar]
- 24.Xing Y., Peng H.Y., Zhang M.X. Caffeic acid product from the highly copper-tolerant plant Elsholtzia splendens post-phytoremediation: its extraction, purification, and identification. J Zhejiang Univ Sci B. 2012;13:487–493. doi: 10.1631/jzus.B1100298. [DOI] [PMC free article] [PubMed] [Google Scholar]
- 25.Higashi K., Tozuka Y., Moribe K. Salicylic acid/γ-cyclodextrin 2:1 and 4:1 complex Formation by sealed-heating method. J Pharm. 2010;10:4192–4200. doi: 10.1002/jps.22133. [DOI] [PubMed] [Google Scholar]
- 26.Trapani G., Latrofa A., Franco M. Complexation of zolpidem with 2-hydroxypropyl-beta-, methyl-beta-, and 2-hydroxypropyl-gamma-cyclodextrin: effect on aqueous solubility, dissolution rate, and ataxic activity in rat. J Pharm Sci. 2000;89(11):1443–1451. doi: 10.1002/1520-6017(200011)89:11<1443::aid-jps7>3.0.co;2-q. [DOI] [PubMed] [Google Scholar]
- 27.Corciova A., Ciobanu C., Poiata A. Antibacterial and antioxidant properties of hesperidin:β-cyclodextrin complexes obtained by different techniques. J Incl Phenom Macrocycl Chem. 2015;81:71–84. [Google Scholar]
- 28.Inoue Y., Watanabe S., Suzuki R. Evaluation of actarit/γ-cyclodextrin complex prepared by different methods. J Incl Phenom Macrocycl Chem. 2015;81:161–168. [Google Scholar]
- 29.Kirschner D.L., Green T.K. Nonaqueous synthesis of a selectively modified, highly anionic sulfopropyl ether derivative of cyclomaltoheptaose (β-cyclodextrin) in the presence of 18-crown-6. Carbohydr Res. 2005;340:1773–1779. doi: 10.1016/j.carres.2005.04.012. [DOI] [PubMed] [Google Scholar]
- 30.Aytac Z., Uyar T. Antioxidant activity and photostability of α-tocopherol/β-cyclodextrin inclusion complex encapsulated electrospun polycaprolactone nanofibers. Eur Polym J. 2016;79:140–149. [Google Scholar]
- 31.Naidoo K.J., Chen J.Y., Jansson J.L.M. Molecular properties related to the anomalous solubility of β-cyclodextrin. J Phys Chem B. 2004;108(14):4236–4238. [Google Scholar]
- 32.Kfoury M., Landy D., Auezova L. Effect of cyclodextrin complexation on phenylpropanoids' solubility and antioxidant activity. Beilstein J Org Chem. 2014;10:2322–2331. doi: 10.3762/bjoc.10.241. [DOI] [PMC free article] [PubMed] [Google Scholar]


