Abstract
Background/Aim:
Inhibition of apoptosis is one of the hallmarks of cancer, and anti-apoptotic genes are often targets of genetic and epigenetic alterations. Cellular inhibitor of apoptosis 2 (cIAP2) has a role in degrading caspases by linking them to ubiquitin molecules, and is upregulated in triple-negative breast cancer (TNBC). Previous studies have demonstrated that cIAP2 may play a role in the epithelial-to-mesenchymal transition (EMT).
Materials and Methods:
Suberoylanilide hydroxamic acid (SAHA), a histone deacetylase (HDAC) inhibitor, was administered to triple-negative breast cancer (TNBC) cells alone or in combination with epigallocatechin-3-gallate (EGCG), a DNA methyltransferase (DNMT) inhibitor isolated from green tea.
Results:
The compounds were able to decrease the expression of cIAP2 while increasing the expression of pro-apoptotic caspase 7. There were also changes in histone modifications, suggesting a role of epigenetic mechanisms in these changes in expression of cIAP2. These changes resulted in an increase in apoptosis. SAHA and EGCG were also capable of limiting TNBC cell migration across a fibronectin (FN) matrix.
Conclusion:
SAHA and EGCG reduce the metastatic potential in TNBC by inducing the apoptotic pathway.
Keywords: Apoptosis, epithelial-to-mesenchymal transition, breast cancer, cancer epigenetics, DNMT inhibitors, HDAC inhibitors, phytochemicals
Hanahan and Weinberg first described the hallmarks of cancer in 2000, which included the inhibition of apoptosis as one of the key factors that drive cancer progression (1). This list was updated in 2011 and included two additional enabling characteristics, one of which was genome instability and mutation that encompasses epigenetic aberrations (2). This enabling characteristic can easily influence the hallmarks of cancer. The apoptotic pathway is a system of checks and balances, utilizing a suite of caspases to promote the process and baculovirus IAP repeat (BIR) proteins to inhibit the process. They are able to do so through linking pro-apoptotic proteins to ubiquitin molecules (3). Dysregulation of these proteins can allow cancer cells to evade apoptosis (4).
Cellular inhibitor of apoptosis 2 (cIAP2), which is also known as BIRC3, has been shown to be upregulated in cancers, including triple-negative breast cancer (TNBC). TNBCs are typically more refractory to treatment due to the three silenced targets of hormonal cancer therapy: estrogen receptor alpha (ERα), progesterone receptor, and human epidermal growth factor receptor 2 (HER2). In our previous study, we began to elucidate the anti-cancer effects of suberoylanilide hydroxamic acid (SAHA) and epigallocatechin-3-gallate (EGCG) on TNBC cells through the lens of growth potentiation (5). That study has investigated downstream targets of oncogenic miR-221/222 after treatment with SAHA and EGCG in order to determine their abilities to directly restore expression of p27, PTEN, and ERα. After noting the ability of SAHA and EGCG to decrease the expression of miR-221/222, we aimed to investigate other oncogenes that are upregulated in TNBCs. cIAP2 was one of these genes. Jo et al. have linked cIAP2 to an increase in migration in TNBC through the PI3K/Akt pathway, though some studies have found differing results (6, 7). In contrast, we also decided to investigate the expression of pro-apoptotic Caspase 7 (CASP7), which is sterically inhibited by the XIAP protein. Higher levels of CASP7 were found in well-differentiated tumors, including ER-positive breast tumors. This is due to the presence of an estrogen response element located in the promoter region of caspase 7 (8). PTEN acts as a tumor suppressor through its action as PIP3 phosphatase, by which the activity of PI3K is opposed and Akt is dephosphorylated (9). Because we noted a restoration in PTEN expression levels in TNBC cells, we sought to explore the implications of SAHA and EGCG on cellular migration and apoptosis.
Modifications to the cancer epigenome allow many aberrantly expressed genes to be changed at once. Our research laboratory focuses on epigenome-modifying dietary compounds as a means of cancer prevention and treatment (5, 10–13). Though some plant derivatives have been demonstrated to actually increase the risk of cancers, more are exhibiting anticancer effects (14). The present study investigated the most abundant green tea polyphenol, epigallocatetchin-3-gallate (EGCG). Many studies have shown it to be efficacious in breast cancer prevention and treatment (15). EGCG acts as a competitive inhibitor of DNA methyltransferase 1 (DNMT1) and can therefore prevent the methylation of the genome during the S phase of the cell cycle. DNA methylation is generally associated with inactive gene transcription and the formation of heterochromatin. Aberrantly methylated genes can be restored with EGCG administration (16). Despite promising results, many of the concentrations used in studies are not physiologically achievable by diet alone.
Histone deacetylase (HDAC) inhibitors are also able to restore gene expression by preventing the deacetylation of histones. Acetylated histones are generally associated with active gene transcription. Suberoylanilide hydroxamic acid (SAHA) is a synthetic HDAC inhibitor that is FDA-approved for the treatment of cutaneous T-cell lymphoma, but is currently being used in breast cancer clinical trials (17). Peela et al. have noted the ability of SAHA to inhibit cellular migration while decreasing microtubule polarization in the SUM159 TNBC cell line (18). Previous studies have demonstrated that pan-HDAC inhibitors, like SAHA, can also deplete nuclear DNMT1 through ubiquitination and through acetylation of Hsp90, altering the Hsp90-DNMT1 complex through HDAC1 (19).
The combination of DNMT inhibitors with HDAC inhibitors as a means of cancer prevention and treatment has been recently thoroughly studied. For example, studies from our laboratory have combined resveratrol from red wine, which is an HDAC inhibitor, with proanthocyanidins from grapes, genistein from soy, which is DNMT inhibitor, with sulforaphane, which is a strong HDAC inhibitor, withaferin A from Indian winter cherry, which is a DNMT inhibitor, with sulforaphane, and EGCG with sulforaphane. These studies are just a few examples of attempts to elucidate the mechanisms of action behind the dietary phytochemicals’ anti-cancer effects (10–13, 20, 21).
This study aimed to determine if the anti-cancer effects of SAHA and EGCG extend beyond TNBC. Our current findings support the role of SAHA and EGCG in inducing apoptosis and reducing migration in TNBC and the ERα-positive cell line (MCF-7) as a control. We showed that in three TNBC cell lines treatment with the combination of SAHA and EGCG led to an overall decrease in the expression of cIAP2 and an increase in apoptosis. We correlated this to an increase in H3K27me3-specific histone methyltransferase (HMT) activity in the MCF-7 cell line, a decrease in HDAC activity, and a decrease in acetylated histone H3 (AcH3), which could be attributed to changes in histone acetyltransferase (HAT) activity, particularly p300/CBP (22, 23).
Materials and Methods
Cell lines
ERα (+) MCF-7 and ERα (−) MDA-MB-157, MDA-MB-231, and HCC1806 breast cancer cells were used in this study (ATCC, Manassas, VA, USA).
Chemicals
EGCG (≥ 97% pure, HPLC) and SAHA (≥ 98% pure, HPLC) were purchased from Sigma-Aldrich (St. Louis, MO, USA). The compounds were dissolved in dimethyl sulfoxide (DMSO), which was obtained from Sigma-Aldrich. EGCG and SAHA were stored at a stock concentration of 100 mM and 25 mM, respectively, at −20°C.
Cell Culture and Treatment
All cells were cultured as described in the ATCC protocol. MDA-MB-157, MDA-MB-231, and MCF-7 cells were grown in DMEM media (GIBCO, Thermo Fisher Scientific, Waltham, MA, USA). HCC1806 cells were grown in RPMI-1640 medium. The cells were subcultured at 80%–90% confluence and maintained in an incubator at 5% CO2 and 37°C. Cells were allowed to adhere to plates upon seeding for 24 h, after which they were treated over a one or three-day period with SAHA, EGCG, or both at the indicated concentrations. Treatments were administered every 24 h with fresh media. DMSO was used as a vehicle control.
RNA Extraction
Total RNA was extracted by lysing and homogenizing cells. Fifty μl of Life Magnetics beads were added to the samples and mixed by pipetting up and down. Neutralization buffer was added, followed by the subsequent addition of binding buffer according to the manufacturer’s protocol (Life Magnetics, Detroit, MI, USA). The tubes were placed in a magnetic stand, washed several times, and eluted. RNA purity and concentration were quantified using a NanoDrop™.
Protein Extraction
Protein extractions were performed according to the protocol used in the telomerase PCR ELISA (TRAP) kit (Roche applied science, Indianapolis, IN, USA). Cells were centrifuged at 3000 × g for 10 min after washing with PBS, resuspended in 100 μl lysis reagent, and incubated on ice for 30 min. Contents were mixed several times during the incubation period. Cells were centrifuged at 16000×g for 20 min at 4°C, and 100 μl of the supernatant were transferred to a new tube and stored at −80°C until further use.
Reverse Transcription-Polymerase Chain Reaction (RT-PCR)
RT-PCR was used to examine the expression of genes of interest. RNA (10 μl) was reverse-transcribed to cDNA with the iScript™ cDNA Synthesis Kit (Bio-Rad, Hercules, CA, USA). The reaction included also 5 μl 5× iScript Reaction Mix, 1 μl iScript Reverse Transcriptase, and 4 μl nuclease-free water.
Quantitative Real-Time PCR (qRT-PCR)
Real-time PCR was performed using cDNA prepared as described above in order to determine the expression levels of genes of interest. Primers were obtained from Integrated DNA Technologies, Inc. (IDT, Coralville, IA, USA), and sequences are listed in Table I. PCR reactions were completed in triplicate using 1 μl of cDNA for each sample, forward and reverse primers (1 μl each) for the gene of interest, 5 μl of iTaq SYBR green (Bio-Rad), and 2 μl of nuclease-free water to a total volume of 10 μl. Once samples were prepared, they were used in the CFX Connect TM Real-Time PCR Detection System (Bio-Rad). Thermal cycling was initiated at 94°C for 4 min followed by 35 cycles of PCR (94°C, 15 sec; 60°C, 30 sec; 72°C, 30 sec). GAPDH was used as an endogenous control. The relative changes in gene expression were calculated using the following formula: Fold change in gene expression, 2-ΔΔCt =2−[ΔCt (treated samples)–ΔCt (untreated control samples)], where ΔCt=Ct (genes of interest)–Ct (GAPDH) and Ct represents threshold cycle number.
Table I.
qRT-PCR primer sequences.
| Forward Primer Sequences | Reverse Primer Sequences |
|---|---|
|
GAPDH Sense: 5′-ACCACAGTCCATGCCATCAC-3′ |
GAPDH Anti-Sense: 5′-TGCACCCTGTTGCTGTA-3′ |
|
cIAP2 Sense: 5’-TATTTGTGCAACAGCACATTAGGAGT-3’ |
cIAP2 Anti-Sense: 5’-TCTTTCCTCCTGGAGTTTCCA-3’ |
|
Caspase 7 sense: 5’- AGTGACAGGTATGGGCGTTC- 3’ |
Caspase 7 Anti-sense: 5’- CGGCATTTGTATGGTCCTCT- 3’ |
Western Blotting
Western blot of protein extracts was used to determine gene expression at the protein level. Protein extracts were prepared as described above (2.5) and protein concentration was determined with the Bradford method using the Bio-Rad Protein Assay (Bio-Rad). Fifty μg of whole cell protein extracts were loaded onto a NuPAGE™ 4–12% Bis-Tris gel (Life Technologies) and separated by electrophoresis at 150 V until the dye front reached the bottom of the gel. Separated proteins were then transferred to a nitrocellulose membrane using the Trans-Blot Turbo Transfer System (Bio-Rad). Membranes were blocked in 5.0% dry milk in 1× Tris Buffered Saline solution with 0.5% Tween (TBST) for 1 h at room temperature. cIAP2 primary antibody (1:1000) (Product Number 3130S, Cell Signaling Technology, Danvers, MA, USA) incubated overnight at 4°C in 5.0% milk buffer. The SNAP i.d. ® Protein Detection System (EMD Millipore, Burlington, MA, USA) was used for four 10 ml washes with TBST, and then probing was performed with a secondary antibody for 20 min. Following four more washes of 10 ml TBST, incubation in 1.5 ml Clarity TM ECL Western Blotting Substrate (Bio-Rad) was performed. The blot was incubated in the dark for 5 min before visualization with the ChemiDoc TM XRS+ System (Bio-Rad) with Image Lab TM software. Bands were quantified using ImageJ software and normalized to β-actin expression.
ChIP qRT-PCR
Chromatin immunoprecipitation (ChIP) was used to determine the localization of AcH3 to a site of the genome. For ChIP qRT-PCR, cells were fixed, collected, and lysed according to the manufacturer’s protocols (Abcam, Cambridge, MA, USA). Lysed cells were sonicated using a Bioruptor® (Diagenode, Denville, NJ, USA) to achieve the desired DNA fragment length and validated on a 1.5% agarose gel. Immunoprecipitation of chromatin crosslinked to DNA with anti-AcH3 was performed according to the manufacturer’s protocols (Abcam). qRT-PCR was performed as described above (2.7) utilizing the primers listed in Table II.
Table II.
ChIP qRT-PCR primer sequences.
| Forward Primer Sequences | Reverse Primer Sequences |
|---|---|
|
cIAP2 Sense: 5′-TTCAGTAAATGCCGCGAAGAT-3′ |
cIAP2 Anti-Sense: 5′-TGGTTTGCATGTGCACTGGT-3′ |
Nuclear Extraction
Nuclear extracts were prepared by resuspending cell pellets in 1× NE1 solution mixed with DTT solution and PIC as provided by the EpiQuik™ Nuclear Extraction Kit (Epigentek, Farmingdale, NY, USA). Cells were incubated on ice for 10 min and centrifuged for 1 min at 12,000 rpm. The supernatant was carefully removed, and the pellet was resuspended in NE2 containing DTT and PIC. The extract was incubated on ice for 15 min with intermittent vortexing, followed by sonication. The samples were then centrifuged at 14,000 rpm for 10 min at 4°C. The supernatant was transferred to a new vial, and the protein concentration of the nuclear extract was quantified with the Bradford protein assay (Bio-Rad, Hercules, CA, USA).
HDAC Activity
Nuclear extracts were prepared as described above after 72 h of treatment with the indicated compounds, and were analyzed using the Epigenase™ HDAC Activity/Inhibition Direct Assay Kit, Colorimetric (Epigentek). Blank wells were used for comparison, and the manufacturer’s protocol was followed to completion. HDAC activity was calculated in OD/h/mg with the equation: HDAC Activity=[(Sample OD–Blank OD)/(Protein amount (μg) x time (hours of incubation at step 2f))] × 1000.
HMT (H3K27me3) Activity
Nuclear extracts were prepared as described above after 72 h of treatment with the indicated compounds, and were analyzed using the EpiQuik™ Histone Methyltransferase Activity/Inhibition Assay Kit (H3-K27) (Epigentek). Positive control wells were used for comparison, and the manufacturer’s protocol was followed to completion. HMT (H3K27me3) activity was calculated in OD/h/mg using the equation: HMT Activity=[(Sample OD–Blank OD)/(Protein amount (μg) × h (time of incubation at step 3)] × 1000.
Apoptosis
Cells were prepared for apoptosis analysis by resuspending cell pellets in 100 μl 1× Annexin binding buffer as provided by the Tali™ Apoptosis Kit- Annexin V Alexa Fluor™ 488 & Propidium Iodide (Life Technologies). Five μl of Annexin V Alexa Fluor® 488 were added to each sample before incubation in the dark for 20 min. Cells were spun down at 500 rcf for 10 min before resuspending in 100 μl 1× Annexin binding buffer. One μl of Tali® Propidium Iodide was added to each tube before incubating in the dark for 5 min. Samples were taken to the UAB Flow Cytometry Core for analysis.
FN Migration
The cells, 2 × 10³, were seeded on a 96-well Fibronectin Oris™ Cell Migration Assay plate (Platypus Technologies, Madison, WI, USA) and treated for 72 h with the indicated compounds. After 72 h, stoppers were removed from the center of the wells and culture media were replaced in each well. T=0 photos were taken on an EVOS XL Core Cell Imaging System, then the plate was incubated for 24 h to allow time for the cells to migrate into the originally stoppered region. T=24 h photos were taken, and the number of cells that migrated into the center region was counted.
Statistical Analysis
The statistical significance of differences between the values of treated samples and the controls was determined by ANOVA using GraphPad Prism 8. In each case, p<0.05, p<0.01, and p<0.001 were considered statistically significant. Results are presented as [F(degrees of freedom between treatment groups, degrees of freedom within treatment groups) = F statistic, p value]. The larger the F-statistic, the more likely that the null hypothesis will be rejected. Tukey post-hoc tests were performed on all statistically significant ANOVAs to determine which treatment groups were significantly different from each other. The mean (μ) of each treatment group is in parentheses for each Tukey post-hoc comparison.
Drug Combination Quantifications
Drug combination effects were calculated using CompuSyn, which utilizes the Chou-Talalay method. This method calculates a combination index (CI) that reveals synergism (CI<1), additive effect (CI=1), and antagonism (CI>1) in drug combinations (24).
RESULTS
SAHA and EGCG reduce the expression of cIAP2 and increase the expression of caspase 7, both at the mRNA and protein level
Quantitative real-time PCR demonstrated the effects that SAHA and EGCG have on cIAP2 levels within the cell. There was a significant difference between the treatment groups in the expression of cIAP2 in the MDA-MB-157 cell line (F(3, 8)=0.715, p=0.0353). Tukey post-hoc tests revealed that treatment with 3 μM of SAHA (μ=1.239) resulted in significantly higher cIAP2 expression than the combination of 3 μM SAHA +5 μM EGCG (3+5) (μ=0.6887) treatment (p=0.0235). For the MDA-MB-231 cell line there was also a significant difference between the treatment groups for the expression of cIAP2 (F(3,8)=6.262, p=0.0171). Tukey post-hoc tests revealed that the treatment with 3 μM SAHA (1.053) resulted in significantly higher cIAP2 expression than 5 μM EGCG (0.6927) treatment (p=0.0365). ANOVA analysis of the results obtained using the HCC1806 cell line did not reveal significant differences. There was no significant effect of SAHA and EGCG on cIAP2 expression in the MCF-7 cell line (Figure 1A).
Figure 1.
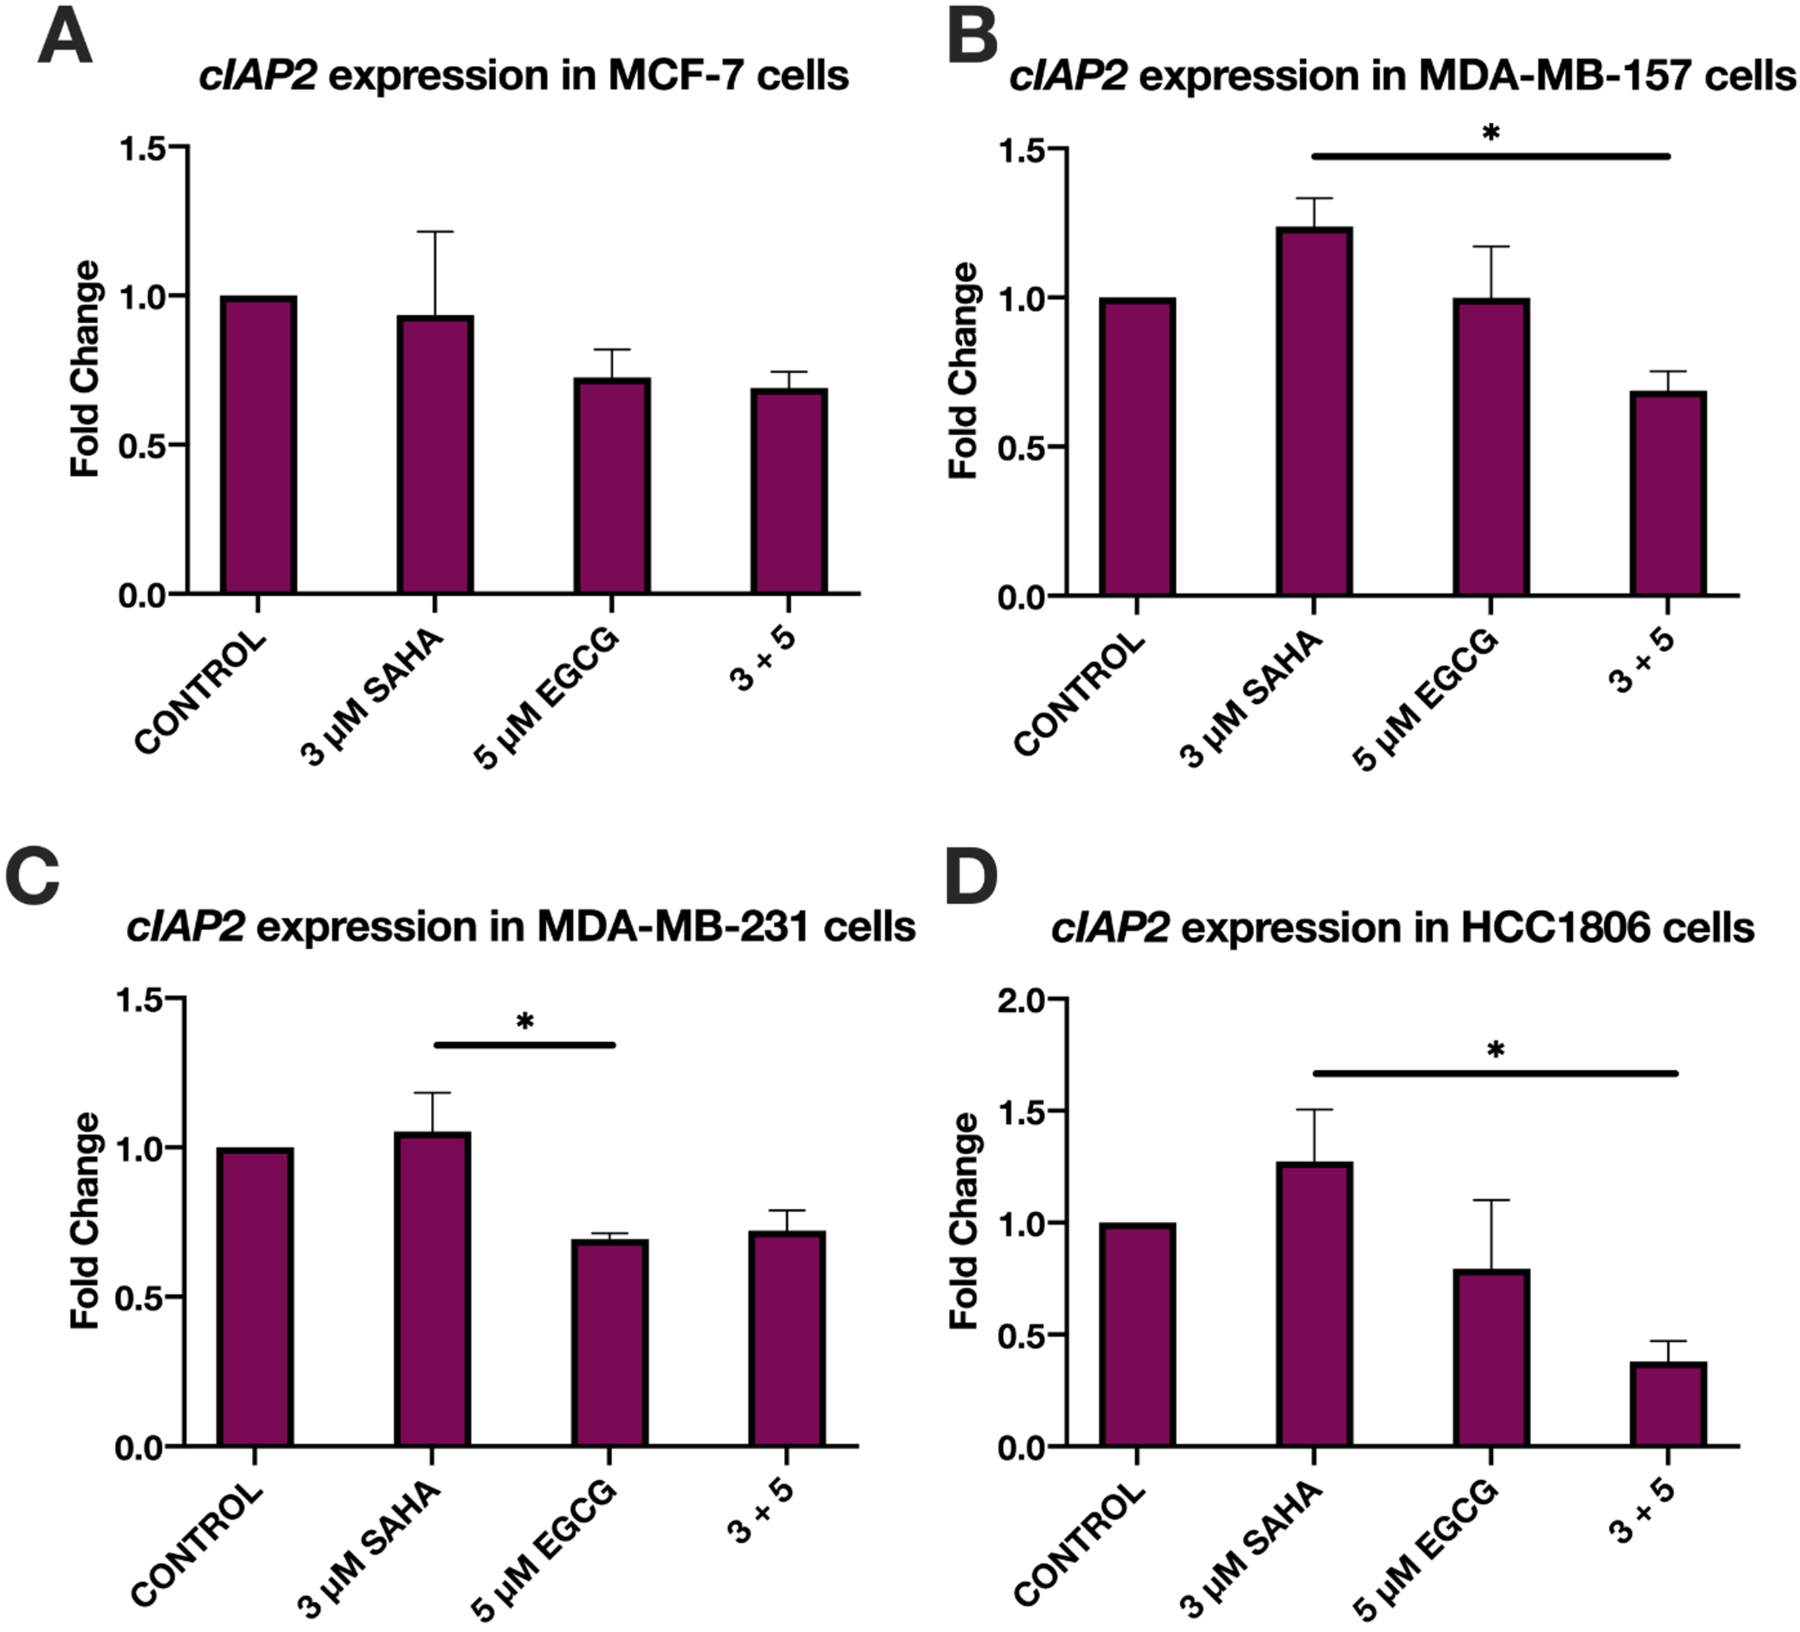
SAHA and EGCG significantly reduced the expression of cIAP2 in two TNBC cell lines. (A) qRT-PCR using cIAP2 primers was performed in MCF-7 cells after 3-day treatments with the indicated compounds (n=3). GAPDH was used for comparison; (B-D) As above, in MDA-MB-157, MDA-MB-231, and HCC1806 cells (n=3). EGCG alone was able to significantly reduce the expression of cIAP2 in MDA-MB-231 cells (C). Error bars represent standard error of the mean (SEM), and ANOVA with Tukey post-hoc tests were performed on all cell lines; * p<0.05.
Protein levels of cIAP2 were also significantly diminished in all four cell lines (Figure 2). In the MCF-7 cell line there was a significant difference between the treatment groups (F(3, 8)=4.190, p=0.0467). Tukey post-hoc tests revealed that the control (1.000) had significantly higher cIAP2 protein levels than the combination of 3+5 (0.3977, p=0.0444). A similar result was obtained in the MDA-MB-157 cells (F(3, 8)=4.932, p=0.0316) and the MDA-MB-231 cells (F(3, 8)=6.920, p=0.0130). While ANOVA analysis of the results obtained in the HCC1806 cell line did not reveal significant differences, Tukey post-hoc tests revealed that the control (1.000) had significantly higher cIAP2 protein levels than 5 μM EGCG (0.3374) treatment (p=0.0461).
Figure 2.
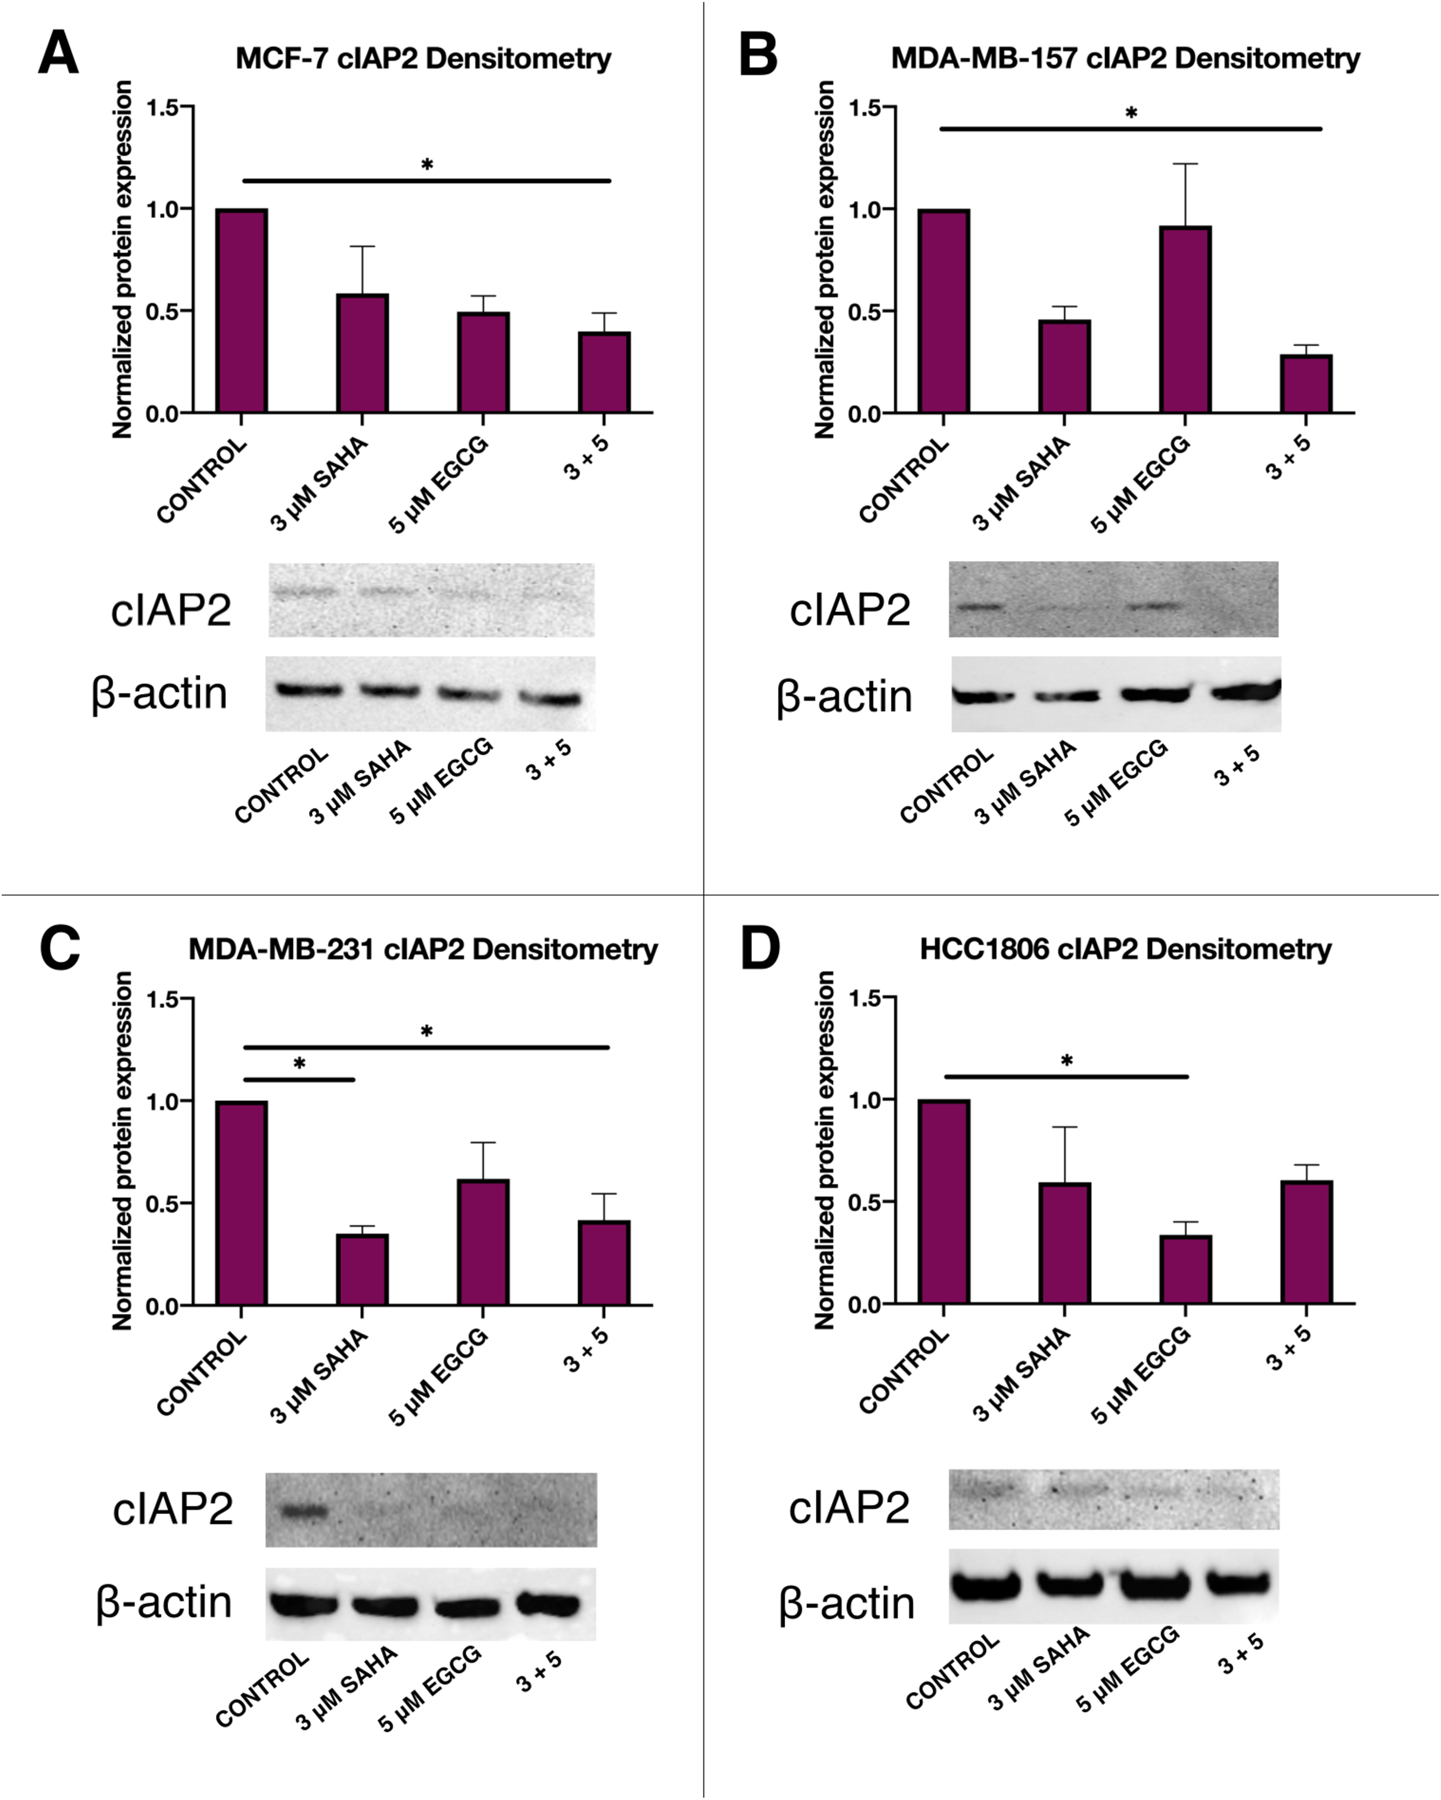
The combination of SAHA and EGCG significantly decreased the expression cIAP2 at the protein level in all four breast cancer cell lines. (A) Combination of SAHA and EGCG significantly reduced the expression of cIAP2 in MCF-7 cells after 72 h of treatment (n=3). (B-D) As above, in MDA-MB-157, MDA-MB-231, and HCC1806 TNBC cell lines (n=3). Protein levels were normalized to the control, and error bars represent standard error of the mean (SEM), and ANOVA with Tukey post-hoc tests were performed on all cell lines; * p<0.05, ** p<0.01.
In order to determine if any epigenetic modifications were responsible for the changes in cIAP2 expression, we conducted chromatin immunoprecipitation (ChIP) analyses on a region of the proximal cIAP2 promoter, previously described by Chang et al. to contain sites for binding the transcriptional activator NF-κB (25). We chose to analyze acetylated histone H3 (AcH3), which is associated with active gene transcription, and noted a significant decrease in the enrichment of AcH3 within the chosen promoter region in two of the TNBC cell lines with the combination of SAHA and EGCG (Figure 3). ANOVA tests revealed a significant difference between the treatment groups in the MDA-MB-157 cell line (F(3, 8)=5.573, p=0.0232) and the MDA-MB-231 cell line (F(3, 8)=7.651, p=0.0130). Tukey post-hoc tests in the MDA-MB-157 cell line revealed a significant reduction in AcH3 within the cIAP2 promoter between the control (1.000), 5 μM EGCG (0.2288), and 3+5 (0.1707) treatments (p=0.0403 and 0.0284, respectively). For the MDA-MB-231 cell line, there was a significant difference between the control (1.000) and the 3+5 (0.3309) treatment (p=0.0489), as well as between 3 μM SAHA (1.193) and 5 μM EGCG (0.4248) and 3 μM SAHA (1.193) and 3+5 (0.3309) treatments (p=0.0435 and 0.0257, respectively).
Figure 3.
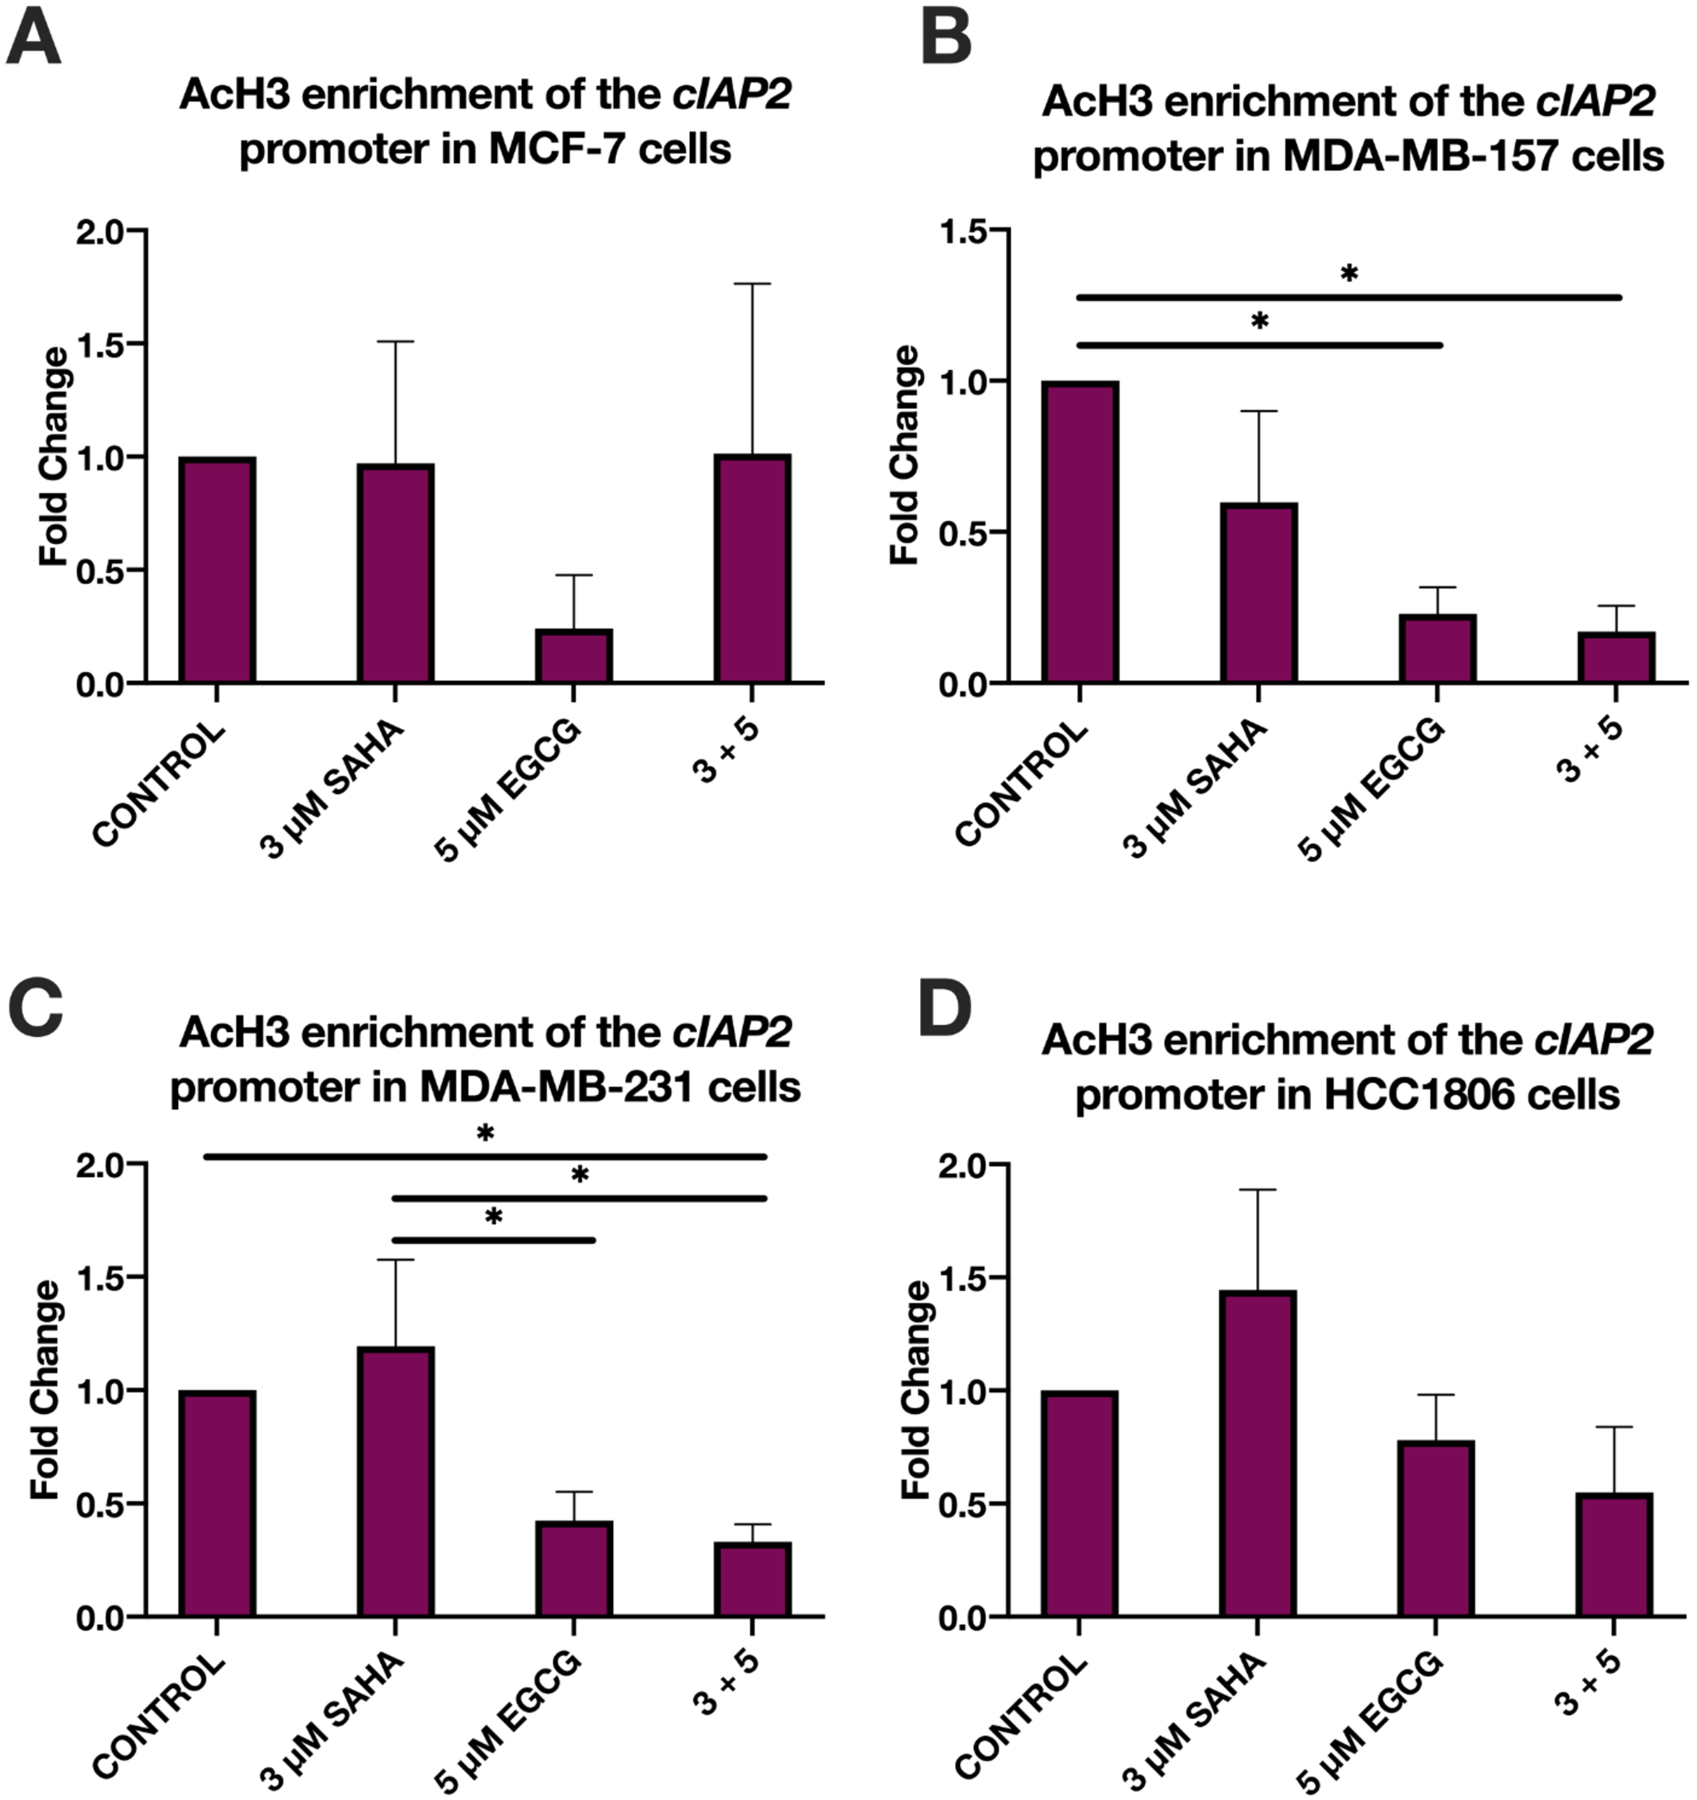
There is a significant decrease in AcH3 enrichment within the cIAP2 promoter region in two TNBC cell lines upon combined treatment with SAHA and EGCG. (A) ChIP qPCR was performed on the MCF-7 cell line using primers (Table II) for the core promoter region of cIAP2 after 3-day treatments with the indicated compounds (n=3). (B-D) As above, in MDA-MB-157, MDA-MB-231, and HCC1806 TNBC cell lines (n=3). Though no significance was found in the HCC1806 cell line, there was a trend for decrease in AcH3 enrichment with combined SAHA and EGCG treatment (D). Error bars represent standard error of the mean (SEM), and ANOVA with Tukey post-hoc tests were performed on all cell lines; * p<0.05.
Because cIAP2 inhibits apoptosis by sterically hindering the actions of pro-apoptotic caspases, we investigated the expression of CASP7 upon with the treatment of SAHA and EGCG. CASP7 has known roles in cell growth and proliferation in addition to apoptosis, though a previous study has demonstrated that CASP7 levels do not correlate to overall apoptosis (8, 26–28). We conducted qRT-PCR analysis of caspase 7 expression in all four cell lines (Figure 4). Significant differences in its expression in the MCF-7 cell line were observed utilizing ANOVA tests (F(3, 9)=9.916, p=0.0033). Tukey post-hoc tests revealed significant differences between the control (1.000) and 3 μM SAHA (6.531) treatment (p=0.0024), 3 μM SAHA (6.531) and 5 μM EGCG (2.008) treatment (p=0.0131), and 3 μM SAHA (6.531) and 3+5 (2.792) treatments (p=0.0368) (Figure 4A). There were significant differences in the MDA-MB-157 cell line (F(3, 9)=33.42, p<0.0001) similar to that of the MCF-7 cell line (Figure 4B). Results in the MDA-MB-231 and HCC1806 cell lines were less robust than in the MDA-MB-157 cell line with F(3, 12)=10.58, p=0.0011 in the MDA-MB-231 cell line and F(3, 8)=10.08, p=0.0043 in the HCC1806 cell line, but significant nonetheless (Figure 4C, D).
Figure 4.
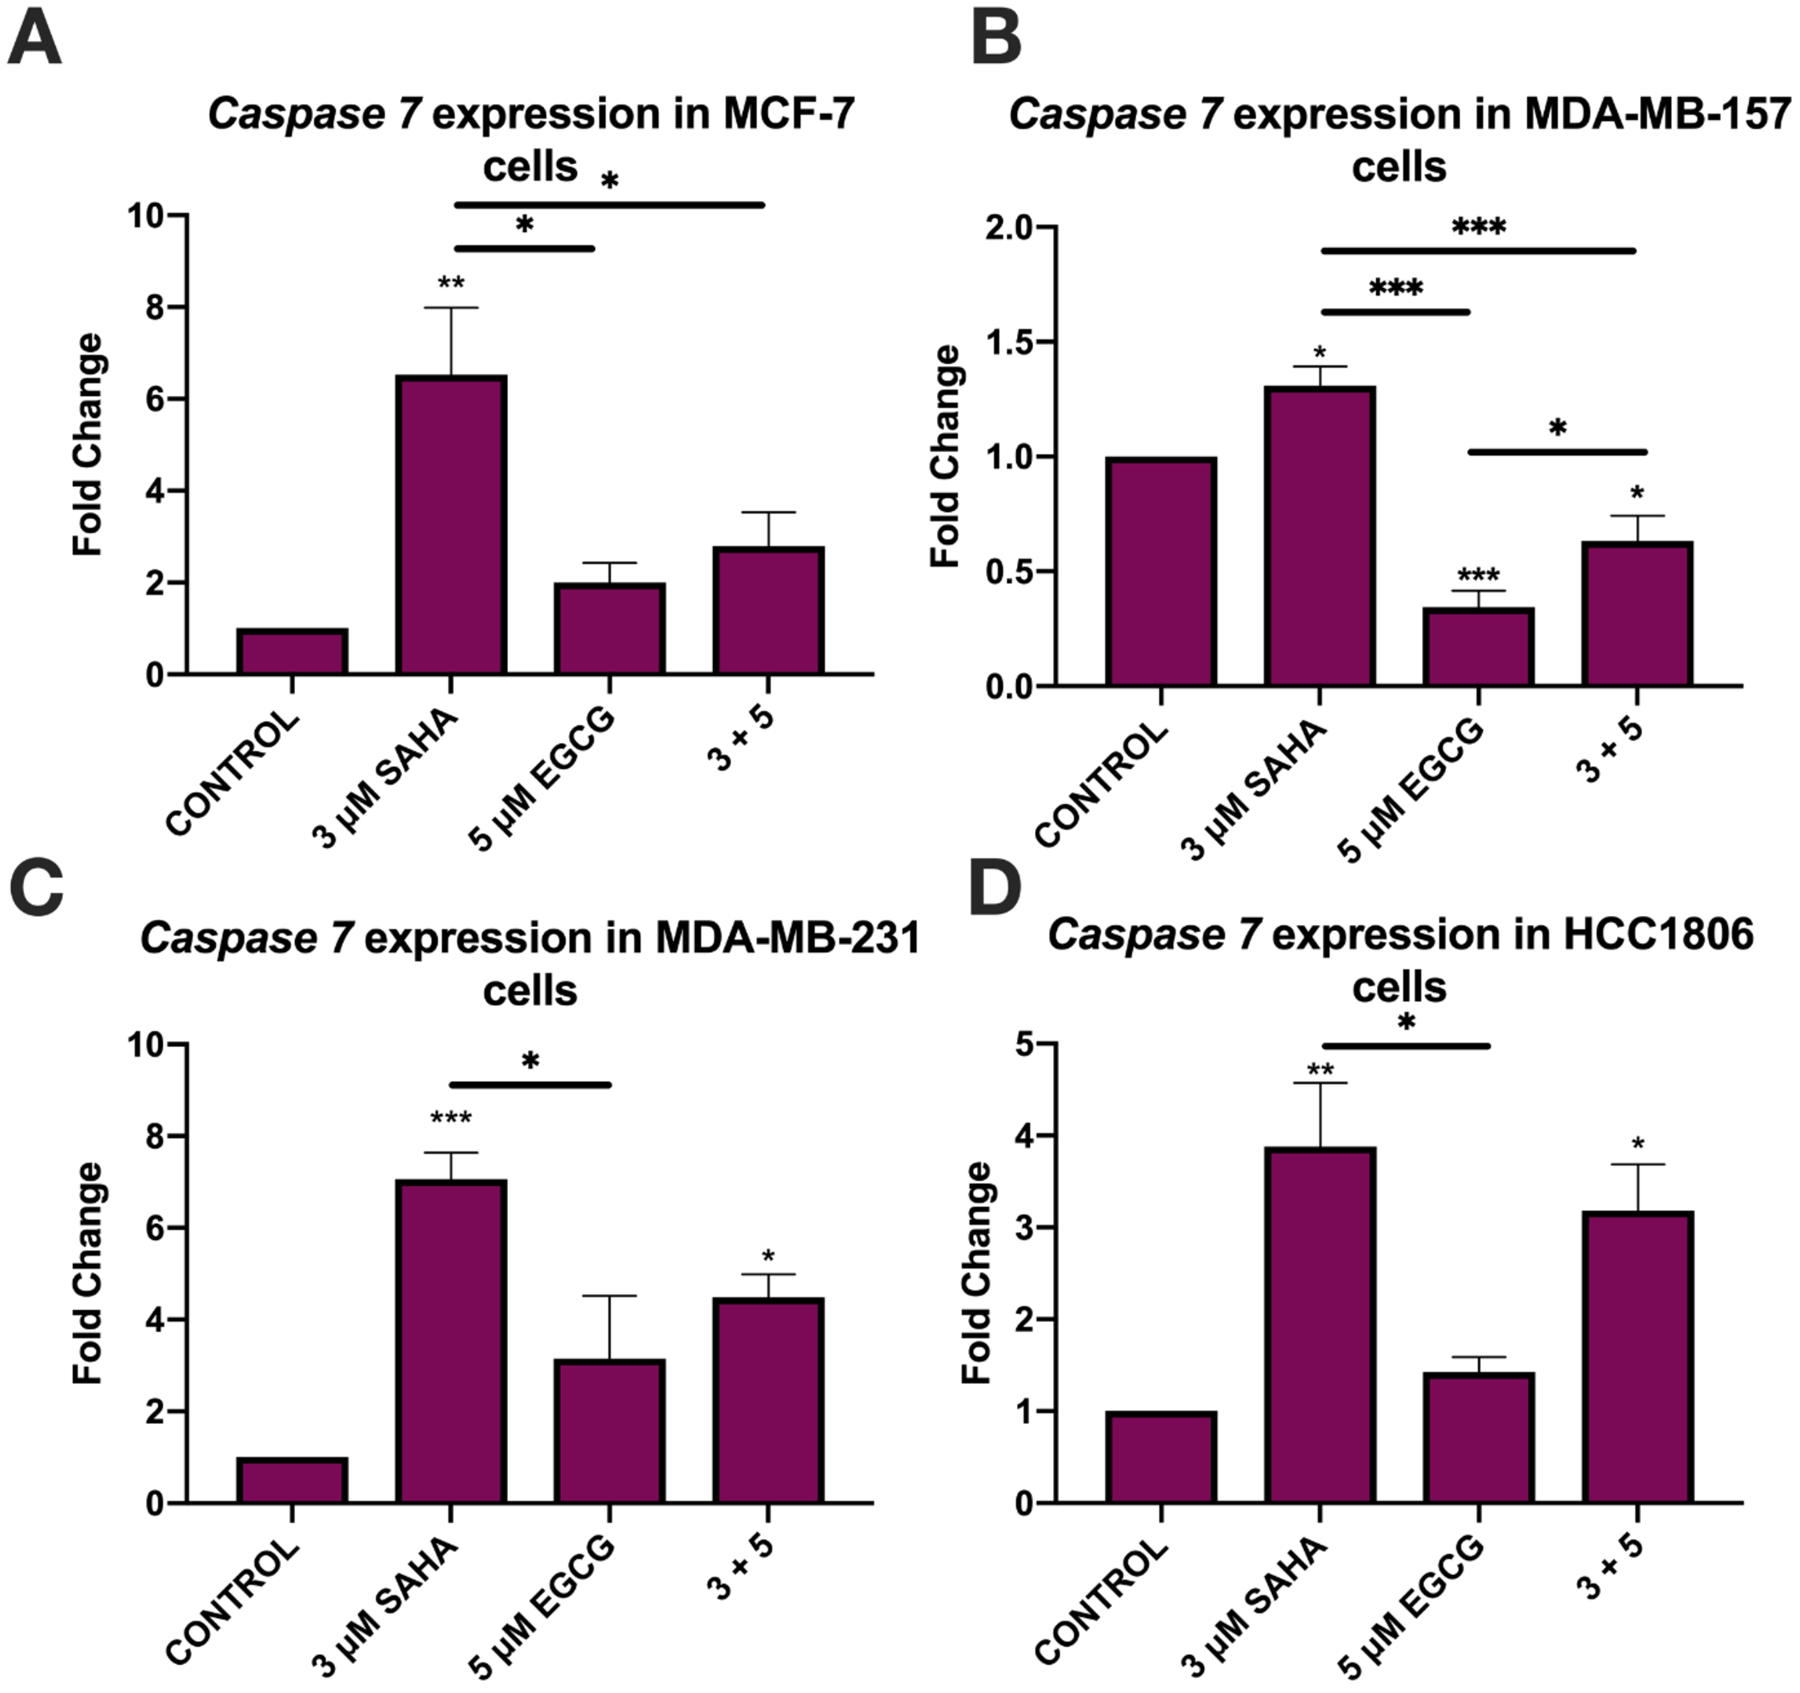
SAHA alone significantly increased the expression of caspase 7 in all four breast cancer cell lines. (A) qRT-PCR using caspase 7 primers was performed for MCF-7 cells after 3-day treatments with the indicated compounds (n=3). GAPDH was used for comparison; (B-D) As above, in MDA-MB-157, MDA-MB-231, and HCC1806 cells (n=3). EGCG alone significantly reduced the expression of caspase 7 in MDA-MB-231 cells (C). Error bars represent standard error of the mean (SEM), and ANOVA with Tukey post-hoc tests were performed on all cell lines; * p<0.05, ** p<0.01, *** p<0.001.
Western blot analysis was also performed on CASP7 in all four cell lines to examine if the increase in mRNA expression also resulted in an increase in protein levels. There was no visible band for pro-caspase 7 in the MCF-7 cell line; thus, one-way ANOVA was performed [F(3, 8)=7.654, p=0.0098]. Tukey post-hoc tests revealed significant differences between the control (1.000) and 3 μM SAHA (2.179, p=0.0252), 5 μM EGCG (2.396, p=0.0101), and 3+5 (2.089, p=0.0372) treatments (Figure 5A). In the MDA-MB-157 cell line, two-way ANOVA analysis yielded significant differences only between the treatment groups and the protein levels of CASP7 [F(3, 8)=5.609, p=0.0228], but not pro-caspase 7 (Figure 5B). Two-way ANOVA tests also determined significant differences between treatment groups in the MDA-MB-231 cell line (F(3, 8)=5.959, p=0.0195), with Tukey post-hoc tests revealing significant differences between the control (1.000) and 3 μM SAHA (0.2620, p=0.0022), and 3 μM SAHA (0.2620) with 5 μM EGCG (0.5905, p=0.0021) (Figure 5C). As with the MCF-7 cell line, there were no visible bands present for pro-caspase 7 in the HCC1806 cell line, so one-way ANOVA was performed [F(3, 8) = 6.735, p=0.0140]. Tukey post-hoc analysis revealed differences between the control (1.000) and 5 μM EGCG (2.419, p=0.0112) and 3+5 (2.078, p=0.0458) treatments.
Figure 5.
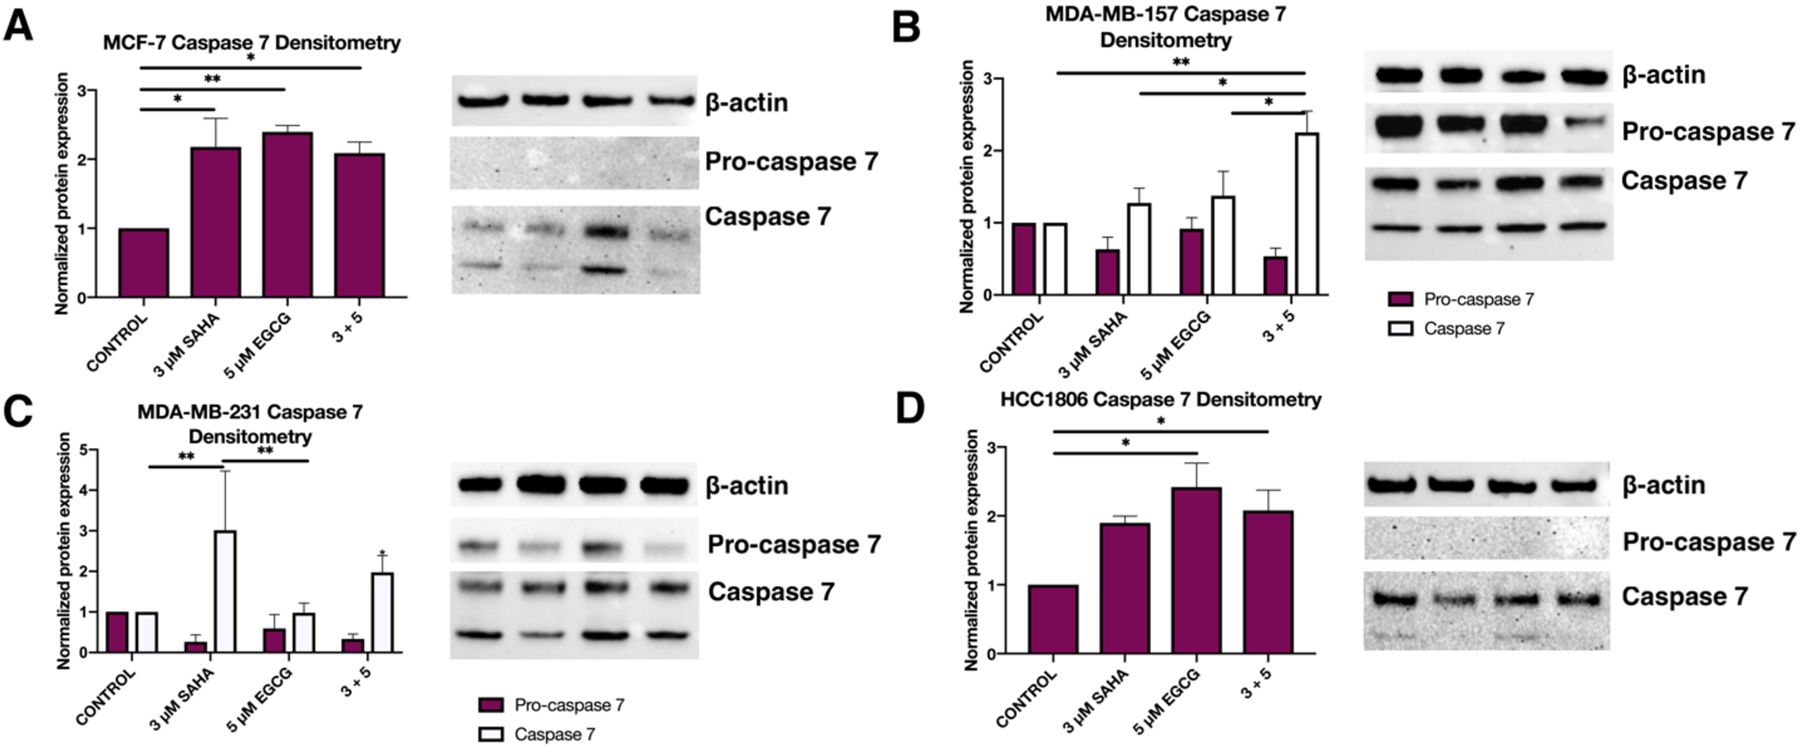
SAHA alone significantly increased the presence of CASP7 protein in all four breast cancer cell lines. (A) Western blot analysis revealed that after 72 h of treatment with the indicated compounds, expression of CASP7 significantly increased in the MCF-7 cell line. B-actin was used for comparison (n=3). (B-D) As above, in MDA-MB-157, MDA-MB-231, and HCC1806 cell lines (n=3). There were no visible pro-caspase 7 expression bands in the MCF-7 and HCC1806 cell lines. Error bars represent standard error of the mean (SEM), and ANOVA with Tukey post-hoc tests were performed on all cell lines; * p<0.05, ** p<0.01.
SAHA and EGCG alter the activity of epigenetic enzymes
In order to determine the effects SAHA and EGCG had on the activity of epigenome-modifying enzymes, we performed activity assays for both histone deacetylases (HDACs) and histone methyltransferases (HMTs) specific for H3K27me3. Histone modification H3K27me3 is associated with gene inactivation and is often found in intergenic regions. We found a significant decrease in HDAC activity in all three TNBC cell lines and in the MCF-7 cell line with the combination of SAHA and EGCG (Figure 6). Interestingly the combination of SAHA and EGCG increased the activity of HMTs only in the MCF-7 cell line [F(3, 8) = 9.579, p=0.0050]. Tukey post-hoc tests revealed significant differences between the control (28.19) with 3 μM SAHA (94.35, p=0.0089) and 3+5 (85.56, p=0.0194), and 3 μM SAHA (94.35) with 5 μM EGCG (52.09, p=0.0317) treatments (Figure 7A).
Figure 6.
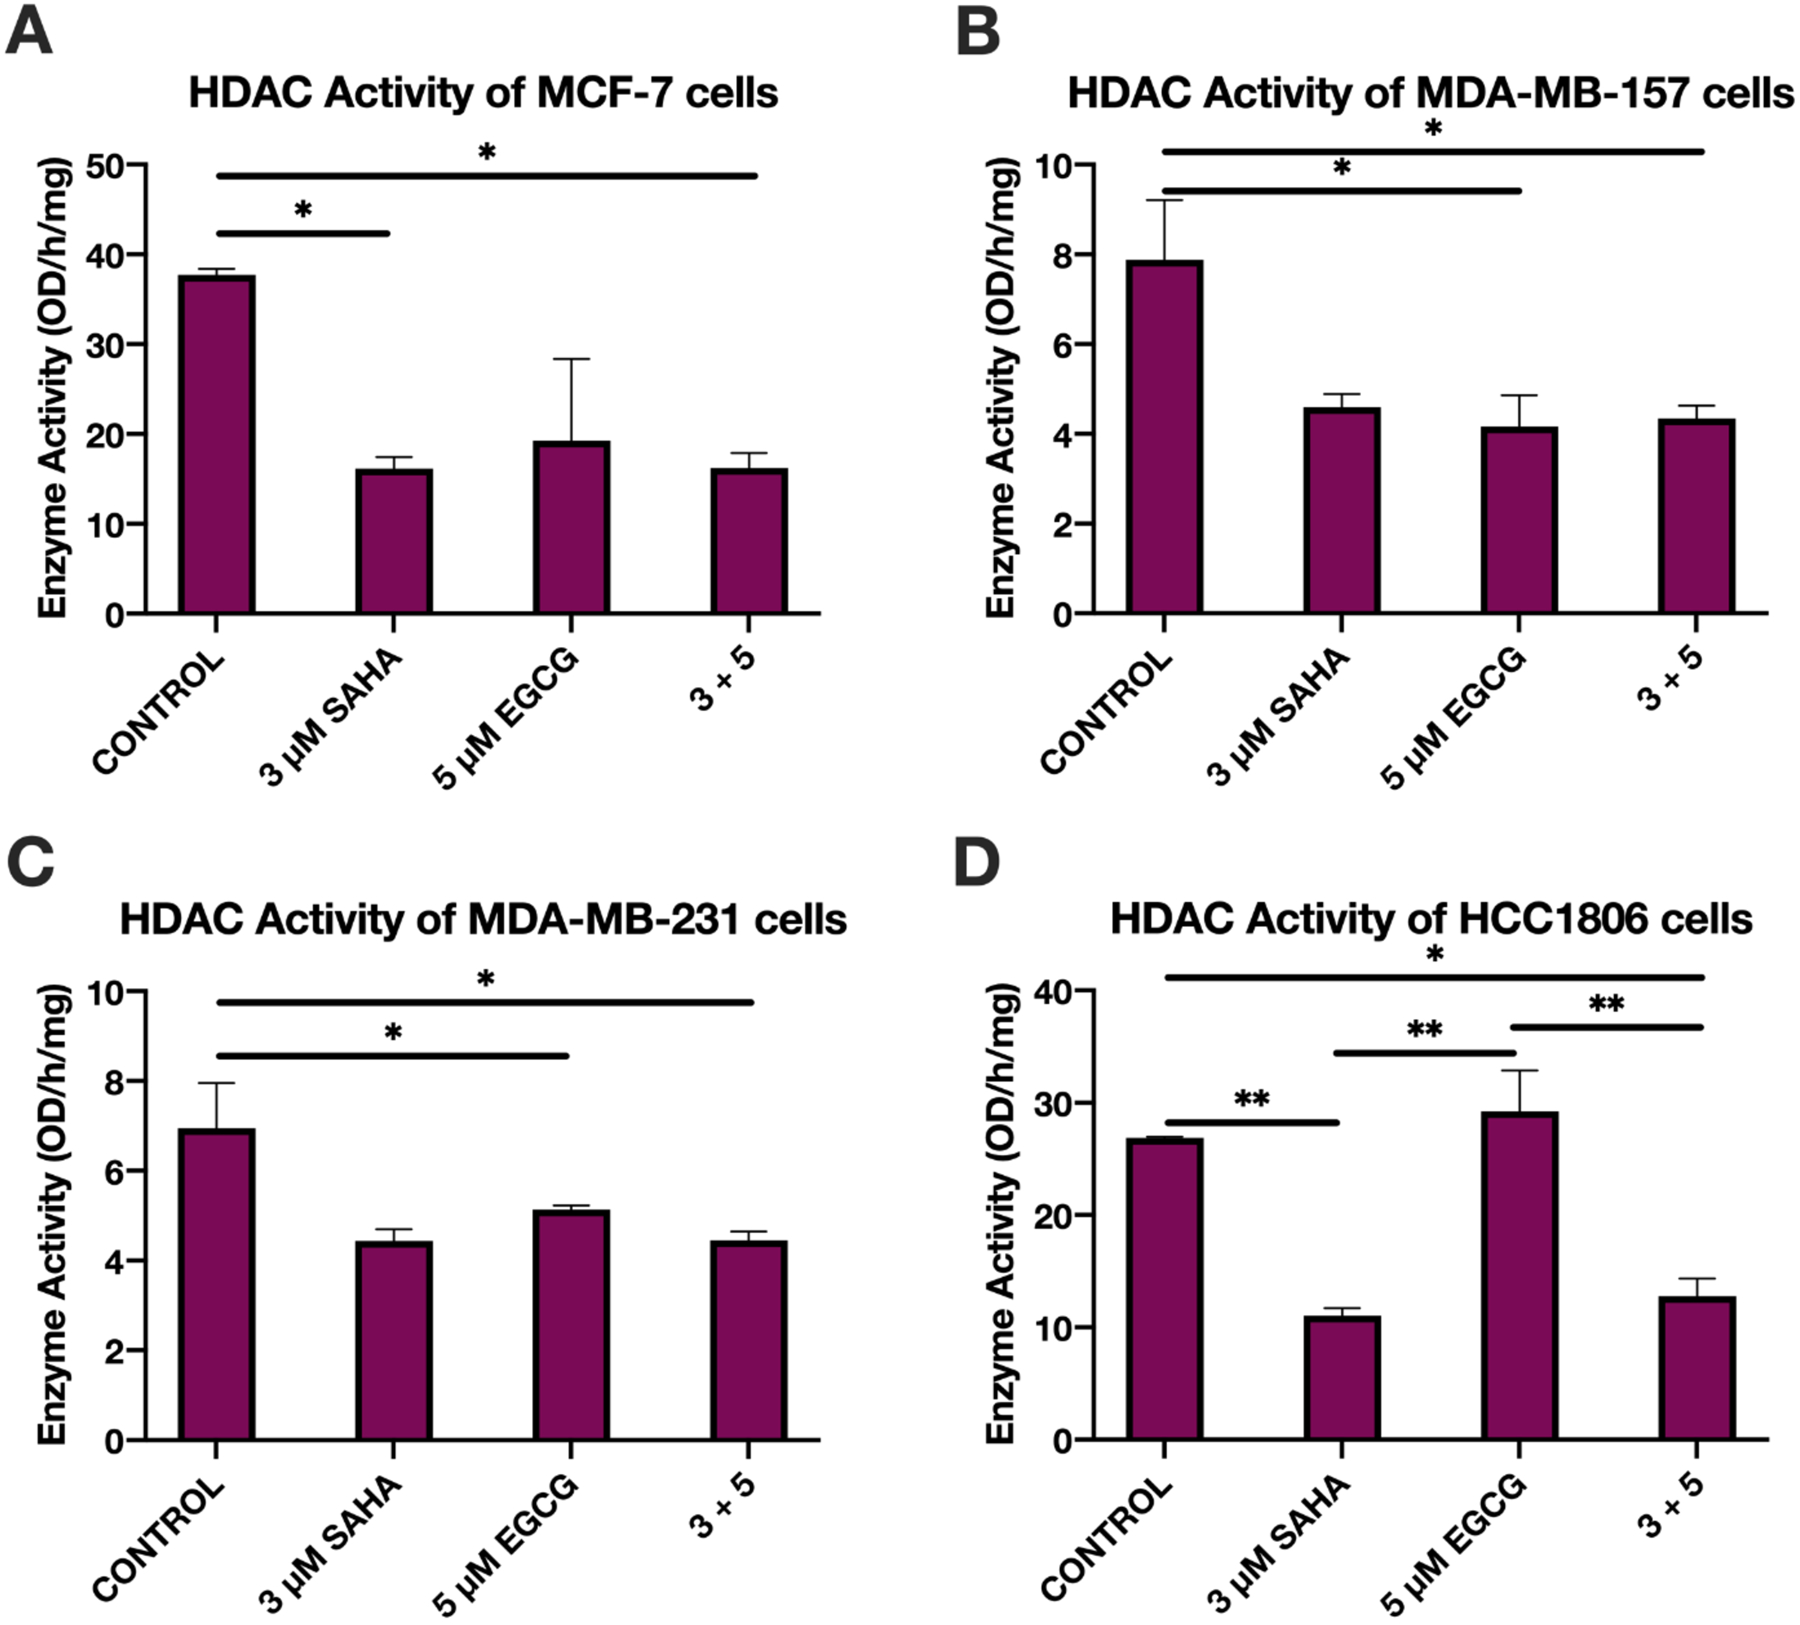
HDAC activity decreased in breast cancer cells upon treatment with SAHA and EGCG, though SAHA alone had the same effect in two of the 4 cell lines. (A) MCF-7 cells were treated for 72 h with the indicated compounds before nuclear extraction was performed. Prepared nuclear extracts were used to quantify the activity of HDAC enzymes (n=3). (B-D) As above in MDA-MB-157, MDA-MB-231, and HCC1806 TNBC cell lines (n=3). Error bars represent standard error of the mean (SEM), and ANOVA with Tukey post-hoc tests were performed on all cell lines); * p<0.05, ** p<0.01.
Figure 7.
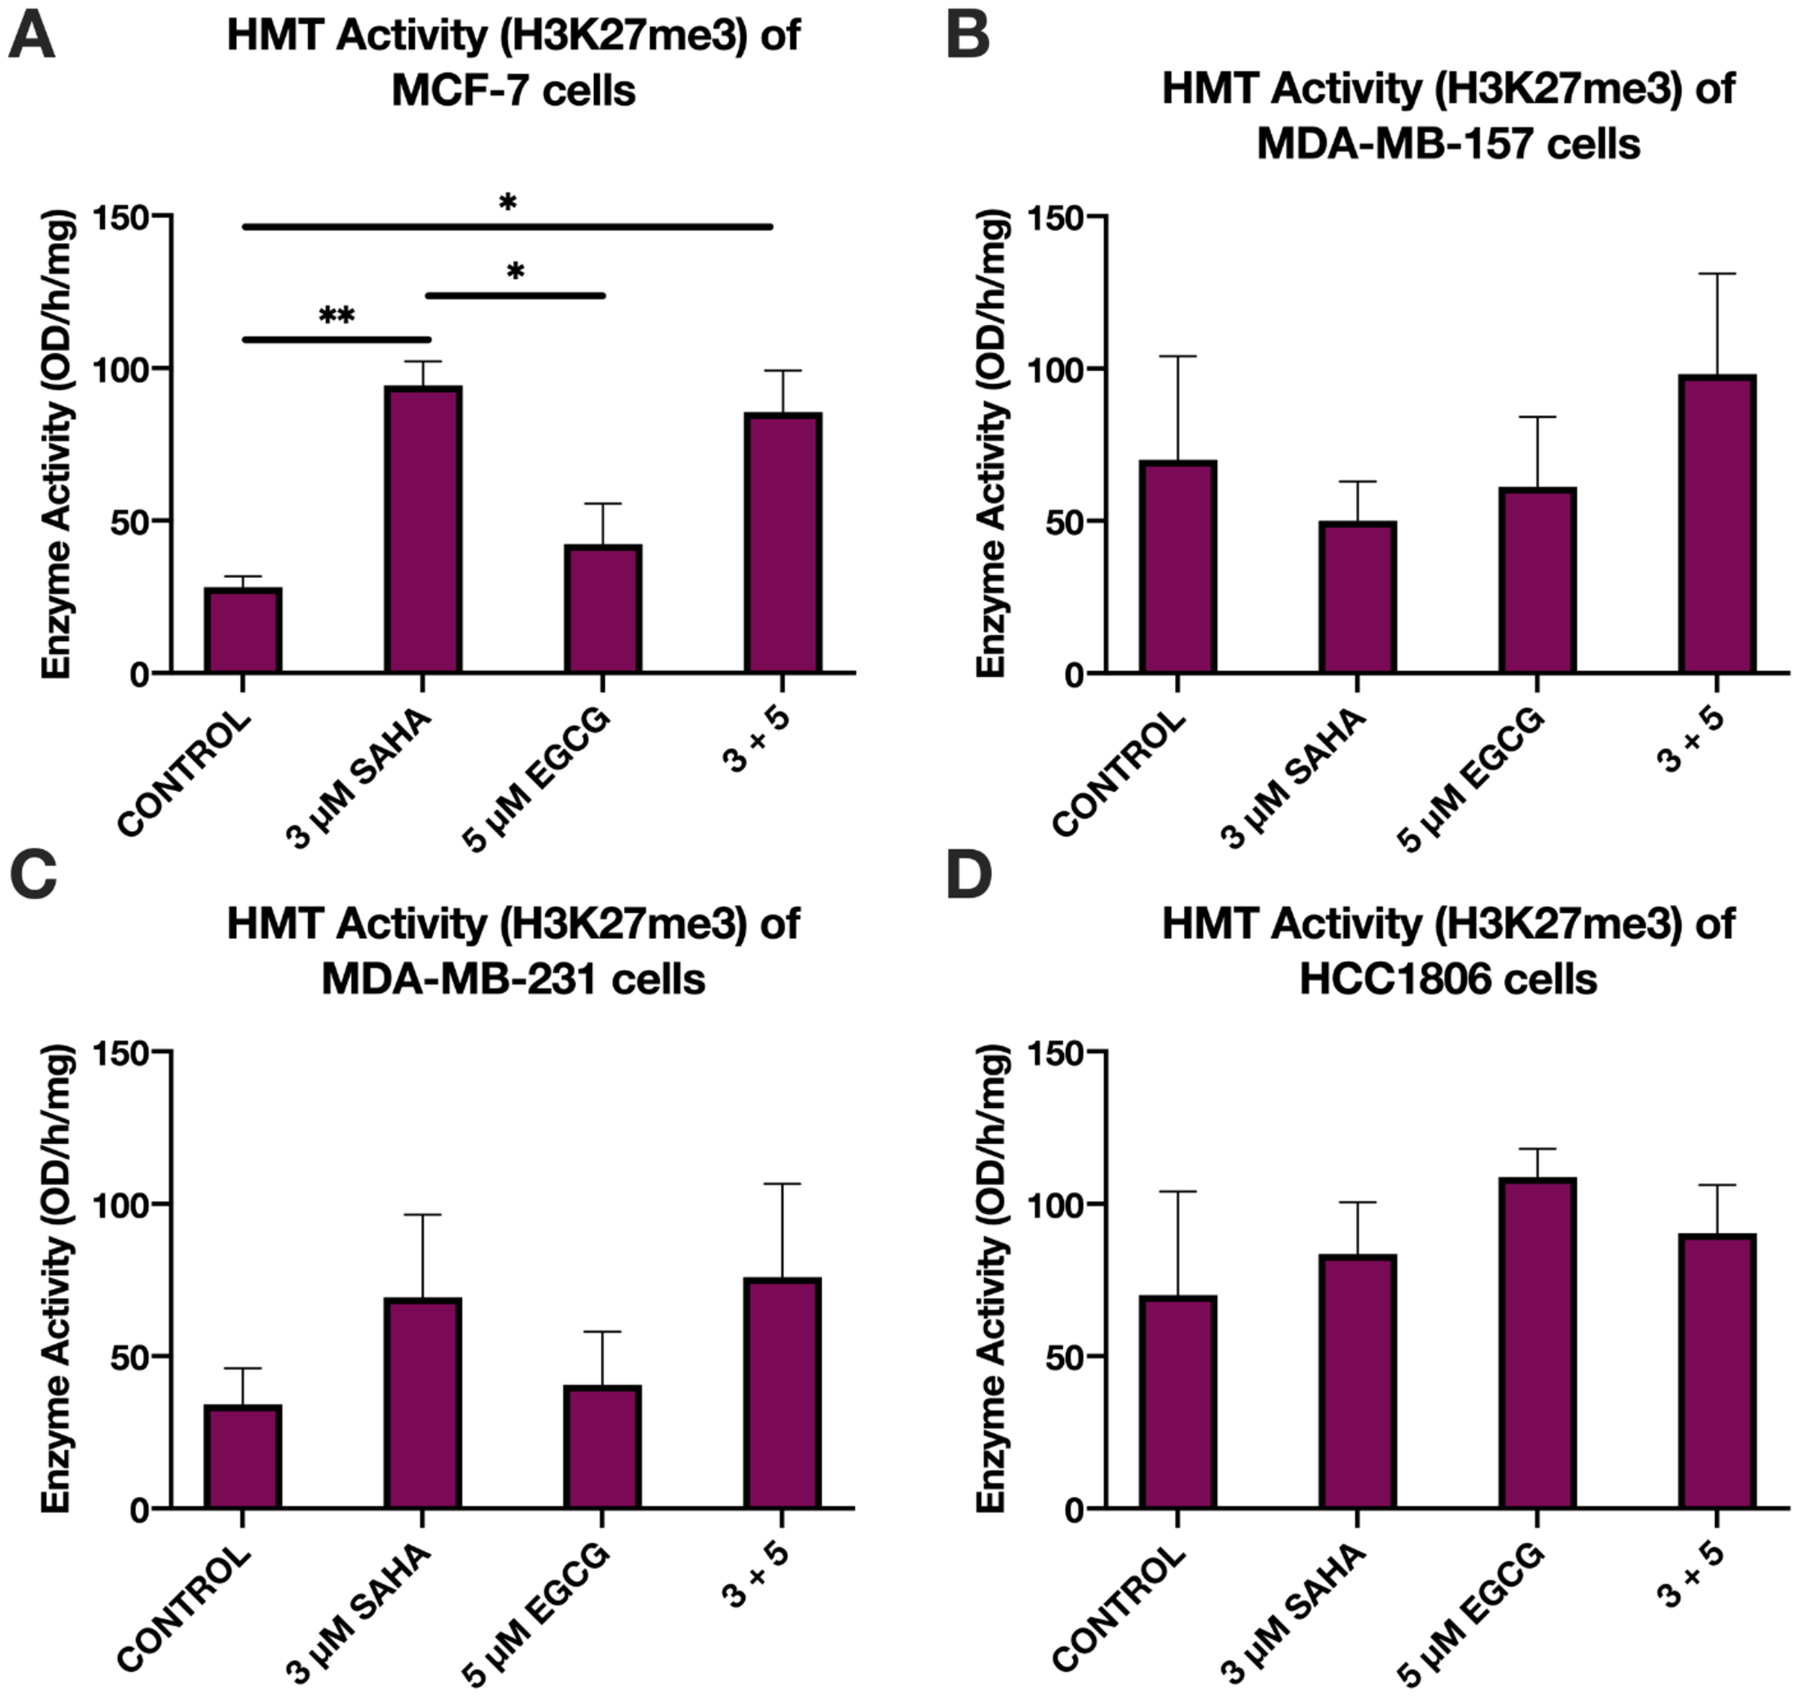
HMT (H3K27me3) activity increased upon treatment with SAHA and EGCG in the ERα-positive MCF-7 cell line. (A) MCF-7 cells were treated for 72 h with the indicated compounds before nuclear extraction occurred. Nuclear extracts were then used in the HMT (H3K27me3) activity assay (n=3). (B-D) As above in MDA-MB-157, MDA-MB-231, and HCC1806 TNBC cell lines (n=3). Error bars represent standard error of the mean (SEM), and ANOVA with Tukey post-hoc tests were performed on all cell lines; * p<0.05, * p<0.01.
Apoptosis and ECM-mediated migration are reduced with the combination of SAHA and EGCG
Because cIAP2 is associated with the inhibition of apoptosis and the promotion of migration in TNBC, we aimed to discover SAHA and EGCG’s effects on both of these processes. We performed flow cytometric analysis of apoptosis and noted a significant increase in apoptosis in all three TNBC cell lines with SAHA and/or EGCG using two-way ANOVA followed by Tukey post-hoc tests (Figure 8B–D). There was no significant increase in necrosis with the treatments in the TNBC cell lines. In the MCF-7 cell line, there was a significant increase in both apoptosis and necrosis with the treatment with SAHA alone and the combination of SAHA and EGCG, though the increase was notably small (Figure 8A). Two-way ANOVA tests examined the interaction between treatment and cellular viability in MCF-7 cells [F(6, 16) = 121.6, p<0.0001].
Figure 8.
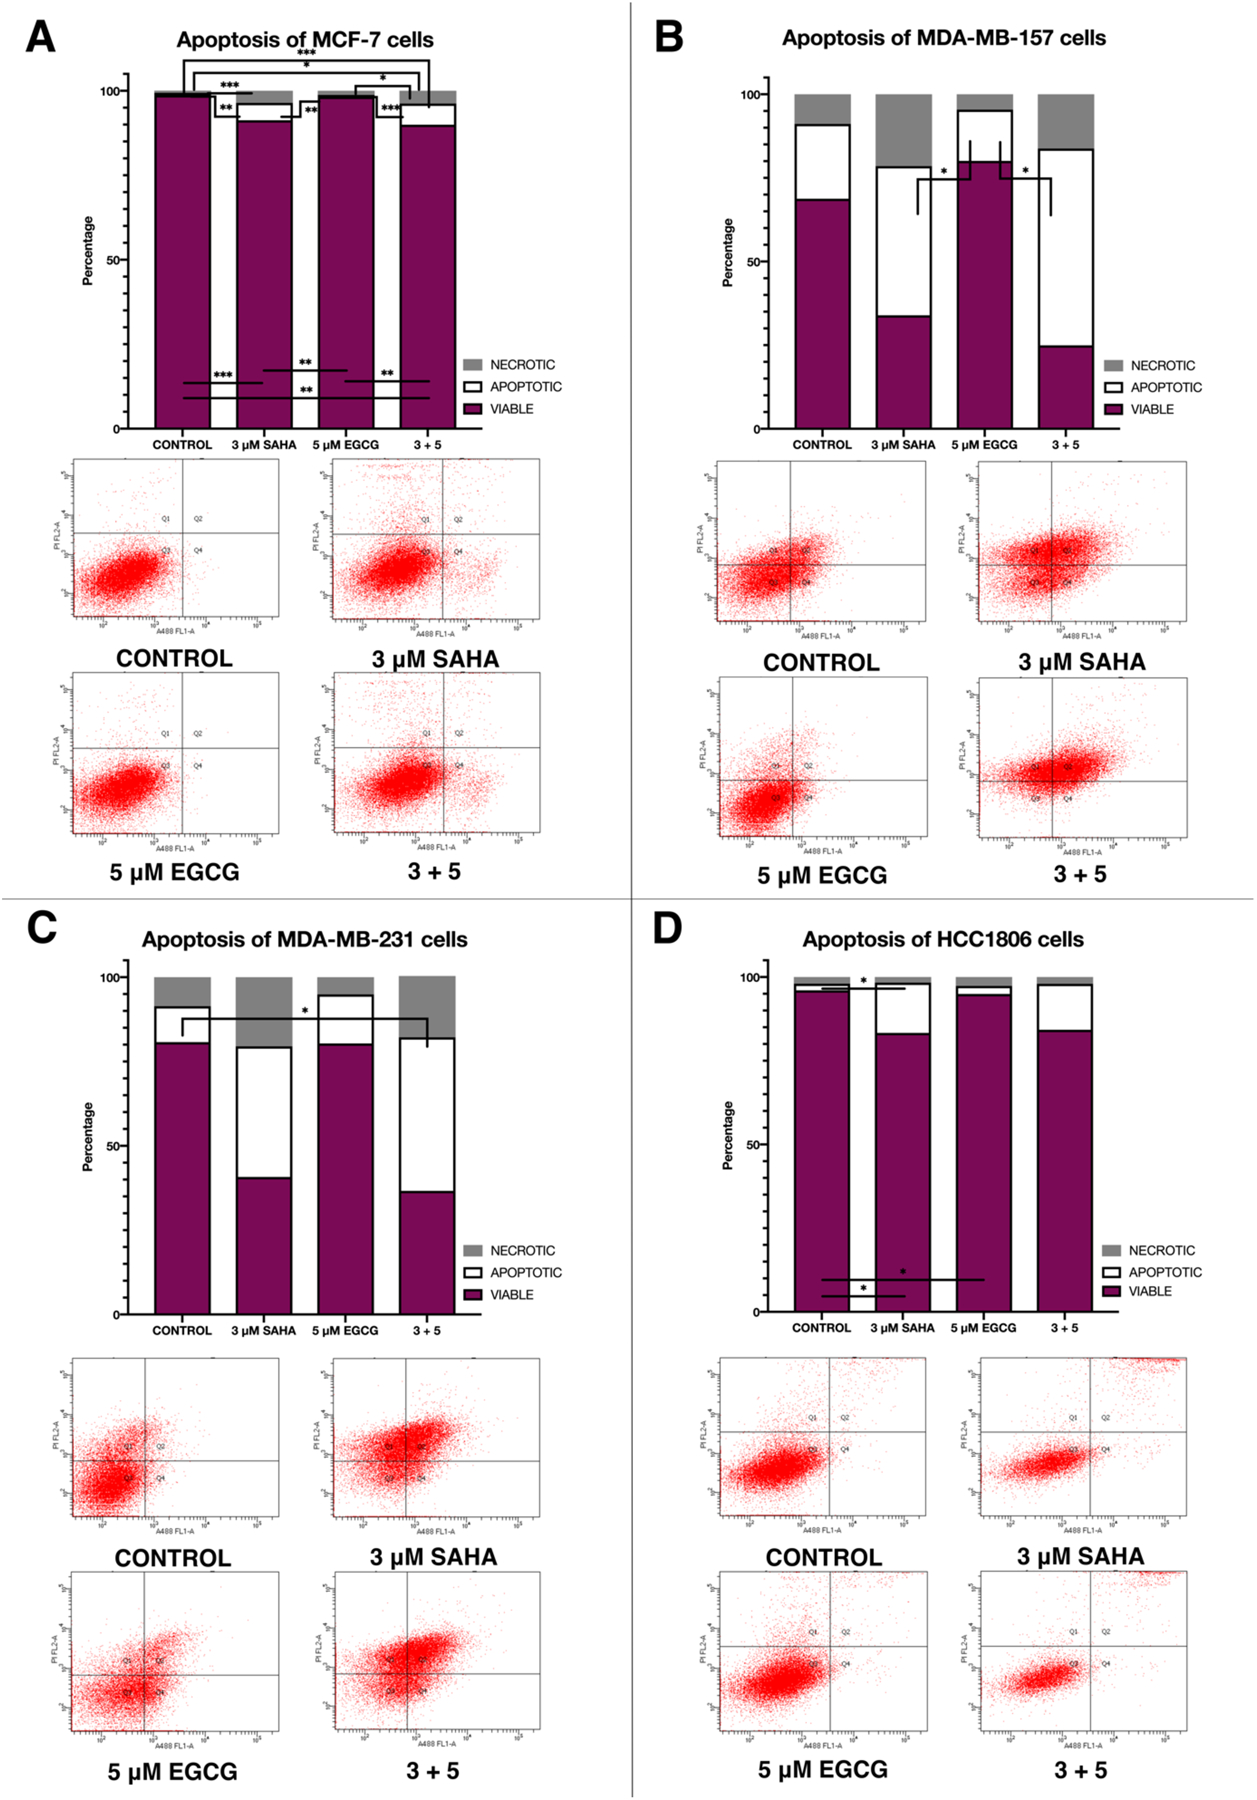
SAHA and EGCG in combination significantly increased apoptosis of breast cancer cells. (A) MCF-7 cells treated for 3-days with the indicated compounds and then stained with annexin V and propidium iodide (n=3). Flow cytometric analysis was conducted utilizing the UAB Flow Core. (B-D) As above in MDA-MB-157, MDA-MB-231, and HCC1806 cell lines (n=3). Error bars represent standard error of the mean (SEM), and ANOVA with Tukey post-hoc tests were performed on all cell lines; * p<0.05, ** p<0.01, *** p<0.001.
Tukey’s multiple comparison test generated significant differences in the percentage of viable cells, apoptotic cells, and necrotic cells for all treatment groups (Figure 8A). The MDA-MB-157 two-way ANOVA interaction test yielded F(6, 16)=6.684, p=0.0010, with Tukey post-hoc tests revealing significant differences in the percentage of apoptotic cells between 3 μM SAHA (44.60) with 5 μM EGCG (15.30, p=0.0280) and 5 μM EGCG (15.30) with 3+5 (58.83, p=0.0111) treatments (Figure 8B). The relationship between cellular viability and treatment generated F(6, 16)=3.879, p=0.0140 in the MDA-MB-231 cell line, with post-hoc tests revealing similar results to the MDA-MB-157 cell line (Figure 8C). There were also significant differences in cellular viability of the HCC1806 cell line [F(6, 16)=16.80, p<0.0001] (Figure 8D).
Because fibronectin (FN) is a principle component of the extracellular matrix (ECM) and plays a crucial role in the ability of cells to evade the basement membrane, we sought to investigate the ability of SAHA and EGCG to limit this process. Interestingly, EGCG was able to significantly increase the migratory capacity of all four breast cancer cell lines (Figure 9). However, SAHA alone and the combination (3 + 5) was able to significantly and strongly reduce the migration of all four cell lines in comparison to EGCG alone (Figure 9A–D). In the MCF-7 cell line there was a significant difference between treatment groups [F(3, 12)= 0.60, p<0.0001] (Figure 9A). One-way ANOVA analysis of the results obtained using MDA-MB-157 cells yielded F(3, 9)=13.73, p=0.0010, with similar results to the MCF-7 cell line (Figure 9B). There were significant differences in the MDA-MB-231 cell line as well (F(3, 12)=28.34, p<0.0001) (Figure 9C). Finally, the HCC1806 cell line had significant differences between treatment groups (F(3, 12)=19.19, p<0.0001) (Figure 9D).
Figure 9.
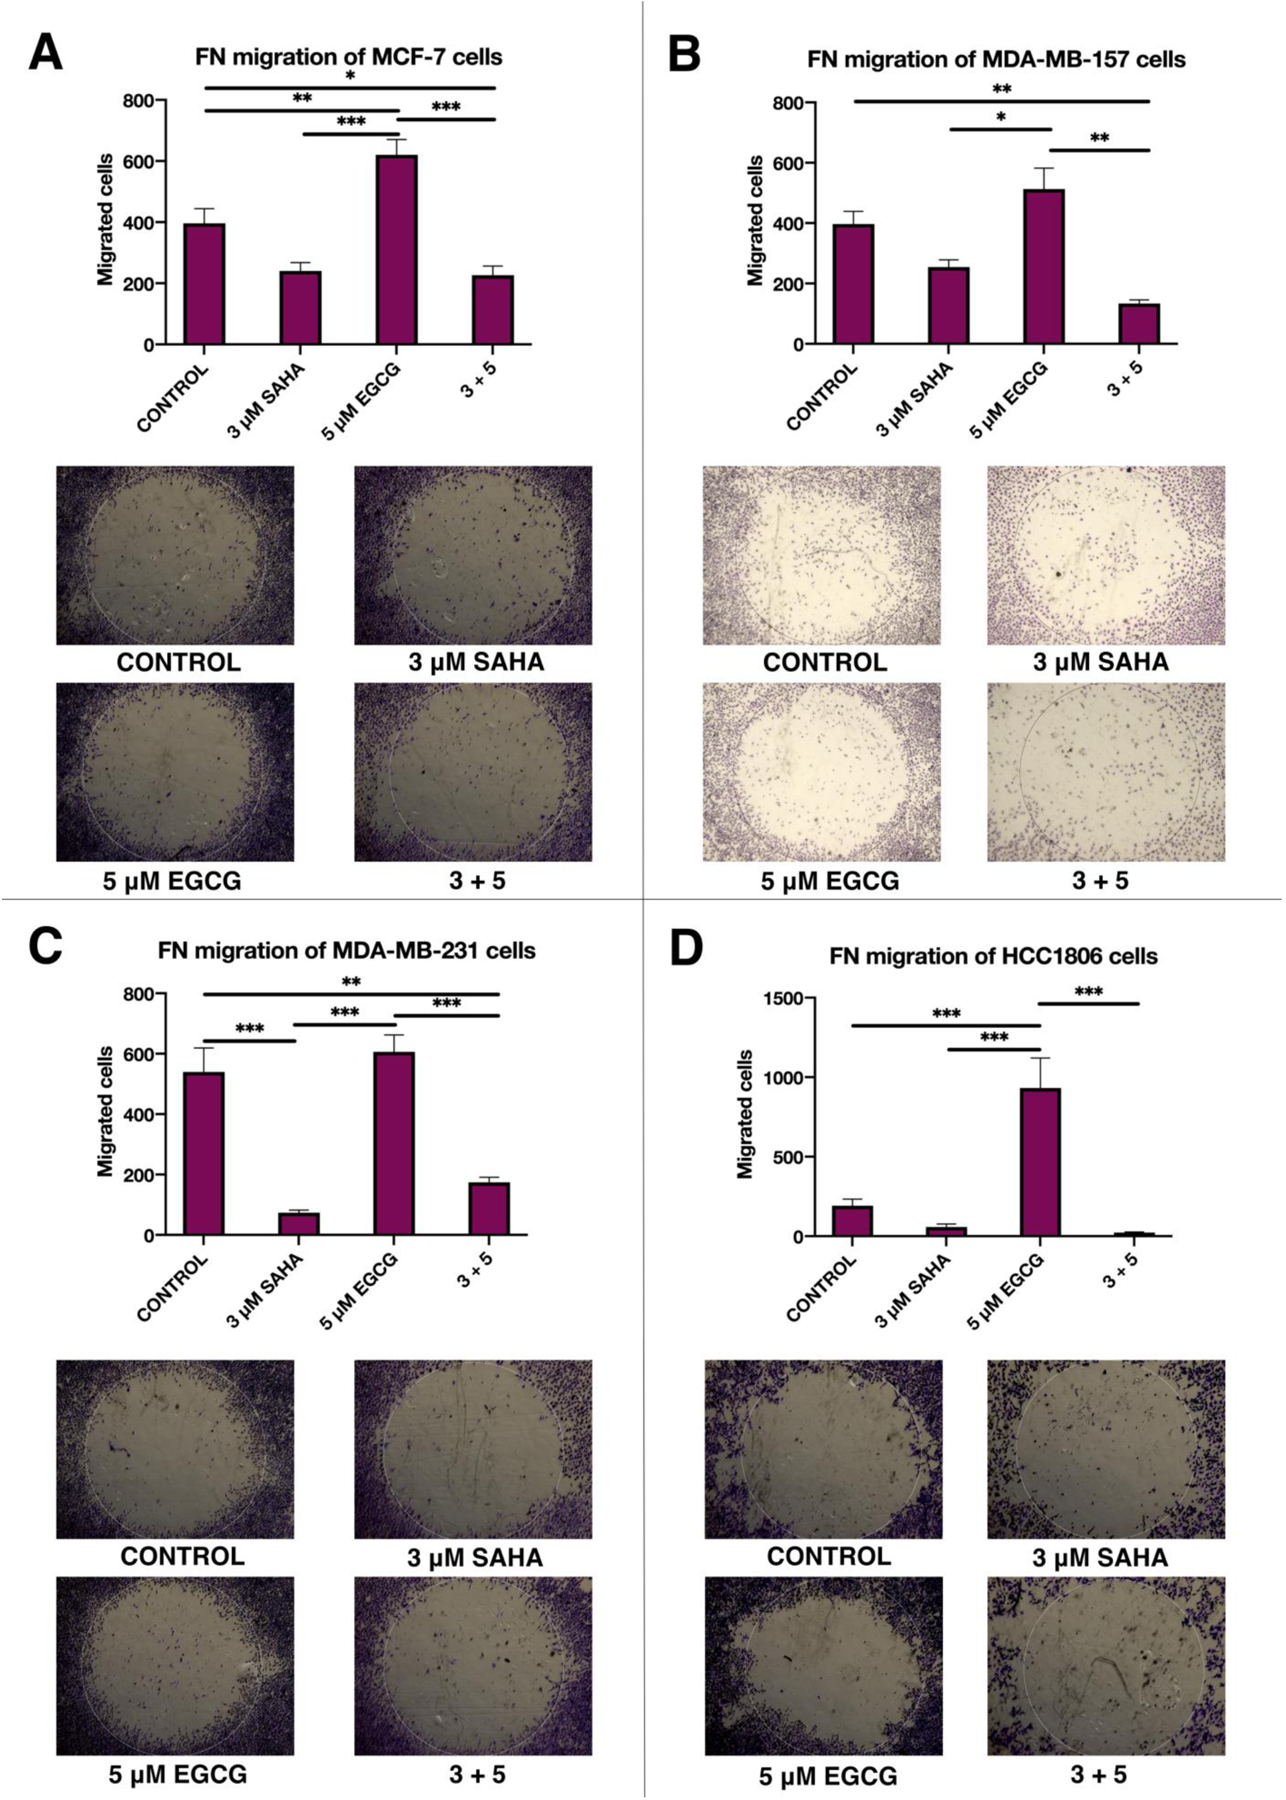
Migration across a fibronectin-coated plate is significantly limited upon combination treatment with SAHA and EGCG. (A) 2 × 10³ MCF-7 cells were plated in a 96-well plate coated with fibronectin (FN). After 72 h of treatment with the indicated compounds the round stopper was removed from the center of each well, the wells were washed, and regular culture media was added. Cells were given 24 h to migrate before being fixed and stained with crystal violet. Cells that had migrated into the center region were counted and compared between the indicated treatments (n = 3). (B-D) As above, in the MDA-MB-157, MDA-MB-231, and HCC1806 TNBC cell lines (n=3). Error bars represent standard error of the mean (SEM), and ANOVA with Tukey post-hoc tests were performed on all cell lines; * p<0.05, ** p<0.01, *** p<0.001.
Discussion
In the present study, we combined EGCG with SAHA, an FDA-approved HDAC inhibitor, in order to study apoptosis and migration in three TNBC cell lines and one ERα-positive cell line for comparison. We examined the effect of the combination treatments in order to determine synergism, additive effect, or antagonism and the efficacy of the two compounds in combination (Figure 10). These calculations were not possible in the MDA-MB-231 cell line because EGCG alone increased cellular viability, but mild synergism was found with the combination in the other three cell lines of interest. With the combination of SAHA and EGCG, cIAP2 expression was reduced in the MDA-MB-157 and HCC1806 cell lines when compared to SAHA alone, though EGCG administered alone was able to reduce cIAP2 expression in the MDA-MB-231 cell line. We also found that the combination was successful in reducing cIAP2 protein levels in the MCF-7, MDA-MB-157, and MDA-MB-231 cell lines. A recent study by Majorini et al. has determined that inhibition of cIAP1 using a second mitochondrial activator of caspases (Smac) mimetic resulted in anticancer effects through the EGFR/Snai2 axis, which reduced tumor aggressiveness (29). Smac proteins activate apoptosis through neutralizing IAP proteins. The results of the chromatin immunoprecipitation (ChIP) demonstrated that there was potentially an epigenetic link between the decrease in cIAP2 levels and a decrease in acetylated histone H3 (AcH3). AcH3 is associated with active gene transcription, and a decrease in cIAP2 expression was found (Figure 1). The cIAP2 promoter ChIP primers encompassed a NF-κB binding site, which acts as a transcriptional activator, so the decrease in AcH3 within this region could prevent NF-κB binding and transcriptional activation (25). cIAP2 potentially has an aberrantly acetylated promoter, resulting in its increased expression in TNBC. CBP and p300 are promiscuous HATs that can not only acetylate all four core histones but also proteins including, but not limited to, p53, Rb, E2F, and BRCA1 (22). They act as transcriptional cofactors by interacting with basal transcription factors like TATA-binding protein (TBP) and TFIIB. Aberrant activation or localization of HATs can promote tumorigenesis, so the decrease in AcH3 within the proximal promoter region of cIAP2 could be the result of HAT inactivation, especially considering EGCG’s ability to act as a HAT inhibitor (23). Other genes have been reported to be under epigenetic control that do not conform to the dogma of decreased acetylation leading to gene inactivation. For example, human telomerase reverse transcriptase (hTERT) has a paradoxically hypermethylated promoter region that results in an increase in transcription in 90% of human cancers. This hypermethylation prevents transcriptional repressor proteins from binding to the promoter. In addition, treatment of cancerous cells with trichostatin A (TSA), another HDAC inhibitor, resulted in the suppression of hTERT by promoting transcriptional repression through CTCF binding. This only occurs in a hypermethylated promoter, though, because TSA deacetylates the histones of the DNMT1 gene, transcription is decreased (30–32).
Figure 10.
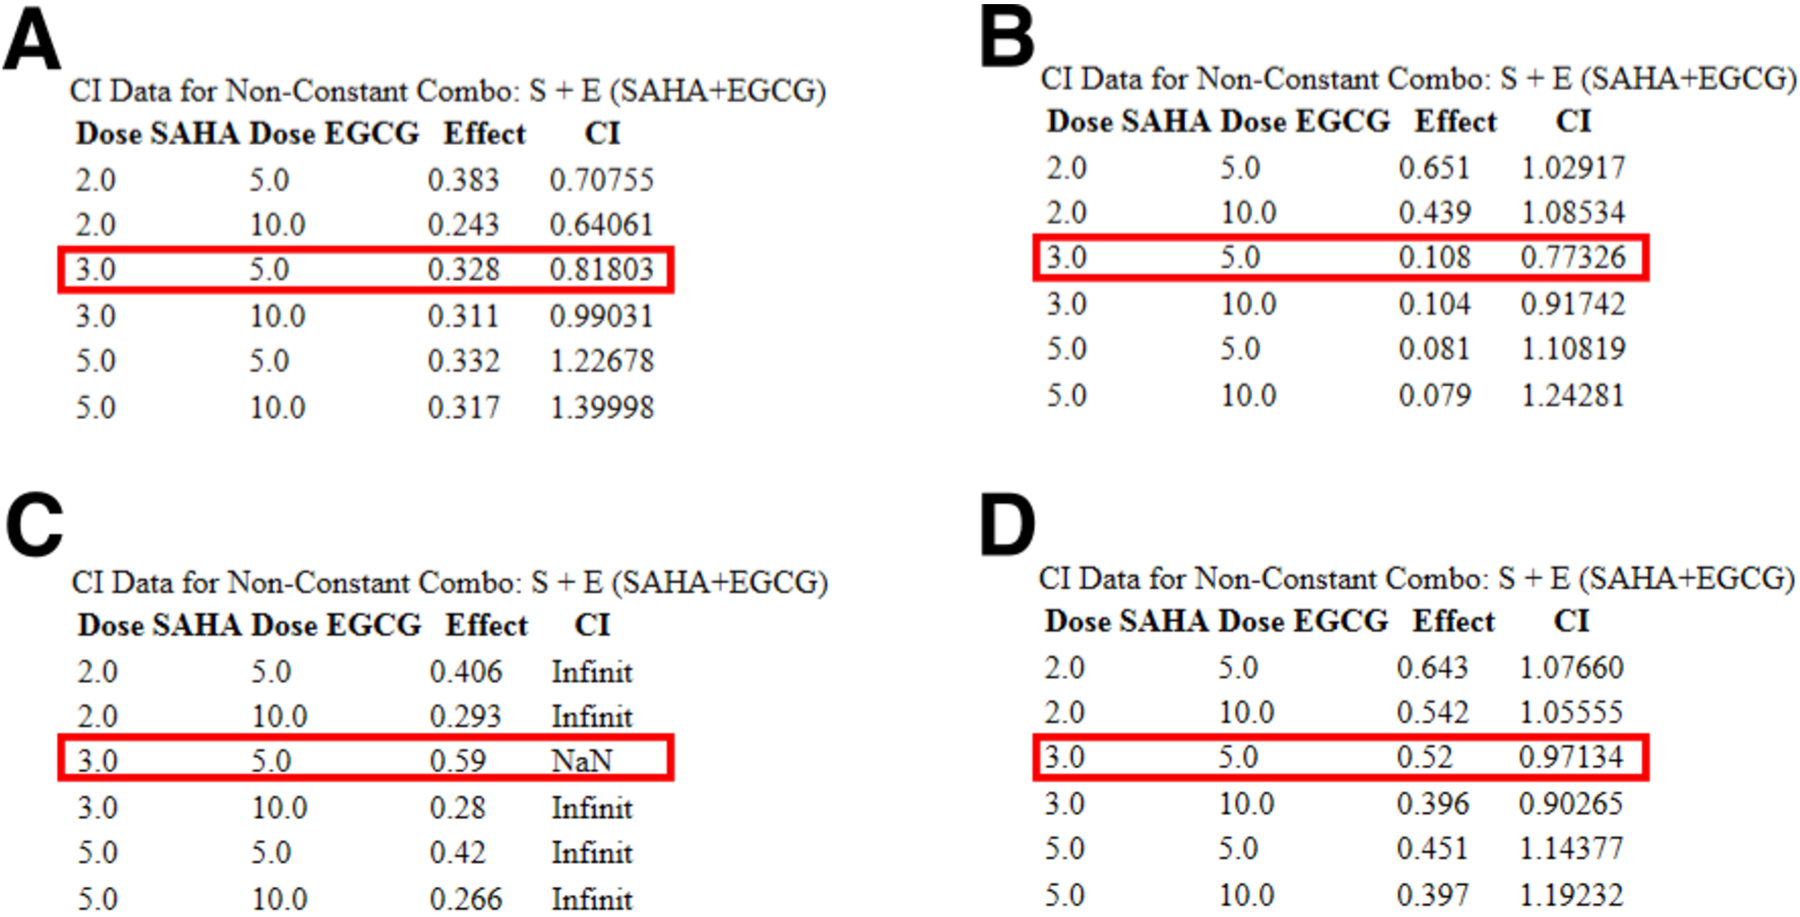
Chou-Talalay method combination indices were determined for the combination of SAHA and EGCG utilizing CompuSyn software. For CI values <1 the combination is synergistic, CI values = 1 are additive, and CI values >1 are antagonistic. (A) The combination of 3 μM SAHA and 5 μM EGCG is synergistic in the MCF-7 cell line, with a CI value of 0.81803. The same applies to the MDA-MB-157 and HCC1806 cell lines (B, D). Because viability of MDA-MB-231 cells was increased for all single doses of EGCG, CompuSyn was unable to calculate any of the CI values for the combination (D).
We here report for the first time a lack of pro-caspase 7 protein in MCF-7 and HCC1806 cell lines. Previous studies have shown that there are several splice variants of CASP7 that are correlated with overall prognosis in cervical cancer within a population of Chinese women (33). The significance of these findings is uncertain, though a study by Soung et al. has determined that inactivating gene mutations of caspase 7 can contribute to the pathogenesis of some human solid tumors (34, 35). A more recent study by Lindner et al. has discovered that low BCL2 and low cleaved caspase 7 protein levels were highly prognostic of unfavorable outcomes across all breast cancers (36). This study suggested that impaired caspase-dependent apoptosis is associated with a poor clinical outcome, and the presence of cleaved caspase 7 is a more important factor than pro-caspase 7 levels.
To further investigate the epigenetic effects of SAHA and EGCG on breast cancer cells, we performed activity assays on histone deacetylases (HDACs) and histone methyltransferases (HMTs). Our previous study on SAHA and EGCG demonstrated that the combination could significantly reduce the activity of DNMT enzymes in the MDA-MB-157 and MDA-MB-231 cell lines. EGCG alone mediated this reduction in the MCF-7 cell line, which could be expected since EGCG acts as a DNMT inhibitor. Interestingly, there were no changes in DNMT activity in the HCC1806 cell line (5). Our present study indicated that the combination significantly reduces HDAC activity in all four cell lines. We also report a novel finding that H3K27me3-specific HMT is increased with the combined treatment with SAHA and EGCG only in the MCF-7 cell line, though there was an upward trend in the TNBC cell lines. H3K27me3 is a histone modification responsible for inactivation of gene transcription. It is typically found associated with intergenic sequences and inactive gene promoters. Because neither EGCG nor SAHA have HMT-modulating effects, this could be the result of indirect effects on HMT expression. The most common enzyme involved in trimethylation of H3K27 is the oncogenic factor EZH2 (Enhancer of Zeste 2; Polycomb Repressive Complex 2 Subunit). Choudhury et al. have determined that EGCG was capable of reducing protein levels of EZH2 among other polycomb group (PcG) proteins (37). This could explain why EGCG alone did not increase HMT (H3K27me3) activity in the MCF-7 cell line (Figure 7A). Interestingly, a study from Yasuda et al. has shown that undifferentiated cancer stem cells (CSC) express lower levels of repressive chromatin markers including H3K27me3 and EZH2 than differentiated cancer cells, like the MCF-7 cell line (38). Because TNBC cells have a more basal appearance, it is possible that they operate similarly to CSCs. EZH2 function and expression are highly specific for tumor type, and the ambiguity of its roles depends on the other PcG proteins present (39). A more recent study has shown a crosstalk between H3K27me3 gene silencing catalyzed by EZH2 and CpG island methylation mediated by DNMT1 within the wwc1 promoter in TNBC cell lines. This study has also discovered a higher level of CpG methylation of the wwc1 promoter in TNBC versus the MCF–7 cell line. WWC1 is part of the Hippo signaling pathway and acts as a metastasis suppressor (40, 41). Our seminal study could pave the way for future investigations into this gene pathway using combined treatment with SAHA and EGCG.
As proof of principle, we conducted apoptosis assays to determine if the decrease in cIAP2 expression on all levels was linked to an increase in apoptosis of the breast cancer cells. Our results supported this idea, with the MDA-MB-157 and MDA-MB-231 cells demonstrating the most robust increase in apoptosis. The only cell line with a significant increase in necrosis with our treatments was the MCF-7 cell line, though the effect size was quite small. SAHA alone significantly increased apoptosis in the HCC1806 cell line (Figure 8D). Because of the association between cIAP2 and migration in TNBC cells, we specifically chose to investigate cell migration across fibronectin (FN). FN is not normally expressed in adult breast tissue, and an increase in mRNA and protein levels are reported in the stroma of breast tumors (42). A more recent study by Li et al. has established that FN causes an epithelial to mesenchymal transition (EMT)-like morphological change in MCF-7 breast cancer cells, which included the down-regulation of E-cadherin and the upregulation of N-cadherin (43). Changes in the synthesis and organization of FN contribute to the premetastatic niche that facilitates tumor progression and evasion of the basement membrane. A previous study has demonstrated that by exposing MCF10A noncancerous mammary epithelial cells to exogenous FN, an EMT response was generated (44). We were able to determine that the combination of SAHA and EGCG significantly reduced migration of all four cell lines across the FN matrix in comparison to the control. We acknowledge the increase in cellular migration with EGCG alone, which was significant in all four cell lines. Because EGCG is an antioxidant, the low concentration used may promote viability (45). Many studies have shown that EGCG can stimulate the immune system, so in an in vivo setting, low doses of EGCG could have anticancer effects (46). Our most recent study has provided evidence that SAHA and EGCG promote the mesenchymal-epithelial transition by increasing the expression of E-cadherin and reducing the expression of N-cadherin in the same TNBC cell lines (5).
The current study indicated that the anticancer properties of the combination of SAHA and EGCG may be due to apoptosis and migration. Additional studies are needed to elucidate the exact mechanisms which allow SAHA and EGCG to reduce metastatic potential of the breast cancer cell lines. Our results support the epigenetic effects of SAHA and EGCG on the availability of the cIAP2 promoter in addition to the decrease in HDAC activity and increases in H3K27me3-specific HMT activity. Future studies will focus on identifying the genes targets whose expression is affected by the increase in HMT activity within the MCF-7 cells. We plan to investigate the epithelial-mesenchymal transition in in vivo studies that will hopefully prove to be more translational.
Conclusion
In summary, our findings showed that the combination SAHA and EGCG is effective in inducing apoptosis of breast cancer cells and reducing their migratory capacity. Despite TNBCs lacking targets for traditional hormonal-related cancer treatments, all TNBC cell lines in this study responded to the combined treatment with SAHA and EGCG. We reported decreases in cIAP2 expression because of epigenetic modifications in the promoter region of this gene and increases in CASP7 expression. Additional epigenetic changes included a decrease in HDAC activity and an increase in HMT activity. The combination of SAHA and EGCG resulted in an increase in apoptosis and a decrease in migration across the fibronectin matrix, which is a crucial step in the epithelial-mesenchymal transition. Additional studies on the combination of SAHA and EGCG could elucidate the direct mechanisms and the significance of the aforementioned epigenetic modifications and allow translation of these findings.
Acknowledgements
The Authors acknowledge the Tollefsbol lab members for their advice and support and the Riddle Lab and the UAB Flow Cytometry Core for their help with ChIP and apoptosis, respectively.
Funding
This work was supported in part by grants from the National Cancer Institute (R01 CA178441 and R01 CA204346) and the Susan G. Komen Graduate Training in Disparities Research National Award (GTDR15329376).
Footnotes
Conflicts of Interest
The Authors declare no conflict of interest regarding this study.
References
- 1.Hanahan D and Weinberg RA: The hallmarks of cancer. Cell 100(1): 57–70, 2000. DOI: 10.1016/s0092-8674(00)81683-9 [DOI] [PubMed] [Google Scholar]
- 2.Hanahan D and Weinberg RA: Hallmarks of cancer: The next generation. Cell 144(5): 646–674, 2011. DOI: 10.1016/j.cell.2011.02.013 [DOI] [PubMed] [Google Scholar]
- 3.Gyrd-Hansen M and Meier P: Iaps: From caspase inhibitors to modulators of nf-kappab, inflammation and cancer. Nat Rev Cancer 10(8): 561–574, 2010. DOI: 10.1038/nrc2889 [DOI] [PubMed] [Google Scholar]
- 4.Fernald K and Kurokawa M: Evading apoptosis in cancer. Trends Cell Biol 23(12): 620–633, 2013. DOI: 10.1016/j.tcb.2013.07.006 [DOI] [PMC free article] [PubMed] [Google Scholar]
- 5.Lewis KA, Jordan HR and Tollefsbol TO: Effects of saha and egcg on growth potentiation of triple-negative breast cancer cells. Cancers (Basel) 11(1), 2018 DOI: 10.3390/cancers11010023 [DOI] [PMC free article] [PubMed] [Google Scholar]
- 6.Jo SJ, Park PG, Cha HR, Ahn SG, Kim MJ, Kim H, Koo JS, Jeong J, Park JH, Dong SM and Lee JM: Cellular inhibitor of apoptosis protein 2 promotes the epithelial-mesenchymal transition in triple-negative breast cancer cells through activation of the akt signaling pathway. Oncotarget 8(45): 78781–78795, 2017. DOI: 10.18632/oncotarget.20227 [DOI] [PMC free article] [PubMed] [Google Scholar]
- 7.Dogan T, Harms GS, Hekman M, Karreman C, Oberoi TK, Alnemri ES, Rapp UR and Rajalingam K: X-linked and cellular iaps modulate the stability of c-raf kinase and cell motility. Nat Cell Biol 10(12): 1447–1455, 2008. DOI: 10.1038/ncb1804 [DOI] [PubMed] [Google Scholar]
- 8.Chaudhary S, Madhukrishna B, Adhya AK, Keshari S and Mishra SK: Overexpression of caspase 7 is eralpha dependent to affect proliferation and cell growth in breast cancer cells by targeting p21(cip). Oncogenesis 5: e219, 2016. DOI: 10.1038/oncsis.2016.12 [DOI] [PMC free article] [PubMed] [Google Scholar]
- 9.Georgescu MM: Pten tumor suppressor network in pi3k-akt pathway control. Genes Cancer 1(12): 1170–1177, 2010. DOI: 10.1177/1947601911407325 [DOI] [PMC free article] [PubMed] [Google Scholar]
- 10.Gao Y and Tollefsbol TO: Combinational proanthocyanidins and resveratrol synergistically inhibit human breast cancer cells and impact epigenetic(−)mediating machinery. Int J Mol Sci 19(8), 2018 DOI: 10.3390/ijms19082204 [DOI] [PMC free article] [PubMed] [Google Scholar]
- 11.Paul B, Li Y and Tollefsbol TO: The effects of combinatorial genistein and sulforaphane in breast tumor inhibition: Role in epigenetic regulation. Int J Mol Sci 19(6), 2018 DOI: 10.3390/ijms19061754 [DOI] [PMC free article] [PubMed] [Google Scholar]
- 12.Kala R and Tollefsbol TO: A novel combinatorial epigenetic therapy using resveratrol and pterostilbene for restoring estrogen receptor-alpha (eralpha) expression in eralpha-negative breast cancer cells. PLoS One 11(5): e0155057, 2016. DOI: 10.1371/journal.pone.0155057 [DOI] [PMC free article] [PubMed] [Google Scholar]
- 13.Li Y, Buckhaults P, Cui X and Tollefsbol TO: Combinatorial epigenetic mechanisms and efficacy of early breast cancer inhibition by nutritive botanicals. Epigenomics 8(8): 1019–1037, 2016. DOI: 10.2217/epi-2016-0024 [DOI] [PMC free article] [PubMed] [Google Scholar]
- 14.Varghese E, Samuel SM, Abotaleb M, Cheema S, Mamtani R and Busselberg D: The “yin and yang” of natural compounds in anticancer therapy of triple-negative breast cancers. Cancers (Basel) 10(10), 2018 DOI: 10.3390/cancers10100346 [DOI] [PMC free article] [PubMed] [Google Scholar]
- 15.Li MJ, Yin YC, Wang J and Jiang YF: Green tea compounds in breast cancer prevention and treatment. World J Clin Oncol 5(3): 520–528, 2014. DOI: 10.5306/wjco.v5.i3.520 [DOI] [PMC free article] [PubMed] [Google Scholar]
- 16.Lee WJ, Shim JY and Zhu BT: Mechanisms for the inhibition of DNA methyltransferases by tea catechins and bioflavonoids. Mol Pharmacol 68(4): 1018–1030, 2005. DOI: 10.1124/mol.104.008367 [DOI] [PubMed] [Google Scholar]
- 17.Codd R, Braich N, Liu J, Soe CZ and Pakchung AA: Zn(ii)-dependent histone deacetylase inhibitors: Suberoylanilide hydroxamic acid and trichostatin a. Int J Biochem Cell Biol 41(4): 736–739, 2009. DOI: 10.1016/j.biocel.2008.05.026 [DOI] [PubMed] [Google Scholar]
- 18.Peela N, Barrientos ES, Truong D, Mouneimne G and Nikkhah M: Effect of suberoylanilide hydroxamic acid (saha) on breast cancer cells within a tumor-stroma microfluidic model. Integr Biol (Camb) 9(12): 988–999, 2017. DOI: 10.1039/c7ib00180k [DOI] [PubMed] [Google Scholar]
- 19.Zhou Q, Agoston AT, Atadja P, Nelson WG and Davidson NE: Inhibition of histone deacetylases promotes ubiquitin-dependent proteasomal degradation of DNA methyltransferase 1 in human breast cancer cells. Mol Cancer Res 6(5): 873–883, 2008. DOI: 10.1158/1541-7786.Mcr-07-0330 [DOI] [PMC free article] [PubMed] [Google Scholar]
- 20.Li Y, Meeran SM and Tollefsbol TO: Combinatorial bioactive botanicals re-sensitize tamoxifen treatment in er-negative breast cancer via epigenetic reactivation of eralpha expression. Sci Rep 7(1): 9345, 2017. DOI: 10.1038/s41598-017-09764-3 [DOI] [PMC free article] [PubMed] [Google Scholar]
- 21.Royston KJ, Udayakumar N, Lewis K and Tollefsbol TO: A novel combination of withaferin a and sulforaphane inhibits epigenetic machinery, cellular viability and induces apoptosis of breast cancer cells. Int J Mol Sci 18(5), 2017 DOI: 10.3390/ijms18051092 [DOI] [PMC free article] [PubMed] [Google Scholar]
- 22.Cohen I, Poreba E, Kamieniarz K and Schneider R: Histone modifiers in cancer: Friends or foes? Genes Cancer 2(6): 631–647, 2011. DOI: 10.1177/1947601911417176 [DOI] [PMC free article] [PubMed] [Google Scholar]
- 23.Choi KC, Jung MG, Lee YH, Yoon JC, Kwon SH, Kang HB, Kim MJ, Cha JH, Kim YJ, Jun WJ, Lee JM and Yoon HG: Epigallocatechin-3-gallate, a histone acetyltransferase inhibitor, inhibits ebv-induced b lymphocyte transformation via suppression of rela acetylation. Cancer Res 69(2): 583–592, 2009. DOI: 10.1158/0008-5472.Can-08-2442 [DOI] [PubMed] [Google Scholar]
- 24.Chou TC: Drug combination studies and their synergy quantification using the chou-talalay method. Cancer Res 70(2): 440–446, 2010. DOI: 10.1158/0008-5472.Can-09-1947 [DOI] [PubMed] [Google Scholar]
- 25.Chang TP and Vancurova I: Bcl3 regulates pro-survival and pro-inflammatory gene expression in cutaneous t-cell lymphoma. Biochim Biophys Acta 1843(11): 2620–2630, 2014. DOI: 10.1016/j.bbamcr.2014.07.012 [DOI] [PMC free article] [PubMed] [Google Scholar]
- 26.Grigoriev MY, Pozharissky KM, Hanson KP, Imyanitov EN and Zhivotovsky B: Expression of caspase-3 and −7 does not correlate with the extent of apoptosis in primary breast carcinomas. Cell Cycle 1(5): 337–342, 2002. [PubMed] [Google Scholar]
- 27.Hashimoto T, Yamauchi L, Hunter T, Kikkawa U and Kamada S: Possible involvement of caspase-7 in cell cycle progression at mitosis. Genes Cells 13(6): 609–621, 2008. DOI: 10.1111/j.1365-2443.2008.01192.x [DOI] [PubMed] [Google Scholar]
- 28.Matalova E, Lesot H, Svandova E, Vanden Berghe T, Sharpe PT, Healy C, Vandenabeele P and Tucker AS: Caspase-7 participates in differentiation of cells forming dental hard tissues. Dev Growth Differ 55(5): 615–621, 2013. DOI: 10.1111/dgd.12066 [DOI] [PubMed] [Google Scholar]
- 29.Majorini MT, Manenti G, Mano M, De Cecco L, Conti A, Pinciroli P, Fontanella E, Tagliabue E, Chiodoni C, Colombo MP, Delia D and Lecis D: Ciap1 regulates the egfr/snai2 axis in triple-negative breast cancer cells. Cell Death Differ 25(12): 2147–2164, 2018. DOI: 10.1038/s41418-018-0100-0 [DOI] [PMC free article] [PubMed] [Google Scholar]
- 30.Lewis KA and Tollefsbol TO: Regulation of the telomerase reverse transcriptase subunit through epigenetic mechanisms. Front Genet 7: 83, 2016. DOI: 10.3389/fgene.2016.00083 [DOI] [PMC free article] [PubMed] [Google Scholar]
- 31.Choi JH, Min NY, Park J, Kim JH, Park SH, Ko YJ, Kang Y, Moon YJ, Rhee S, Ham SW, Park AJ and Lee KH: Tsa-induced dnmt1 down-regulation represses htert expression via recruiting ctcf into demethylated core promoter region of htert in hct116. Biochem Biophys Res Commun 391(1): 449–454, 2010. DOI: 10.1016/j.bbrc.2009.11.078 [DOI] [PubMed] [Google Scholar]
- 32.Ou JN, Torrisani J, Unterberger A, Provencal N, Shikimi K, Karimi M, Ekstrom TJ and Szyf M: Histone deacetylase inhibitor trichostatin a induces global and gene-specific DNA demethylation in human cancer cell lines. Biochem Pharmacol 73(9): 1297–1307, 2007. DOI: 10.1016/j.bcp.2006.12.032 [DOI] [PubMed] [Google Scholar]
- 33.Shi TY, He J, Wang MY, Zhu ML, Yu KD, Shao ZM, Sun MH, Wu X, Cheng X and Wei Q: Casp7 variants modify susceptibility to cervical cancer in chinese women. Sci Rep 5(9225, 2015. DOI: 10.1038/srep09225 [DOI] [PMC free article] [PubMed] [Google Scholar]
- 34.Soung YH, Lee JW, Kim HS, Park WS, Kim SY, Lee JH, Park JY, Cho YG, Kim CJ, Park YG, Nam SW, Jeong SW, Kim SH, Lee JY, Yoo NJ and Lee SH: Inactivating mutations of caspase-7 gene in human cancers. Oncogene 22(39): 8048–8052, 2003. DOI: 10.1038/sj.onc.1206727 [DOI] [PubMed] [Google Scholar]
- 35.Huang Q, Li F, Liu X, Li W, Shi W, Liu FF, O’Sullivan B, He Z, Peng Y, Tan AC, Zhou L, Shen J, Han G, Wang XJ, Thorburn J, Thorburn A, Jimeno A, Raben D, Bedford JS and Li CY: Caspase 3-mediated stimulation of tumor cell repopulation during cancer radiotherapy. Nat Med 17(7): 860–866, 2011. DOI: 10.1038/nm.2385 [DOI] [PMC free article] [PubMed] [Google Scholar]
- 36.Lindner AU, Lucantoni F, Vareslija D, Resler A, Murphy BM, Gallagher WM, Hill ADK, Young LS and Prehn JHM: Low cleaved caspase-7 levels indicate unfavourable outcome across all breast cancers. J Mol Med (Berl) 96(10): 1025–1037, 2018. DOI: 10.1007/s00109-018-1675-0 [DOI] [PubMed] [Google Scholar]
- 37.Choudhury SR, Balasubramanian S, Chew YC, Han B, Marquez VE and Eckert RL: (−)-epigallocatechin-3-gallate and dznep reduce polycomb protein level via a proteasome-dependent mechanism in skin cancer cells. Carcinogenesis 32(10): 1525–1532, 2011. DOI: 10.1093/carcin/bgr171 [DOI] [PMC free article] [PubMed] [Google Scholar]
- 38.Yasuda H, Soejima K, Watanabe H, Kawada I, Nakachi I, Yoda S, Nakayama S, Satomi R, Ikemura S, Terai H, Sato T, Suzuki S, Matsuzaki Y, Naoki K and Ishizaka A: Distinct epigenetic regulation of tumor suppressor genes in putative cancer stem cells of solid tumors. Int J Oncol 37(6): 1537–1546, 2010. DOI: 10.3892/ijo_00000807 [DOI] [PubMed] [Google Scholar]
- 39.Wen Y, Cai J, Hou Y, Huang Z and Wang Z: Role of ezh2 in cancer stem cells: From biological insight to a therapeutic target. Oncotarget 8(23): 37974–37990, 2017. DOI: 10.18632/oncotarget.16467 [DOI] [PMC free article] [PubMed] [Google Scholar]
- 40.Knight JF, Sung VYC, Kuzmin E, Couzens AL, de Verteuil DA, Ratcliffe CDH, Coelho PP, Johnson RM, Samavarchi-Tehrani P, Gruosso T, Smith HW, Lee W, Saleh SM, Zuo D, Zhao H, Guiot MC, Davis RR, Gregg JP, Moraes C, Gingras AC and Park M: Kibra (wwc1) is a metastasis suppressor gene affected by chromosome 5q loss in triple-negative breast cancer. Cell Rep 22(12): 3191–3205, 2018. DOI: 10.1016/j.celrep.2018.02.095 [DOI] [PMC free article] [PubMed] [Google Scholar]
- 41.Liu X, Li C, Zhang R, Xiao W, Niu X, Ye X, Li Z, Guo Y, Tan J and Li Y: The ezh2-h3k27me3-dnmt1 complex orchestrates epigenetic silencing of the wwc1 gene, a hippo/yap pathway upstream effector, in breast cancer epithelial cells. Cell Signal 51: 243–256, 2018. DOI: 10.1016/j.cellsig.2018.08.011 [DOI] [PubMed] [Google Scholar]
- 42.Ioachim E, Charchanti A, Briasoulis E, Karavasilis V, Tsanou H, Arvanitis DL, Agnantis NJ and Pavlidis N: Immunohistochemical expression of extracellular matrix components tenascin, fibronectin, collagen type iv and laminin in breast cancer: Their prognostic value and role in tumour invasion and progression. Eur J Cancer 38(18): 2362–2370, 2002. DOI: 10.1016/s0959-8049(02)00210-1 [DOI] [PubMed] [Google Scholar]
- 43.Li CL, Yang D, Cao X, Wang F, Hong DY, Wang J, Shen XC and Chen Y: Fibronectin induces epithelial-mesenchymal transition in human breast cancer mcf-7 cells via activation of calpain. Oncol Lett 13(5): 3889–3895, 2017. DOI: 10.3892/ol.2017.5896 [DOI] [PMC free article] [PubMed] [Google Scholar]
- 44.Park J and Schwarzbauer JE: Mammary epithelial cell interactions with fibronectin stimulate epithelial-mesenchymal transition. Oncogene 33(13): 1649–1657, 2014. DOI: 10.1038/onc.2013.118 [DOI] [PMC free article] [PubMed] [Google Scholar]
- 45.Lambert JD and Elias RJ: The antioxidant and pro-oxidant activities of green tea polyphenols: A role in cancer prevention. Arch Biochem Biophys 501(1): 65–72, 2010. DOI: 10.1016/j.abb.2010.06.013 [DOI] [PMC free article] [PubMed] [Google Scholar]
- 46.Pae M and Wu D: Immunomodulating effects of epigallocatechin-3-gallate from green tea: Mechanisms and applications. Food Funct 4(9): 1287–1303, 2013. DOI: 10.1039/c3fo60076a [DOI] [PubMed] [Google Scholar]


