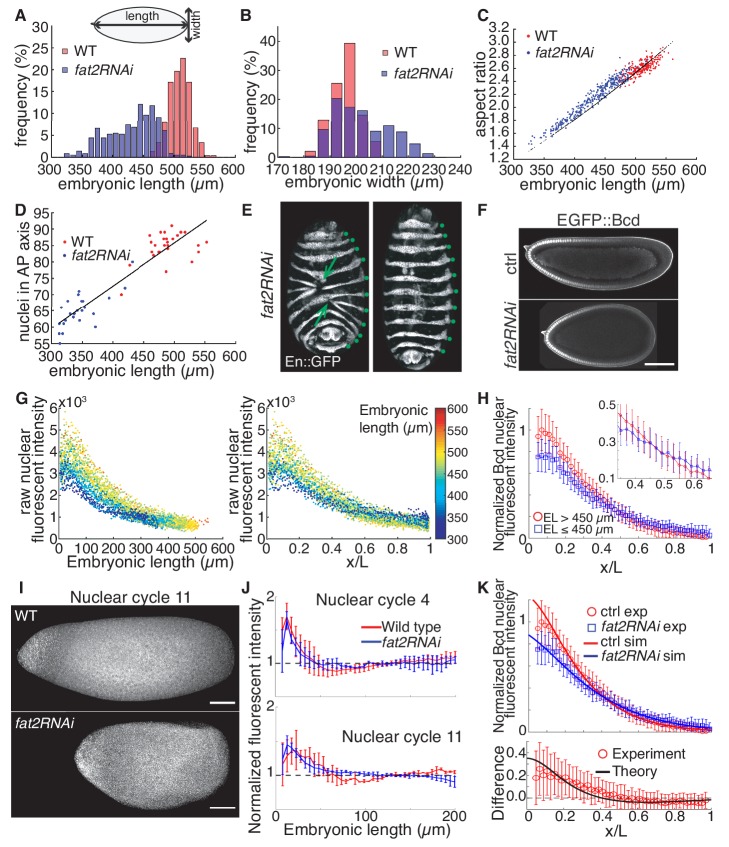
Figure 1. The Bcd gradient in embryos with differing geometry is consistent with the SDD model.
(A) Distribution of embryonic length in wild type (n = 239) and fat2RNAi (n = 364) embryos. (B) Distribution of embryonic width in wild type (n = 239) and fat2RNAi (n = 364) embryos. (C) Aspect ratio (EL/EW) against embryonic length for each embryo. Black dots denote expected aspect ratio if embryonic volume is conserved (assuming ellipsoidal geometry). (D) Number of nuclei along the AP axis plotted against embryonic length in wild type and fat2RNAi embryos. Line indicates linear regression of all data. (E) En expression in fat2RNAi embryos showing defective dorsal closure (left) or normal morphogenesis (right). Arrows indicate locations of defects. Green dots indicate En stripes. (F) Midsagittal plane of ctrl (top) and fat2RNAi (bottom) embryos expressing eGFP::Bcd in mid n.c. 14. (G) eGFP::Bcd profiles of both ctrl and fat2RNAi embryos plotted as a function of absolute distance from the anterior pole (left) or scaled AP position (right). Each dot represents the average concentration in a single nucleus. Colormap indicates the absolute AP length of each individual. (H) Mean and standard deviation of nuclear intensity within each 2% EL were computed for group of embryos longer (red, n = 27) and shorter (blue, n = 17) than 450 µm. Inset is close-up of profile near embryo midpoint to show the intersection of the two curves. (I) Representative fluorescent in situ hybridization (FISH) against bcd mRNA in wild type (top) and fat2RNAi (bottom) in n.c. 11 embryos. Scale bar, 50 μm. (J) Fluorescent intensity profile of FISH assay along AP axis in n.c. 4 (top) and n.c. 11 (bottom). Normalization to measured fluorescence signal in the region 120 μm from anterior. n = 5, 2 (n.c. 4) and n = 2,2 (n.c. 11) for wild type (red) and fat2RNAi (blue) respectively. Error bars show standard deviation. (K) Fitting of SDD model to experimentally measured Bcd gradient. All parameters, as outlined in Materials and methods, are kept constant, with only change being embryonic geometry. See Materials and methods for details. Lower panel shows intensity difference in experimental measurements and predicted profiles along the AP-axis.


