

Abstract

Pesticides are used in agriculture for crop production enhancement by controlling pests, but they have acute toxicological effects on other life forms. Thus, it becomes imperative to detect their concentration in food products in a fast and accurate manner. In this study, ZnO nanoparticles (ZnO nps) have been used as optical sensors for the detection of pesticide Aldicarb via a photoinduced electron transfer (PET) route. ZnO nps were synthesized directly by calcining zinc acetate at 450, 500, and 550 °C for 2 h. ZnO nps were characterized by X-ray diffraction (XRD), Raman spectroscopy, scanning electron microscopy (SEM), and UV–vis absorption and photoluminescence (PL) spectroscopies to study the phase, crystallinity, shape, morphology, absorbance, and fluorescence of the prepared ZnO nps. XRD and Raman studies confirmed the crystalline nature of ZnO nps. The average crystallite size obtained was 13–20 nm from the XRD study. The SEM study confirmed spherical-shaped ZnO nps with average sizes in the range of 70–150 nm. The maximum absorbance was obtained in the 200–500 nm regions with a prominent peak absorbance at 372 nm from UV–vis spectra. The corresponding band gap for ZnO nps was calculated using Tauc’s plots and was found to be 3.8, 3.67, and 3.45 eV for the 450, 500, and 550 °C calcined samples, respectively. The fluorescence spectra showed an increase in the intensity along with the increase in the size of ZnO nps. The ZnO nps (samples calcined at 500 and 550 °C) exhibited a response toward Aldicarb, owing to their pure phase and higher PL intensity. Both the samples showed systematic detection of Aldicarb in the range of 250 pM to 2 nM (500 °C) and 250 pM to 5 nM (550 °C). Among the various quenching mechanisms, PET was found to be the dominant process for the detection of Aldicarb. This method can be used for the detection of Aldicarb in real (food) samples using a portable fluorimeter.
Introduction
Nanostructured zinc oxide (ZnO nps) is a fascinating material due to its unique properties. It exhibits high surface area; physical, chemical, thermal, and photochemical stability; biocompatibility; nontoxicity; optical transparency along with facile synthesis; higher analytical performance; and enhanced sensitivity, with significant stability at physiological pH.1−3 Besides these properties, it possesses good electron transport, a large electrochemical coupling constant, and radiation absorption properties making it a multifunctional material.4−6 It is classified as a II–VI semiconductor with a wide band gap (3.0 eV) and has covalence that exists between the ionic and covalent semiconductors.7,8 Also, it is a polar transparent semiconductor with unparalleled piezoelectric and electron transport properties.9−11 Therefore, ZnO nps is a promising material having applications in diverse fields such as blue/UV optoelectronics, transparent electronics, energy conversion, plasmonics, spintronics, and sensors.
ZnO crystals of various shapes in the hexagonal wurtzite crystalline phase were synthesized by different synthesis methods with n-type semiconducting nature. ZnO in the doped and undoped form has been used for several applications such as in gas, chemical, and heavy metal ion sensors.12−15 ZnO compounds formed with considerable covalent bonding between Zn 3d and O 2p orbitals lead to wide-band-gap materials.16 ZnO of various shapes exhibits two luminescence bands: one is located at the absorption edge, also called the edge luminescence peak, that occurs at a shorter wavelength and the other is a wide band at higher wavelengths, generally located in the green wavelength range.17,18 The edge luminescence is excitonic, and the green luminescence may be obtained for various reasons such as impurities, Zn and O vacancies, and interstitial ions, but the principal reason behind this is yet to understand.10,19 However, the luminescence properties can be used for optical sensors and biosensors for the detection of desired analytes.
Pesticides are generally used in crop production to control pests and, thereby, to increase the quality and production of crops but, at the same time, are harmful to animals and humankind.20 They cause respiratory diseases, nerve and bone marrow disorders, infertility, and immunological disorders; some are carcinogenic in nature. Mainly, organophosphates and carbamates are widely used these days, as they have less toxicity and faster degradation properties as compared to other groups.21 The Environmental Protection Agency has set limit levels for these pesticides to overcome their toxic effects for which efficient detection methods are required. The analytical methods presently used for the detection of these pesticides, such as gas chromatography–mass spectrometry, etc., have limited daily use, as they cannot be used on-site due to their elaborated instrumentation and time-consuming and costly process.22,23 Therefore, optical sensors/biosensors are the best alternatives to overcome these limitations and to perform rapid and cost-effective detection.24 Nowadays, optical detection is grabbing more attention of researchers, as it provides high precision and rapid detection with label-free methods.25,26 Among the other optical sensing mechanisms, fluorescence-based sensing is more sensitive, as the intensity changes are measured directly without any comparison with the reference.27 Aldicarb is a carbamate pesticide, generally used for controlling a wide range of pests. Human beings are exposed to it through food chains, and it is highly toxic.28 It is observed that only a few reports have been published in the literature for the optical sensing of Aldicarb. A chemidosimetric device based on bimetallic donor–acceptor ensembles for the detection of Aldicarb has been developed. The authors have reported a detection range varying from 0.48 to 0.60 ppm.29 An Eu(III)–3-carboxycoumarin interaction with Aldicarb and two other pesticides was detected using fluorescence quenching and electrochemical methods. The limit of detection in the fluorescence method was reported to be in the μM range.30 A fluorescent biosensor for the detection of carbamate pesticides has been developed based on triggering of Hg2+ by an acetylcholinesterase (AChE)-catalyzed hydrolysis product, and the limit obtained was 3.3 μg L–1.31 Thus, there is a wide scope for developing optical sensors for Aldicarb detection.
In the development of optical chemisensors, the mechanism that is accepted widely is the photoinduced electron transfer (PET) mechanism.32,33 The electron transfer takes place in these systems by either an oxidative or a reductive process and is termed as a photoinduced oxidative/reductive electron transfer process. PET can also be classified as a quenching pathway. In this process, the electron transfer is mainly between the ground and photoexcited states and involves a dynamic interaction between the neighboring ground state and the photoexcited state species. It is similar to an energy transfer quenching process, whereas in PET, the excited state may be either an electron acceptor or a donor, not as in the case of the energy transfer process, where the excited state is entirely an energy donor. The energy transfer in this process is realized by an electron exchange. This electron transfer leads to the formation of intermediate states and radical ion pairs, and the system relaxes to its ground state via charge recombination.34 The energies of the donor and acceptor are mainly dictated by the redox potentials of the respective species.
In this study, ZnO nps were synthesized by one-step thermal treatment of zinc acetate and were employed in a PET-based “turn-off” (fluorescence quenching) sensor for the detection of Aldicarb. The novelty of this study is that ZnO nps were synthesized using a relatively simple, rapid, and inexpensive method by directly calcining zinc acetate at 450, 500, and 550 °C.35 These ZnO nps were utilized for the detection of Aldicarb with photoluminescence (PL) spectroscopy without using any biomolecule. A broader detection range was obtained from 250 pM to 2 nM with a lower detection limit of 250 pM as compared to previously reported literature (Table 1). Here, the detailed mechanism of the PET-based ZnO PL sensor for Aldicarb detection is explained. The PET process was found to be the dominant process over fluorescence resonance energy transfer (FRET) and static-dynamic quenching mechanisms. This study is the first report on PET-based optical sensing of Aldicarb using ZnO nps.
Table 1. Optical Sensors for the Detection of Aldicarb in the Literature and the Present ZnO Sensor.
| nanomaterial | method of detection | biomolecule | range/lower detection | ref |
|---|---|---|---|---|
| bimetallic chemidosimetric device of Re–Pt | color change | nil | 0.48–0.60 ppm | (29) |
| Eu(III)-3-carboxycoumarin | fluorescence | nil | μM range | (30) |
| Hg2+ | fluorescence | (AChE)-duplex DNA | 3.3 μg L–1 | (31) |
| ZnO nps | fluorescence | nil | 250 pM to 2.0 nM/250 pM | this work |
Results and Discussion
Structural Characterization
Figure 1a shows the X-ray diffraction (XRD) profile of the ZnO nps calcined at 450, 500, and 550 °C. Narrow and sharp peaks were observed, confirming the high crystallinity of the samples. These peaks were indexed using the JCPDS card no. 897102 with a wurtzite structure and space group P63mc.36,37 The Scherrer formula was utilized to calculate the average crystallite size.38 The average crystallite sizes were found to be 13, 17, and 20 nm for the 450, 500, and 550°C calcined samples, respectively. There are some impurities found in the samples calcined at 450 and 500 °C, as denoted by “*” in Figure 1a. However, there are fewer impurities in the sample calcined at 500 °C as compared to that calcined at 450 °C, whereas the sample calcined at 550 °C is highly pure without any impurities. To further confirm the structure, surface defects, and oxygen vacancies in the material, a Raman study was performed.
Figure 1.

(a) XRD plot and (b) Raman plot of ZnO nps calcined at (i) 450, (ii) 500, and (iii) 550 °C.
Figure 1b shows the Raman spectra of ZnO nps. Six peaks with wavenumbers at 326, 384, 435, 580, 978, and 1150 cm–1 were obtained in the Raman spectra. In this structure, there was a significant peak centered at around 435 cm–1.37 This peak corresponds to the wurtzite structure of ZnO with the E2 high mode that is associated with the vibration of the O and Zn atoms.39 The peak at 326 cm–1 corresponds to the second-order E2 mode,40 whereas the peak at 384 cm–1 corresponds to the second-order A1 (TO) mode.41 The peak at 580 cm–1 is attributed to the E (LO) mode and represents oxygen deficiencies and surface defects.42,43 The peak at 1060 cm–1 in the sample calcined at 450 °C is due to the impurities present in the sample. This study confirms that the sample calcined at 550 °C has a pure wurtzite phase, whereas the other two samples have some minor impurities.
Shape and Morphology Study
A field-emission scanning electron microscopy (FESEM) study was used to observe the morphology of the ZnO nps. Figure 2 shows the FESEM and energy-dispersive X-ray spectroscopy (EDAX) images of the ZnO nps, where spherical-shaped nanoparticles are observed. The very small sized nanoparticles with a higher surface area lead to the agglomeration of the nanoparticles. It is evident from the image that the ZnO nps are of small size (<50 nm). As expected, with the increase in calcination temperature (450, 500, and 550°C), the average size of the nanoparticles increases (70, 80, and 150 nm).44 Also, EDAX was performed to study the elemental composition of the three samples (ZnO at 550, 500, and 450 °C). These results confirmed the presence of zinc (Zn), oxygen (O), and carbon (C) in all samples. The presence of carbon (C) in all samples is due to the carbon tape used for sample mounting.
Figure 2.

FESEM images (left side) and the corresponding EDAX images (right side) of the ZnO nps.
Optical Study
Optical properties were studied using UV–vis absorption spectroscopy (Figure 3a). It can be seen from the figure that with the increase in the temperature, and thereby particle size, the absorbance intensity decreases. The band gap was measured using the Tauc plot, as shown in the inset of Figure 3a. This plot gives the optical band gap, Eg, by extrapolating the plot of (αhν)2 versus hν onto the x-axis.23 The corresponding band gaps obtained are 3.87; 3,72 and 3.35 eV for the 450, 500, and 550 °C calcined samples, respectively. The absorption spectrum of ZnO shows a significant sharp peak at 372 nm, which implies monodisperse ZnO nps in solution.45
Figure 3.
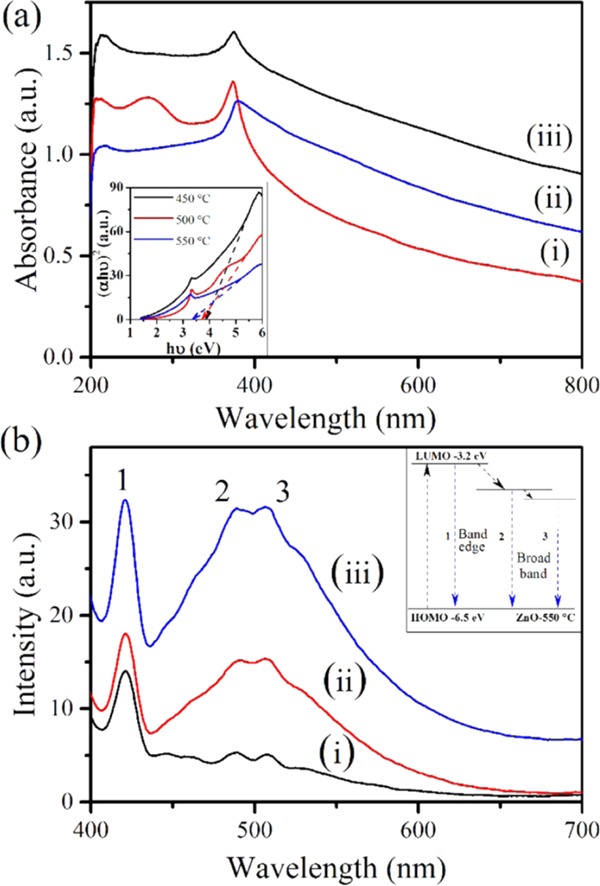
(a) UV–vis absorbance spectra and the corresponding band gap plot (inset) and (b) PL spectra of the ZnO nps calcined at (i) 450, (ii) 500, and (iii) 550 °C.
Figure 3b shows the photoluminescence spectra of the ZnO nps. There are two peaks that appeared in the spectra of all three (450, 500, and 550 °C calcined) samples, and the fluorescence increases with an increase in calcination temperature. This is because the increased particle size and decreased band gap of the material lead to an increase in the number of de-excited electrons, which leads to an increase in the electron–hole recombination.46,47 The peak at a wavelength of 420 nm arises due to the band edge, and the second split, broad peak at wavelengths of 486 and 506 nm arises due to surface defects/deficiency of atoms/dangling bonds. The inset of Figure 3b shows the corresponding band gaps of the three peaks.
Response Study of Aldicarb Using PL Spectroscopy
As observed from the above studies, the sample calcined at 450 °C possesses impurities. Therefore, the response of ZnO nps as a function of Aldicarb concentration was monitored using the 500 and 550 °C calcined ZnO nps. Figure 4a,b shows the detection with ZnO nps calcined at 500 and 550 °C, respectively. From these two figures, it can be seen that with the increase in the concentration of Aldicarb, the fluorescence intensity is decreased. These results indicated that a slow interaction occurred between the ZnO nps and the sulfur present in Aldicarb, which led to fluorescence quenching that increased with increased Aldicarb concentration.
Figure 4.

PL spectra of Aldicarb detection by ZnO nps calcined at (a) 500 °C and (b) 550°C.
Figure 5 shows the corresponding calibration plots obtained from the PL spectra given in Figure 4. It can be seen that the linear detection range is slightly higher (250 pM to 5 nM) for the ZnO nps calcined at 550 °C than that of the 500 °C calcined sample (250 pM to 2 nM), as shown in Figure 5b,a, respectively. The increase in the upper detection limit of the 550 °C calcined ZnO nps is due to the presence of higher surface defects and oxygen vacancies. These defects and vacancies were confirmed from Raman spectra.
Figure 5.

Calibration plot for Aldicarb detection by ZnO nps calcined at (a) 500 °C and (b) 550 °C.
The Fourier transform infrared (FTIR) spectra of (a) ZnO-550 °C, (b) Aldicarb, and (c) Aldicarb + ZnO-550 °C individually were obtained after dispersion in deionized water (Figure 6) with water as the background. The peak at 417 cm–148 in spectrum (a) corresponds to the metal–oxygen (Zn–O) bond vibration. The low-intensity peaks at 1220, 1270, and 1700 cm–1 represent the antisymmetric vibrations of the O–C–O bond that may arise due to the impurities absorbed from the atmosphere, which can be neglected.49 In spectrum (b) of Aldicarb, the peaks corresponding to sulfoxide (1050 cm–1), C–O–C (1220 cm–1), N–H (1640 cm–1), and the chain deformation vibrations of C–H (450–480 cm–1) were observed.50 A small peak at 1227 cm–1 corresponds to the OH in-plane bending vibration. When Aldicarb was mixed with ZnO, spectrum (c) showed many changes as compared to the spectra of (a) and (b). The intensity of the peak at 410 cm–1 was decreased. A wide hump appearing at 678 cm–1, corresponding to the characteristic Zn–S bond vibration, confirms that the sulfur present in Aldicarb is bonded with Zn.51 An IR peak appeared at 875 cm–1 (CH2 out-of-plane wagging band), confirming deformed Aldicarb. The intensity of the sulfoxide peak at 1050 cm–1 increased drastically, and a new peak corresponding to SO3H appeared at 1080 cm–1. The peak at 1220 cm–1 corresponding to C–O–C was still present but with very low intensity. Therefore, it can be concluded that the FTIR studies confirmed the bond formation between Zn in ZnO and S of Aldicarb.
Figure 6.

FTIR spectra of ZnO-550 °C, Aldicarb, and ZnO-550 °C with Aldicarb.
The highest occupied molecular orbital (HOMO) and lowest unoccupied molecular orbital (LUMO) of the ZnO nps were calculated using eqs 1 and 2 as given below
| 1 |
| 2 |
where EHOMO and ELUMO are the energy levels of the highest occupied molecular orbital (HOMO) and the lowest unoccupied molecular orbital (LUMO), respectively, Eoxidationonset and Ereduction are the oxidation and reduction values, respectively, in the CV plot, and 4.4 is an adjustment factor.52 The LUMO value for ZnO-500 °C was −3.54 eV, whereas the HOMO value was −5.83 eV. For ZnO-550 °C, the LUMO was −3.2 eV and HOMO was −6.5 eV. The band gap value for ZnO-550 °C was calculated using eq 3(53)
| 3 |
CV characterization of ZnO-550 °C is shown in Figure 7. The band gap was found to be 3.2 eV for 500 °C calcined ZnO and 3 eV for 550 °C calcined ZnO. These band gaps are similar in trend to the values obtained from UV–vis spectroscopy. Using the HOMO and LUMO levels of ZnO, the band gap of ZnO has been proposed.
Figure 7.

Cyclic voltammetry (CV) plot of the ZnO nps calcined at 500 and 550 °C.
In the present case, the mechanism for quenching has been explained as oxidative photoinduced electron transfer, as shown in Figure 8. The HOMO and LUMO energy levels of the ZnO nps were estimated using the CV plots to be −6.2 and −3.0 eV, respectively.54 The HOMO and LUMO energy levels of Aldicarb were calculated using the B3LYP method in the 6-311G basis set (Gaussian theoretical analysis). The HOMO and LUMO energy levels of Aldicarb were obtained to be −6.3 and −0.3 eV, respectively. The band gaps of the ZnO nanoparticles and Aldicarb were 3.2 and 6.0 eV, respectively. The HOMO energy levels of both ZnO nps and Aldicarb have nearly the same value, whereas the LUMO energy levels of Aldicarb and ZnO nps have a huge difference, as shown in the energy level diagram (Figure 8). When a mixture of Aldicarb and ZnO was excited with 370 nm light, the electrons in the ZnO nps jumped from the HOMO to the LUMO and formed two different semi-occupied molecular orbital states, (SOMO)H and (SOMO)L, respectively. Further, (SOMO)L was occupied with one electron (here subscripts H and L correspond to the HOMO and LUMO levels, respectively). Now, (SOMO)H will act as an acceptor and (SOMO)L will act as a stronger electron donor. When the molecules of ZnO nps and Aldicarb come into contact, Aldicarb is adsorbed on the surface of ZnO molecules, and the electron present in the HOMO of Aldicarb will jump to (SOMO)H, as the energy difference between the two levels is adequate for PET (Figure 8), leading to fluorescence quenching. During this process, quenching takes place with heat dissipation. In the present process, the phenomena of static quenching, dynamic quenching, and the FRET quenching process were ruled out for the following reasons: in the case of static quenching, the change in UV–vis spectra takes place due to complex formation. The complex forms in the ground state itself and, thereby, prevents fluorescence emission.55 It was found that there is no peak position change observed in the UV–vis absorption spectra of ZnO nps with the addition of Aldicarb, indicating no complex formation in the system. In FRET, dynamic quenching occurs, when the donor is in the excited state. In the present case, the donor (Aldicarb) is not in the excited state. Therefore, FRET is ruled out. Similarly, in other dynamic quenching processes, the complex formation takes place in the excited state leading to quenching, which is not there in the present case.55
Figure 8.

Schematic illustration of the PET mechanism.
Figure 9 shows the plot for TRF results for ZnO nps calcined at 500 and 550 °C. Decays of ZnO and ZnO with Aldicarb were fitted by the bi-exponential function
| 4 |
where a1 and a2 are the corresponding amplitudes of decays τ1 and τ2.
Figure 9.

Time-resolved fluorescence plots for ZnO (550 °C) and ZnO (550 °C) + Aldicarb (5 nM).
The calculated lifetimes of pure ZnO were 40 and 360 ps, whereas those of ZnO with Aldicarb (5 nM) were 112 and 1920 ps, corresponding to τ1 and τ2. These values are in good agreement with the previously reported values for ZnO.56 ZnO with Aldicarb exhibited a longer radiative lifetime than pure ZnO, which indicated that the photogenerated carriers from ZnO diffused to a certain distance in the ZnO + Aldicarb mixture before the radiative recombination, which occurred due to the trapped e–. These trapped e–s are generated from the process explained in the scheme given in Figure 8. In this process, the e– from the HOMO of ZnO was excited to (SOMO)L and stayed there for a few nanoseconds, and then, it was de-excited to the HOMO of Aldicarb. The time taken to stay in (SOMO)L led to the increased decay time in ZnO + Aldicarb.
Figure 10 shows the optical quenching of ZnO nps using the Aldicarb pesticide via PET. Aldicarb has mainly three types of electron-donating groups, namely, O (oxygen), S (sulfur), and N (nitrogen). However, S shows better electron donor capability when compared to others, i.e., N and O. Because of the soft acidic behavior of Zn (Zn lies between hard and soft acids) and the soft basic character of S, the interaction between Zn and S is more feasible, and the phenomenon is known as a soft–soft acid–base interaction.57 The interaction of the S group (Aldicarb) and ZnO nps was also confirmed by FTIR data and Gaussian HOMO–LUMO analysis data. In FTIR data, the low-intensity peak corresponding to ZnS was obtained at 678 cm–1 after the addition of Aldicarb to the ZnO nps suspension. These experimental results were supported by theoretical analysis carried out using Gaussian analysis. The HOMO–LUMO electron cloud density of Aldicarb was generated theoretically using the Gaussian software. It was found that the S atom (yellow) has a higher electron density than O and N in the HOMO energy level; therefore, it contributes more in the electron transfer to SOMO (Figure 9). In conclusion, S of Aldicarb interacts with the ZnO nps to quench the fluorescence intensity after the addition of Aldicarb, which is confirmed by both theoretical and experimental results.
Figure 10.

Mechanism for the detection of Aldicarb using ZnO nps.
Here, the method used for ZnO np synthesis is straightforward and reproducible without using very high calcination temperatures (900 °C). The detection of Aldicarb is performed using a relatively easy and inexpensive method and without using any biomolecule. The optical sensing of other pesticides, namely, aldrin, tetradifon, glyphosate, and atrazine, was carried out using static and time-resolved fluorescence methods using 3-aminopropyltrimethoxysilane (APTES)-capped ZnO QDs, and it was found that aldrin and tetradifon showed a better response than the other two. The authors also reported the degradation of pesticides through photocatalytic degradation.58 In the literature, few reports are available on optical sensing of Aldicarb, and the present work demonstrates the detection of a very low (250 pM) concentration of Aldicarb with a wide detection range (250 pM–2.0 nM). This wide detection range is obtained due to the interaction between the S groups of Aldicarb and ZnO nps.
Table 1 shows a comparison of Aldicarb detection using an optical sensor with earlier literature.
Conclusions
Photoinduced electron transfer (PET)-based detection of Aldicarb was carried out using one-step-synthesized ZnO nps. ZnO nps were synthesized from zinc acetate, and XRD results confirmed the formation of ZnO at all three temperatures (450, 500, and 550 °C). The average crystallite size was found to be in the range of 13–20 nm. The pure wurtzite phase was obtained for the 550 °C calcined sample. FESEM images showed ZnO np formation with an average size in the range of 70–150 nm. The maximum UV absorbance was obtained at 372 nm. The band gap calculated from the UV–vis spectra (3.87–3.35 eV) was found to decrease with the increase in particle size. The fluorescence intensity increased with the increase in the calcination temperature. The band gap of ZnO nps was calculated using cyclic voltammetry, whereas the band gap of Aldicarb was calculated using Gaussian theoretical analysis. Aldicarb detection was obtained in the range of 250 pM–2 nM and 250 pM–5 nM for the 500 and 550 °C samples, respectively. Among various quenching mechanisms, PET was found to be the dominant process and has been explained for optical sensing of Aldicarb using ZnO nps. Thus, we have synthesized ZnO directly by using a relatively simple method and have performed the sensing of Aldicarb without any biomolecule using PL spectroscopy. This method can help in the detection of Aldicarb in real (food) samples using a portable fluorimeter. There is a broad scope for developing a commercial device for pesticide detection in food samples.
Materials and Methods
Zinc acetate dihydrate (22.7 mM) with high purity (>99% SRL) was used as a precursor for the synthesis of ZnO nanoparticles (ZnO nps). The precursor was used as is without any further purification and kept directly in an alumina crucible in a muffle furnace. Zinc acetate was then calcined separately at three different temperatures of 450, 500, and 550 °C for 2 h each to obtain the white-colored powder of ZnO nps. The obtained ZnO powders (ZnO nps) were used for further characterization. Given below is the chemical reaction for the synthesis of ZnO nanoparticles by directly calcining zinc acetate.
Characterization Techniques
X-ray diffraction (Rigaku MiniFlex 600 X-ray diffractometer with Cu Kα radiation (λ = 1.54 Å) operating at 40 kV and 15 mA) was used to study the crystal structure and phase of the three samples. XRD spectra of the ZnO nps were obtained in the range of 20–80° at a scan rate of 3°/min with a step size of 0.02°. A Raman study was carried out to further confirm the phase and structure of the ZnO nps. Raman spectra were recorded using an Enspectr R 532 in the range of 250–1250 cm–1 using an excitation wavelength of 532 nm. The shape, morphology, and crystal structure of the material were studied using field-emission scanning electron microscopy (FESEM) (MIRA II KMH-TESCAN) at 25 keV. Energy-dispersive X-ray spectroscopy (EDAX) (Bruker) was also performed to conduct the elemental analysis of the samples attached to the FESEM machine. Optical properties were studied using UV–visible absorption spectroscopy (T90 + UV spectrometer, PG Instruments Ltd.) and photoluminescence spectroscopy (Carry Eclipse spectrophotometer, Agilent Technologies). The band gap was calculated using Tauc’s plots. Photoluminescence (PL) studies were carried out to study the fluorescence properties of ZnO nps as well as for the detection of Aldicarb. Fluorescence lifetime decay was recorded in a commercial TCSPC setup FL-920 (Edinburgh Instruments) by exciting the samples at 375 nm using a picosecond diode laser (pulse width ∼60 ps). In the Aldicarb detection study, the 500 and 550 °C samples were used owing to their excellent crystallinity and pure phase. Both the samples showed good detection of Aldicarb in the range of 250 pM–2 nM.
Acknowledgments
The authors are grateful to the Advanced Instrument Research Facility (AIRF) and School of Physical Science (SPS), JNU, for providing the instrumentation facility. GBVSL is grateful to the DST for funding through a DST Women Scientist Project (SR/WOS-A/PM-108/2016). This work was supported by a grant from the Department of Science & Technology, Government of India, through a DST Purse II project, and Department of Biotechnology (DBT), through an Indo-Russia project (DBT/IC-2/Indo-Russia/2017-19/02). P.R. Solanki thanks DST Purse, Jawaharlal Nehru University, New Delhi, India for providing publication charges for the article.
Author Contributions
§ L.B.V.S.G. and T.K.D. contributed equally.
The authors declare no competing financial interest.
References
- Kołodziejczak-Radzimska A.; Jesionowski T. Zinc oxide—from synthesis to application: a review. Materials 2014, 7, 2833–2881. 10.3390/ma7042833. [DOI] [PMC free article] [PubMed] [Google Scholar]
- Wang Z. L. Zinc oxide nanostructures: growth, properties and applications. J. Phys.: Condens. Matter 2004, 16, R829. 10.1088/0953-8984/16/25/R01. [DOI] [Google Scholar]
- Zhang Y.; Ram M. K.; Stefanakos E. K.; Goswami D. Y. Synthesis, characterization, and applications of ZnO nanowires. J. Nanomater. 2012, 2012, 624520 10.1155/2012/624520. [DOI] [Google Scholar]
- Mahmud M. A.; Elumalai N. K.; Upama M. B.; Wang D.; Chan K. H.; Wright M.; Xu C.; Haque F.; Uddin A. Low temperature processed ZnO thin film as electron transport layer for efficient perovskite solar cells. Sol. Energy Mater. Sol. Cells 2017, 159, 251–264. 10.1016/j.solmat.2016.09.014. [DOI] [Google Scholar]
- Makino T.; Segawa Y.; Tsukazaki A.; Ohtomo A.; Kawasaki M. Electron transport in ZnO thin films. Appl. Phys. Lett. 2005, 87, 022101 10.1063/1.1991994. [DOI] [Google Scholar]
- Ferreira S. R.; Lu P.; Lee Y.-J.; Davis R. J.; Hsu J. W. Effect of zinc oxide electron transport layers on performance and shelf life of organic bulk heterojunction devices. J. Phys. Chem. C 2011, 115, 13471–13475. 10.1021/jp203539k. [DOI] [Google Scholar]
- Segets D.; Gradl J.; Taylor R. K.; Vassilev V.; Peukert W. Analysis of optical absorbance spectra for the determination of ZnO nanoparticle size distribution, solubility, and surface energy. ACS Nano 2009, 3, 1703–1710. 10.1021/nn900223b. [DOI] [PubMed] [Google Scholar]
- Wang Z. L. Splendid one-dimensional nanostructures of zinc oxide: a new nanomaterial family for nanotechnology. ACS Nano 2008, 2, 1987–1992. 10.1021/nn800631r. [DOI] [PubMed] [Google Scholar]
- Chaari M.; Matoussi A. Electrical conduction and dielectric studies of ZnO pellets. Phys. B 2012, 407, 3441–3447. 10.1016/j.physb.2012.04.056. [DOI] [Google Scholar]
- Özgür Ü.; Alivov Y. I.; Liu C.; Teke A.; Reshchikov M.; Doğan S.; Avrutin V.; Cho S. J.; Morkoç H. A comprehensive review of ZnO materials and devices. J. Appl. Phys. 2005, 98, 11. 10.1063/1.1992666. [DOI] [Google Scholar]
- Vijayan T. A.; Chandramohan R.; Valanarasu S.; Thirumalai J.; Venkateswaran S.; Mahalingam T.; Srikumar S. R. Optimization of growth conditions of ZnO nano thin films by chemical double dip technique. Sci. Technol. Adv. Mater. 2008, 9, 035007 10.1088/1468-6996/9/3/035007. [DOI] [PMC free article] [PubMed] [Google Scholar]
- Khorramshahi V.; Karamdel J.; Yousefi R. High acetic acid sensing performance of Mg-doped ZnO/rGO nanocomposites. Ceram. Int. 2019, 45, 7034–7043. 10.1016/j.ceramint.2018.12.205. [DOI] [Google Scholar]
- Mahmoudian M. R.; Basirun W. J.; Woi P. M.; Yousefi R.; Alias Y. l-Glutamine-assisted synthesis of ZnO oatmeal-like/silver composites as an electrochemical sensor for Pb 2+ detection. Anal. Bioanal. Chem. 2019, 411, 517–526. 10.1007/s00216-018-1476-x. [DOI] [PubMed] [Google Scholar]
- Sáaedi A.; Yousefi R. Improvement of gas-sensing performance of ZnO nanorods by group-I elements doping. J. Appl. Phys. 2017, 122, 224505 10.1063/1.5009249. [DOI] [Google Scholar]
- Yousefi R.; Beheshtian J.; Seyed-Talebi S. M.; Azimi H.; Jamali-Sheini F. Experimental and theoretical study of enhanced photocatalytic activity of Mg-doped ZnO NPs and ZnO/rGO nanocomposites. Chem. - Asian J. 2018, 13, 194–203. 10.1002/asia.201701423. [DOI] [PubMed] [Google Scholar]
- Lee J.-H.; Lee W.-J.; Lee S.-H.; Kim S. M.; Kim S.; Jang H. M. Atomic-scale origin of piezoelectricity in wurtzite ZnO. Phys. Chem. Chem. Phys. 2015, 17, 7857–7863. 10.1039/C4CP06094F. [DOI] [PubMed] [Google Scholar]
- Reshchikov M.; Morkoc H.; Nemeth B.; Nause J.; Xie J.; Hertog B.; Osinsky A. Luminescence properties of defects in ZnO. Phys. B: Condensed Matter 2007, 401–402, 358–361. 10.1016/j.physb.2007.08.187. [DOI] [Google Scholar]
- Zhou X.; Xiao X.; Xu J.; Cai G.; Ren F.; Jiang C. Mechanism of the enhancement and quenching of ZnO photoluminescence by ZnO-Ag coupling. Europhys. Lett. 2011, 93, 57009. 10.1209/0295-5075/93/57009. [DOI] [Google Scholar]
- Reynolds D.; Look D. C.; Jogai B.; Hoelscher J.; Sherriff R.; Harris M.; Callahan M. Time-resolved photoluminescence lifetime measurements of the Γ 5 and Γ 6 free excitons in ZnO. J. Appl. Phys. 2000, 88, 2152–2153. 10.1063/1.1305546. [DOI] [Google Scholar]
- World Health Organization The World Health Report 2002: Reducing Risks, Promoting Healthy Life; World Health Organization, 2002. [Google Scholar]
- Nicolopoulou-Stamati P.; Maipas S.; Kotampasi C.; Stamatis P.; Hens L. Chemical pesticides and human health: the urgent need for a new concept in agriculture. Front. Public Health 2016, 4, 148. 10.3389/fpubh.2016.00148. [DOI] [PMC free article] [PubMed] [Google Scholar]
- Rosenthal D. Theoretical limitations of gas chromatographic/mass spectrometric identification of multicomponent mixtures. Anal. Chem. 1982, 54, 63–66. 10.1021/ac00238a020. [DOI] [Google Scholar]
- Dhiman T. K.; Singh S. Enhanced Catalytic and Photocatalytic Degradation of Organic Pollutant Rhodamine-B by LaMnO3 Nanoparticles Synthesized by Non-Aqueous Sol-Gel Route. Phys. Status Solidi A 2019, 216, 1900012 10.1002/pssa.201900012. [DOI] [Google Scholar]
- Tereshchenko A.; Bechelany M.; Viter R.; Khranovskyy V.; Smyntyna V.; Starodub N.; Yakimova R. Optical biosensors based on ZnO nanostructures: advantages and perspectives. A review. Sens. Actuators, B 2016, 229, 664–677. 10.1016/j.snb.2016.01.099. [DOI] [Google Scholar]
- Cunningham B. T.; Laing L. G. Advantages and application of label-free detection assays in drug screening. Expert Opin. Drug Discovery 2008, 3, 891–901. 10.1517/17460441.3.8.891. [DOI] [PubMed] [Google Scholar]
- Zanchetta G.; Lanfranco R.; Giavazzi F.; Bellini T.; Buscaglia M. Emerging applications of label-free optical biosensors. Nanophotonics 2017, 6, 627–645. 10.1515/nanoph-2016-0158. [DOI] [Google Scholar]
- Lakowicz J. R.Principles of Fluorescence Spectroscopy; Springer Science & Business Media, 2013. [Google Scholar]
- Council N. R.Drinking Water and Health; The National Academies Press: Washington, DC, 1983; Vol. 5, p 157. [Google Scholar]
- Chow C. F.; Ho K. Y. F.; Gong C. B. Synthesis of a new bimetallic Re (I)–NCS–Pt (II) complex as chemodosimetric ensemble for the selective detection of mercapto-containing pesticides. Anal. Chem. 2015, 87, 6112–6118. 10.1021/acs.analchem.5b00684. [DOI] [PubMed] [Google Scholar]
- Azab H. A.; Duerkop A.; Mogahed E.; Awad F.; El Aal R. A.; Kamel R. M. Fluorescence and electrochemical sensing of pesticides methomyl, aldicarb and prometryne by the luminescent europium-3-carboxycoumarin probe. J. Fluoresc. 2012, 22, 659–676. 10.1007/s10895-011-1002-4. [DOI] [PubMed] [Google Scholar]
- Wang X.; Hou T.; Dong S.; Liu X.; Li F. Fluorescence biosensing strategy based on mercury ion-mediated DNA conformational switch and nicking enzyme-assisted cycling amplification for highly sensitive detection of carbamate pesticide. Biosens. Bioelectron. 2016, 77, 644–649. 10.1016/j.bios.2015.10.034. [DOI] [PubMed] [Google Scholar]
- Fox M. A.; Chanon M.. Photoinduced Electron Transfer: Photoinduced Electron Transfer Reactions, Inorganic Substrates and Applications; Elsevier Science Limited, 1988. [Google Scholar]
- Davidson R. S. The chemistry of excited complexes: a survey of reactions. Adv. Phys. Org. Chem. 1983, 19, 1–130. 10.1016/S0065-3160(08)60222-1. [DOI] [Google Scholar]
- Doose S.; Neuweiler H.; Sauer M. Fluorescence quenching by photoinduced electron transfer: a reporter for conformational dynamics of macromolecules. ChemPhysChem 2009, 10, 1389–1398. 10.1002/cphc.200900238. [DOI] [PubMed] [Google Scholar]
- Zhao X.; Zheng B.; Li C.; Gu H. Acetate-derived ZnO ultrafine particles synthesized by spray pyrolysis. Powder Technol. 1998, 100, 20–23. 10.1016/S0032-5910(98)00047-3. [DOI] [Google Scholar]
- Bagabas A.; Alshammari A.; Aboud M. F.; Kosslick H. Room-temperature synthesis of zinc oxide nanoparticles in different media and their application in cyanide photodegradation. Nanoscale Res. Lett. 2013, 8, 516 10.1186/1556-276X-8-516. [DOI] [PMC free article] [PubMed] [Google Scholar]
- Faisal M.; Khan S. B.; Rahman M. M.; Jamal A.; Abdullah M. Fabrication of ZnO nanoparticles based sensitive methanol sensor and efficient photocatalyst. Appl. Surf. Sci. 2012, 258, 7515–7522. 10.1016/j.apsusc.2012.04.075. [DOI] [Google Scholar]
- Singh I.; Kumar R.; Birajdar B. I. Zirconium doped TiO2 nano-powder via halide free non-aqueous solvent controlled sol-gel route. J. Environ. Chem. Eng. 2017, 5, 2955–2963. 10.1016/j.jece.2017.05.046. [DOI] [Google Scholar]
- Taziwa R.; Meyer E.; Katwire D.; Ntozakhe L. Influence of Carbon Modification on the Morphological, Structural, and Optical Properties of Zinc Oxide Nanoparticles Synthesized by Pneumatic Spray Pyrolysis Technique. J. Nanomater. 2017, 2017, 11. 10.1155/2017/9095301. [DOI] [Google Scholar]
- Korepanov V. I.; Chan S. Y.; Hsu H. C.; Hamaguchi H. O. Phonon confinement and size effect in Raman spectra of ZnO nanoparticles. Heliyon 2019, 5, e01222 10.1016/j.heliyon.2019.e01222. [DOI] [PMC free article] [PubMed] [Google Scholar]
- Jaramillo A.; Baez-Cruz R.; Montoya L.; Medinam C.; Pérez-Tijerina E.; Salazar F.; Rojas D.; Melendrez M. Estimation of the surface interaction mechanism of ZnO nanoparticles modified with organosilane groups by Raman spectroscopy. Ceram. Int. 2017, 43, 11838–11847. 10.1016/j.ceramint.2017.06.027. [DOI] [Google Scholar]
- Yoshikawa M.; Inoue K.; Nakagawa T.; Ishida H.; Hasuike N.; Harima H. Characterization of ZnO nanoparticles by resonant Raman scattering and cathodoluminescence spectroscopies. Appl. Phys. Lett. 2008, 92, 113115 10.1063/1.2901159. [DOI] [Google Scholar]
- Gültekin D.; Akbulut H. Raman studies of ZnO products synthesized by solution based methods. Acta Phys. Pol., A 2016, 129, 803–805. 10.12693/APhysPolA.129.803. [DOI] [Google Scholar]
- Pelicano C. M.; Magdaluyo E.; Ishizumi A. Temperature Dependence of Structural and Optical Properties of ZnO Nanoparticles Formed by Simple Precipitation Method. MATEC Web Conf. 2016, 43, 02001 10.1051/matecconf/20164302001. [DOI] [Google Scholar]
- Talam S.; Karumuri S. R.; Gunnam N. Synthesis, characterization, and spectroscopic properties of ZnO nanoparticles. ISRN Nanotechnol. 2012, 2012, 372505 10.5402/2012/372505. [DOI] [Google Scholar]
- Bera D.; Qian L.; Tseng T. K.; Holloway P. H. Quantum dots and their multimodal applications: a review. Materials 2010, 3, 2260–2345. 10.3390/ma3042260. [DOI] [Google Scholar]
- Lin H.; Huang C.; Li W.; Ni C.; Shah S. I.; Tseng Y. H. Size dependency of nanocrystalline TiO2 on its optical property and photocatalytic reactivity exemplified by 2-chlorophenol. Appl. Catal., B 2006, 68, 1–11. 10.1016/j.apcatb.2006.07.018. [DOI] [Google Scholar]
- Alwan R. M.; Kadhim Q. A.; Sahan K. M.; Ali R. A.; Mahdi R. J.; Kassim N. A.; Jassim A. N. Synthesis of zinc oxide nanoparticles via sol–gel route and their characterization. Nanosci. Nanotechnol. 2015, 5, 1–6. 10.5923/j.nn.20150501.01. [DOI] [Google Scholar]
- Zak A. K.; Razali R.; Majid W. A.; Darroudi M. Synthesis and characterization of a narrow size distribution of zinc oxide nanoparticles. Int. J. Nanomed. 2011, 6, 1399. [DOI] [PMC free article] [PubMed] [Google Scholar]
- Dixit V.; Tewari J. C.; Obendorf S. K. Identification of degraded products of aldicarb due to the catalytic behavior of titanium dioxide/polyacrylonitrile nanofiber. J. Chromatogr. A 2009, 1216, 6394–6399. 10.1016/j.chroma.2009.07.031. [DOI] [PubMed] [Google Scholar]
- Labiadh H.; Lahbib K.; Hidouri S.; Touil S.; Chaabane T. B. Insight of ZnS nanoparticles contribution in different biological uses. Asian Pac. J. Trop. Med. 2016, 9, 757–762. 10.1016/j.apjtm.2016.06.008. [DOI] [PubMed] [Google Scholar]
- Arifin Z.; Soeparman S.; Widhiyanuriyawan D.; Sutanto B. In Suyitno In Performance Enhancement of Dye-sensitized Solar Cells (DSSCs) Using a Natural Sensitizer, AIP Conference Proceedings; AIP Publishing, 2017; 030123.
- Narayan M. R. Dye sensitized solar cells based on natural photosensitizers. Renewable Sustainable Energy Rev. 2012, 16, 208–215. 10.1016/j.rser.2011.07.148. [DOI] [Google Scholar]
- Dhafina W. A.; Salleh H.; Daud M. Z. In The application of sensitizers from red frangipani flowers and star gooseberry leaves in dye-sensitized solar cells. J. Phys.: Conf. Ser. 2018, 1027, 012016 10.1088/1742-6596/1027/1/012016. [DOI] [Google Scholar]
- Zu F.; Yan F.; Bai Z.; Xu J.; Wang Y.; Huang Y.; Zhou X. The quenching of the fluorescence of carbon dots: a review on mechanisms and applications. Microchim. Acta 2017, 184, 1899–1914. 10.1007/s00604-017-2318-9. [DOI] [Google Scholar]
- Yang Q.; Zhou X.; Nukui T.; Saeki Y.; Izumi S.; Tackeuchi A.; Tatsuoka H.; Liang S. Time-resolved ultraviolet photoluminescence of ZnO/ZnGa2O4 composite layer. AIP Adv. 2014, 4, 027101 10.1063/1.4864750. [DOI] [Google Scholar]
- Pearson R. G. Hard and soft acids and bases. J. Am. Chem. Soc. 1963, 85, 3533–3539. 10.1021/ja00905a001. [DOI] [Google Scholar]
- Sahoo D.; Mandal A.; Mitra T.; Chakraborty K.; Bardhan M.; Dasgupta A. K. Nanosensing of pesticides by zinc oxide quantum dot: an optical and electrochemical approach for the detection of pesticides in water. J. Agric. Food Chem. 2018, 66, 414–423. 10.1021/acs.jafc.7b04188. [DOI] [PubMed] [Google Scholar]