Fig. 1.
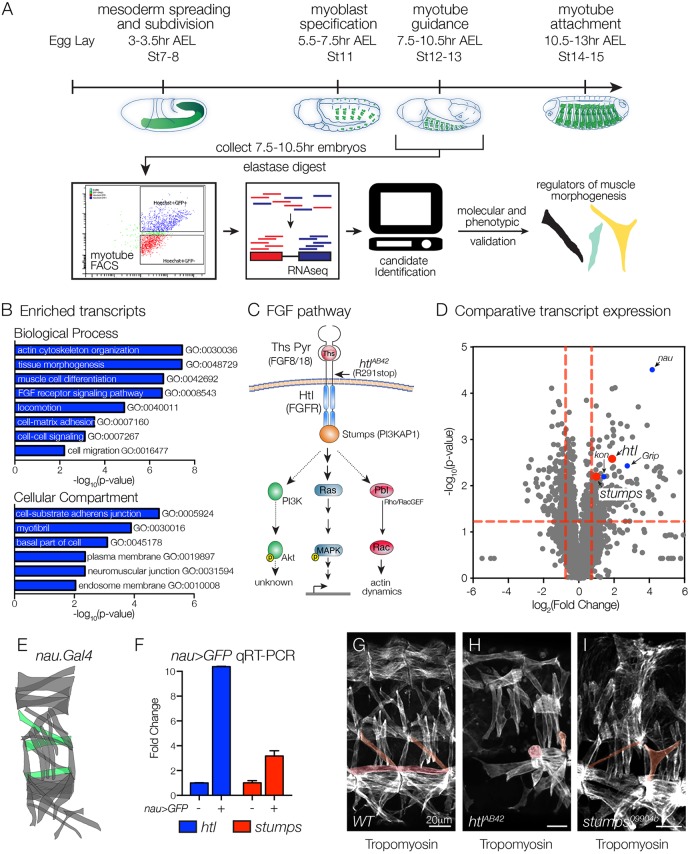
FGF signaling components are enriched in nascent myotubes. (A) Experimental design. Nascent myotubes that expressed rp298>eGFP were FACS sorted and deep sequenced (FACS-seq). Candidate genes were then tested in vivo to identify regulators of myotube guidance. (B) GO analysis of transcripts enriched in GFP+ myotubes compared with GFP–cells. (C) Schematic of the FGF signaling pathway. Vertebrate orthologs are in parentheses. Indirect or putative interactions are shown with dotted lines. (D) Volcano plot of transcripts identified in nascent myotubes. Each data point represents the average values for a single transcript from three biological replicates. Red dashed lines indicate P=0.05. Points above the horizontal line and to the right of the vertical lines are significantly enriched with P<0.05. Red dots indicate FGF signaling components, blue dots indicate known regulators of myogenesis and myotube guidance. (E,F) Molecular validation of FACS-seq results. E shows a diagram of the body wall muscles in a single embryonic segment. nau.Gal4 expressing muscles are shown in green. Nascent myotubes that expressed nau>eGFP were FACS sorted and transcript expression was assayed by qRT-PCR (F). htl and stumps transcripts were significantly enriched in GFP+ myotubes compared with GFP– cells. (G-I) Stage 16 embryos labeled for Tropomyosin to visualize the body wall musculature. htlAB42 (H) and stumps09904b (I) embryos showed multiple body wall muscle defects compared with WT (G). Rounded myotubes and myotubes with attachment site defects are pseudocolored. Embryos are oriented with anterior to the left and dorsal to the top.

