Abstract
Background
Long‐term outcomes after percutaneous coronary intervention (PCI) relate in part to residual ischemia in the treated vessel, as reflected by post‐PCI fractional flow reserve (FFR). The strategy of FFR after PCI and treatment of residual ischemia—known as functionally optimized coronary intervention (FCI)—may be feasible and capable of improving outcomes.
Methods and Results
Feasibility and results of FCI using an optical‐sensor pressure wire were prospectively evaluated in an all‐comer population with 50% to 99% lesions and ischemic FFR (≤0.80; ClinicalTrials.gov identifier NCT03227588). FCI was attempted in 250 vessels in 226 consecutive patients. The PCI success rate was 99.6% (249/250 vessels). FCI technical success—that is, FFR before and after PCI and PCI itself using the FFR wire—was 92% (230/250 vessels). Incidence of residual ischemia in the treated vessel was 36.5%. Approximately a third of these vessels (34.5%, n=29) were considered appropriate for further intervention, with FFR increasing from 0.71±0.07 to 0.81±0.06 (P<0.001). Pressure wire pullback showed FFR ≤0.8 at distal stent edge was 7.9% and 0.7% proximal to the stent. FFR increase across the stent was larger in the ischemic than in the nonischemic group (0.06 [interquartile range: 0.04–0.08] versus 0.03 [interquartile range: 0.01–0.05]; P<0.0001) compatible with stent underexpansion as a contributor to residual ischemia.
Conclusions
FCI is a feasible and safe clinical strategy that identifies residual ischemia in a large proportion of patients undergoing angiographically successful PCI. Further intervention can improve ischemia. The impact of this strategy on long‐term outcomes needs further study.
Keywords: coronary revascularization, coronary stenting, fractional flow reserve, functional coronary intervention, ischemia, percutaneous coronary intervention
Subject Categories: Percutaneous Coronary Intervention, Revascularization, Catheter-Based Coronary and Valvular Interventions
Clinical Perspective
What Is New?
With the use of an optical pressure wire system, performing a coronary intervention across the entire lesion severity spectrum with physiologic testing before and after the procedure (ie, functional coronary intervention) is feasible using a single pressure wire in >90% of cases.
Despite angiographic optimization, postintervention fractional flow reserve shows an ischemic response, as defined by fractional flow reserve ≤0.8 in more than a third (36.5%) of treated vessels, demonstrating the relative inadequacy of determining functionally successful results using angiographic interpretation alone.
In vessels found to have low fractional flow reserve, approximately a third (34.5%) were found to be amenable to further intervention with a subsequent increase in fractional flow reserve to nonischemic values (0.71+0.07 to 0.81+0.06; P<0.001), supporting utilization of invasive functional testing after successful angiographic intervention to ensure elimination of ischemia in the myocardium of the treated vessel.
What Are the Clinical Implications?
More than a third of lesions show an ischemic response after angiographic optimization, and the functional improvement of a third of these lesions with further intervention strongly points to inadequacies of current interventional technique. Consideration of imaging to complement functional testing is suggested from these findings.
A prospective study of long‐term outcomes comparing angiographic optimization alone versus use of post–percutaneous coronary intervention functional testing and subsequent intervention is recommended based on the current study.
Introduction
Elimination of ischemia is acknowledged as the primary mechanism by which percutaneous revascularization improves symptoms and clinical outcomes. There is a general assumption that angiographic optimization after successful percutaneous coronary intervention (PCI) eliminates ischemia in the subtended myocardium and that, should ischemia persist after intervention, additional interventions would be futile in eliminating ischemia, given the preexistent plaque burden.
These assumptions have been challenged.1, 2, 3 Several studies have demonstrated that using physiologic assessment, residual ischemia persists in a significant percentage of patients after angiographically successful PCI.2, 3, 4, 5, 6, 7 Importantly, several studies have demonstrated that post‐PCI fractional flow reserve (FFR) value is related to long‐term adverse outcomes.3, 4, 5, 6, 8, 9 Furthermore, it has been shown that in a sizeable percentage of these vessels, residual ischemia can be decreased or eliminated with further intervention.1, 2 Based on these observations, it is reasonable to consider a PCI algorithm that evaluates interventional success functionally as well as angiographically. In the case of persistent ischemia after angiographic optimization, pressure pullback may identify a vessel region requiring further intervention to improve functional outcome. To test this hypothesis, a prospective registry was developed to evaluate functional assessment with FFR after angiographic optimization for lesions of all severity and to perform further intervention when appropriate if the FFR value was deemed to be unacceptably low. The feasibility and procedural results of this proposed practice paradigm, dubbed functionally optimized coronary intervention (FCI), are presented.
Methods
Patient Population
This prospective all‐comer registry was approved by the institutional review board of the Central Arkansas Veterans Healthcare System (Little Rock, AR) and registered with ClinicalTrials.gov (identifier NCT03227588). Consecutive adult patients (aged >18 years) with stable ischemic heart disease and stabilized acute coronary syndrome, as described in the FAME (Fractional Flow Reserve Versus Angiography in Multivessel Evaluation) trial,10 were included. Patients with total occlusions, saphenous vein graft lesions, hemodynamic instability, and ST‐segment–elevation myocardial infarction were excluded. After angiographically optimized PCI, FFR was repeated. Further intervention was performed at the operator's discretion based on the post‐PCI FFR value and pullback and, in some cases, intravascular imaging (Figure 1).
Figure 1.
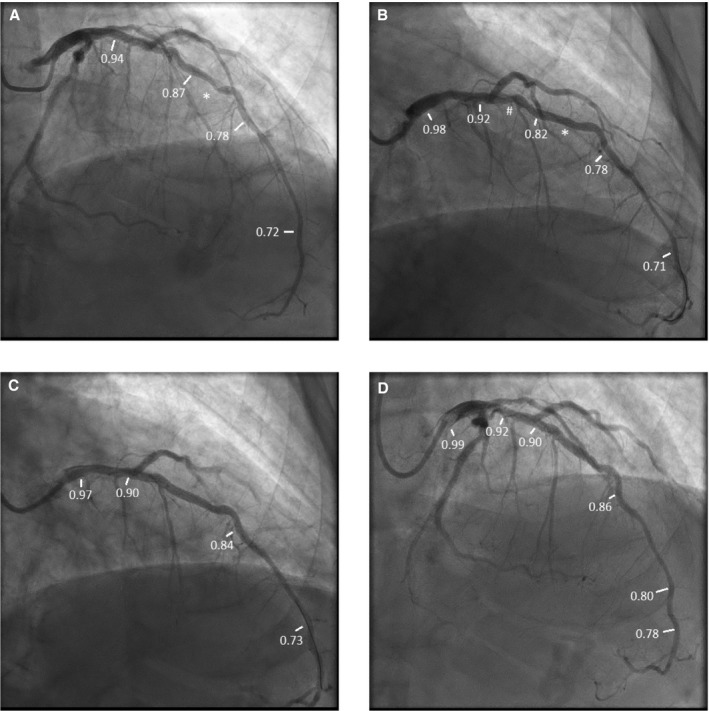
Patient example of the functionally optimized coronary intervention strategy. A, Angiogram before percutaneous coronary intervention (PCI). Fractional flow reserve (FFR) in the distal vessel was 0.72. On pullback, FFR distal to lesion (*) was 0.78, with step up to 0.87 across the lesion, then gradually to 0.94 in the proximal left anterior descending artery (LAD). B, Post‐PCI angiogram. FFR in the distal vessel after stent deployment across the lesion, denoted by (*). FFR in the distal vessel was 0.71. On pullback, FFR distal to stent was 0.78, proximal to stent was 0.82 (TSG 0.04) with step‐up across a less apparent lesion (#) to 0.92, then gradually to 0.98 in proximal LAD. C, Angiogram after stenting, less apparent lesion denoted by (#) and dilatation with noncompliant balloon of first stent (*). FFR after these interventions in the distal vessel was 0.73. On pullback, FFR distal to distal stent was 0.84, proximal to proximal stent 0.90 (TSG: 0.06), and then gradually rose to 0.97 in the proximal LAD. D, Intravascular ultrasound showed the distal stent was adequately expanded (90% of the target minimal luminal area [MLA]) but the proximal stent was underexpanded (74% of target MLA). Postdilation with a noncompliant balloon increased stent MLA to 86% of predicted stent area. FFR distally after postdilation was 0.78. On pullback, FFR in the distal vessel was 0.80, distal to distal stent was 0.86, proximal to proximal stent was 0.90 with a TSG of 0.04, and FFR was0.92 in the proximal LAD and 0.99 in the left main and guide. Thus, final drift was 0.01.
Measurement of FFR
FFR was performed using the Opsens fiber‐optic pressure wire system. After aortic pressure equalization, the wire was advanced to the distal artery with the pressure transducer at a site with a diameter large enough to accept a currently available stent (ie, ≥2 mm). After intracoronary nitroglycerin administration, baseline pressure gradient (ratio of resting pressure distal to an obstruction to arterial pressure) and FFR were measured with intravenous adenosine (40 mg/kg per minute) or with intracoronary adenosine (100–200 µg) when there was concern about intravenous adenosine use. A pullback was recommended but not mandatory before PCI (Figure 1A). After obtaining a satisfactory angiographic result, the ratio of resting pressure distal to an obstruction to arterial pressure and FFR were repeated. Manual pullback was performed in all patients to localize any site of abrupt pressure increase compatible with a residual significant stenosis (Figure 1B) or trans‐stent gradient (TSG; Figure 1C). Pullback was performed by withdrawing the wire a short distance (typically 3–5 mm), allowing 5–10 cardiac cycles to occur, and noting FFR value. This process was repeated to include the entire vessel and at the aorta. A visually appreciated change in the angle of the FFR pullback curve between pullback sites was considered by an “abrupt” change (as opposed to an unchanged slope through the pullback). It should be noted that this determination was based on the operator's impression without a defined threshold for the change in degree of angle or the increase in FFR across a site. Further intervention was performed when there was an abrupt change in the FFR (compatible with another lesion) or significant TSG (compatible with undersized or underexpanded stent). Imaging guidance was used in some cases, in conjunction with angiography and FFR. Following subsequent intervention, FFR was repeated and a pullback performed to the guide the catheter to determine the degree of “drift” (Figure 1D). If drift was ≥0.04, pressures were re‐equalized, the wire was passed to the same distal site as the initial pullback, and FFR with pullback was repeated.
After the first few months of enrollment, the pullback protocol was enhanced to record FFR distal and proximal to the stent; in the distal, mid, and very proximal vessel; and in the catheter tip itself. In this subgroup of vessels (n=138), ischemia location relative to the stent was characterized.
Definitions and End Points
Angiographic interpretation utilized visual estimation, and severity was considered intermediate with 50% to 69% and severe with 70% to 99% diameter stenosis. Diffuse disease angiographically consisted of ≥30 mm of contiguous disease of any degree. Diffuse disease by pressure measurement showed gradual FFR increase during pullback. Sudden FFR step‐up was compatible with a focal lesion. Technically successful FCI was defined as performing pre‐ and post‐PCI FFR with the PCI procedure using only the FFR wire. TSG was defined as the FFR difference measured 2 mm proximal and distal to the stent.
Statistical Analysis
Categorical variables are reported as numbers and percentages and compared using the χ2 test. Continuous variables are reported as either mean±SD for normal distributions or median with interquartile range (IQR; 25th–75th percentiles of median) for skewed variables. The D'Agostino–Pearson test was used to test the normality of the data. When normally distributed, the unpaired Student t test for independent samples, paired Student t test for paired samples, and repeated measures analysis of covariance for >2 pairs of samples were used. The Mann–Whitney test for independent samples, Wilcoxon test for paired samples, and Freidman test for >2 paired samples of continuous variables were used when distribution was not normal. Univariate and multivariate logistic regression analyses were used to identify independent predictors of ischemic FFR immediately after PCI (after angiographically optimal results) and TSG >0.04. Variables with P<0.10 in the univariate model and some clinically relevant variables were selected and included in the multivariate logistic regression model. The number of covariates entered into the model was restricted to maintain approximately ≥10 outcomes per degree of freedom.11 Because the population was mostly white men, sex and race were not included as covariates. The level of statistical significance was set at 0.05, and a 2‐sided probability value was used for analyses. All statistical calculations were performed using MedCalc Statistical Software versions 16.4.3 and 18.11.3.
The data that support the findings of this study are available from the corresponding author on reasonable request.
Results
Patient and Vessel Characteristics
This study included the first 250 treated vessels in 223 consecutive patients (Figure 2). FCI occurred in 230 vessels (92%); these patients underwent successful coronary intervention using the FFR wire during the entire intervention and having adequate pre‐ and post‐PCI FFR with functional optimization if appropriate (see below under Ischemia Relief After PCI Based on Angiography and FFR). Six vessels required a different guide wire to cross the lesion, and 1 lesion could not be crossed with any guide wire. Thirteen vessels had pre‐PCI but not post‐PCI FFR. Consequently, the overall success rate of pressure wire crossing that met entry criteria was 97% (243/250 vessels) and the PCI success rate with any guide wire was 99.6% (249/250 vessels).
Figure 2.
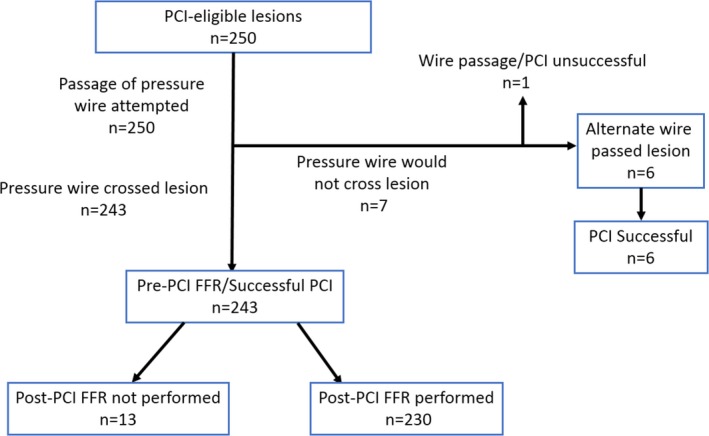
Outcomes of the 250 vessels attempted using the functional optimized coronary intervention strategy. Of these, 230 had successful pre‐ and post–fractional flow reserve (FFR) and intervention using the FFR wire alone (92.5% success). PCI indicates percutaneous coronary intervention.
Clinical characteristics of the entire group and of patients with and without ischemia after PCI are shown in Table 1. There was high prevalence of coronary risk factors, with >90% of participants having hypertension and hyperlipidemia and more than a third having diabetes mellitus. Baseline characteristics were similar in the 2 groups except that patients with post‐PCI ischemia had a higher prevalence of previous myocardial infarction and PCI.
Table 1.
Clinical Characteristics of the Study Population
| Variable | Patients (n=206) | Nonischemic Post‐PCI FFR (>0.80; n=133) | Ischemic Post‐PCI FFR (≤0.80; n=73) | P Value |
|---|---|---|---|---|
| Age, y | 68.3±8.3 | 68.5±7.8 | 68.2±8.3 | 0.8 |
| Male sex | 207 (100) | 133 (100) | 73 (100) | … |
| White | 188 (92.6) | 120 (90.2) | 68 (93.1) | 0.75 |
| Diabetes mellitus | 84 (41.4) | 50 (37.6) | 34 (46.6) | 0.26 |
| Hypertension | 191 (94.1) | 121 (91) | 70 (95.9) | 0.42 |
| Hyperlipidemia | 185 (91.6) | 120 (90.2) | 65 (89) | 0.62 |
| Prior MI | 76 (36.9) | 41 (30.8) | 35 (47.9) | 0.06 |
| Prior PCI | 100 (49.3) | 52 (39.1) | 48 (65.8) | 0.0004 |
| Coronary artery bypass grafts | 39 (19.2) | 23 (17.3) | 16 (21.9) | 0.46 |
| Chronic kidney disease | 38 (19.2) | 24 (18) | 14 (19.2) | 0.99 |
| Congestive heart failure | 42 (20.7) | 24 (18) | 18 (24.7) | 0.30 |
| Atrial fibrillation | 24 (11.7) | 17 (12.8) | 7 (9.6) | 0.41 |
| Tobacco use | 131 (63.6) | 86 (64.7) | 45 (61.6) | 0.77 |
| Clinical syndrome | ||||
| Stable ischemic heart disease | ||||
| Stable angina | 74 (35.9) | 49 (36.8) | 25 (34.2) | 0.52 |
| Abnormal stress test | 47 (22.8) | 31 (23.3) | 16 (21.9) | |
| ACS | ||||
| Unstable angina | 61 (29.6) | 38 (28.6) | 23 (31.5) | |
| NSTEMI | 20 (9.7) | 11 (8.3) | 9 (12.3) | |
| Other | 4 (1.9) | 4 (3) | 0 (0) | |
| Medications | ||||
| Aspirin | 194 (98) | 123 (92.5) | 71 (97.3) | 0.58 |
| β‐Blocker | 140 (70.4) | 89 (66.9) | 51 (69.9) | 0.91 |
| Calcium channel blocker | 37 (18.1) | 23 (17.3) | 13 (17.8) | 0.94 |
| Statin | 163 (81.4) | 105 (78.9) | 57 (78.1) | 0.36 |
| Long‐acting nitrate | 81 (40.7) | 49 (36.8) | 32 (43.8) | 0.49 |
| Angiogram (≥50) | ||||
| 1 vessel | 67 (32.5) | 44 (33.1.1) | 23 (31.5) | 0.96 |
| 2 vessel | 74 (35.9) | 47 (35.3) | 27 (37.0) | |
| 3 vessel | 65 (31.6) | 42 (31.6) | 23 (31.5) | |
Data are shown as mean±SD or n (%). ACS indicates acute coronary syndrome; FFR, fractional flow reserve; MI, myocardial infarction; NSTEMI, non–ST‐segment–elevation myocardial infarction; PCI, percutaneous coronary intervention.
Angiographic and interventional results are shown in Table 2. This study primarily included patients with severe stenoses, with a median percentage diameter stenosis of 80% (IQR: 70–90%). Lesion diameter stenosis was 50% to 69% in 20 vessels (8.7%), 70% to 79% in 45 vessels (19.6%), 80% to 89% in 68 vessels (27.8%), and ≥90% in 101 vessels (43.9%; Figure 3). The relationships between lesion severity and ratio of resting pressure distal to an obstruction to arterial pressure and FFR are shown in Figure 4A and 4B.
Table 2.
Angiographic and Procedural Characteristics of Lesions
| Variable | Overall Lesions (n=230) | Nonischemic Post‐PCI FFR (>0.80; n=146) | Ischemic Post‐PCI FFR (≤0.80; n=84) | P Value |
|---|---|---|---|---|
| Diffuse disease | 66 (28.7) | 27 (18.5) | 39 (46.4) | 0.0001 |
| Moderate–severe calcification | 54 (23.5) | 28 (19.2) | 26 (31) | 0.04 |
| Moderate–severe tortuosity | 44 (19.1) | 24 (16.4) | 20 (23.8) | 0.17 |
| Lesion location | ||||
| LAD | 103 (44.8) | 41 (28.1) | 62 (73.8) | <0.0001 |
| LCX | 57 (24.8) | 49 (33.6) | 8 (9.5) | |
| RCA | 65 (28.3) | 51 (34.9) | 14 (16.7) | |
| Ramus | 3 (1.3) | 3 (2.1) | 0 (0) | |
| Left main | 2 (0.9) | 2 (1.4) | 0 (0) | |
| Angiographic severity | ||||
| Intermediate (50–69%) | 22 (9.6) | 10 (6.8) | 12 (14.3) | 0.07 |
| Severe (≥70%) | 208 (90.4) | 136 (93.2) | 72 (85.7) | |
| In‐stent restenosis | 34 (14.8) | 20 (13.7) | 14 (16.7) | 0.9 |
| Pre‐PCI stenosis | 80 (70–90) | 80 (70–90) | 80 (70–93) | 0.86 |
| Post‐PCI stenosis | 0 | 0 | 0 | 0.07 |
| Intervention | ||||
| Balloon angioplasty | 18 (7.8) | 9 (6.2) | 9 (10.7) | 0.46 |
| DES | 200 (87) | 129 (88.4) | 71 (84.5) | |
| BMS | 12 (5.2) | 8 (5.5) | 4 (4.8) | |
| Stent diameter, mm | 2.78±0.38 | 2.84±0.42 | 2.69±0.28 | 0.008 |
| Total stent length, mm | 24.1±20 | 23.5±12.9 | 25.3±15 | 0.36 |
| Pre‐PCI Pd/Pa | 0.86 (0.72–0.91) | 0.89 (0.76–0.93) | 0.79 (0.64–0.88) | <0.0001 |
| Post‐PCI Pd/Pa | 0.94 (0.89–97) | 0.96 (0.93–0.99) | 0.88 (0.86–0.91) | <0.0001 |
| Pre‐PCI FFR | 0.69 (0.54–0.75) | 0.72 (0.60–0.77) | 0.61 (0.43–0.71) | <0.0001 |
| Post‐PCI FFR | 0.85 (0.77–0.90) | 0.89 (0.86–0.92) | 0.75 (0.71–0.78) | <0.0001 |
| Final FFR[Link] | 0.86 (0.79–0.90) | 0.89 (0.86–0.92) | 0.77 (0.73–0.80) | <0.0001 |
| FFR drift | 0.01 (0–0.03) | 0.0 1 (0–0.03) | 0.02 (0.01–0.03) | 0.08 |
| TSG (n=138)a | 0.04 (0.02–0.06) | 0.03 (0.1–0.05) | 0.06 (00.4–0.08) | <0.0001 |
| TSG >0.04 | 58 (42) | 20 (25) | 38 (65.5) | <0.0001 |
Data are shown as mean±SD, n (%) or median (interquartile range). BMS indicates bare metal stent; DES, drug‐eluting stent; FFR, fractional flow reserve; LAD, left anterior descending; LCX, left circumflex; PCI, percutaneous coronary intervention; Pd/Pa, ratio of resting pressure distal to an obstruction to arterial pressure; RCA, right coronary artery; TSG, trans‐stent fractional flow reserve gradient.
FFR in vessel with low FFR that underwent further intervention (see Methods).
TSG equals the FFR proximal to the stent minus FFR distal to the stent.
Figure 3.
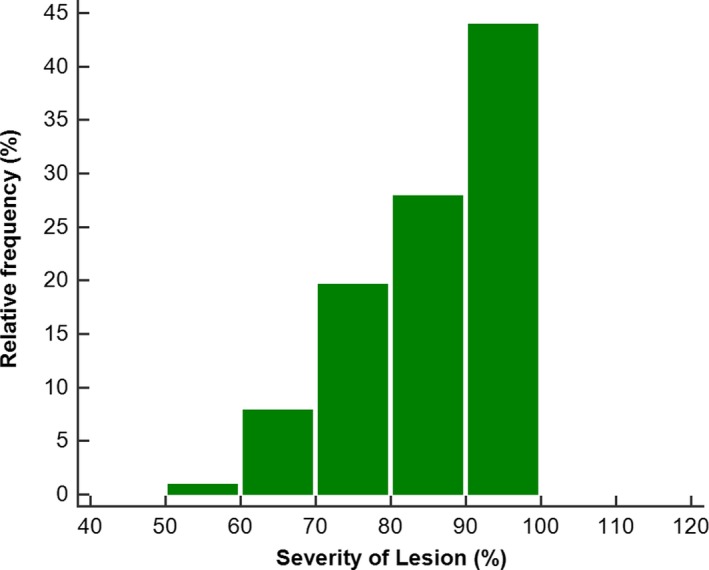
Distribution of lesion severity for 250 lesions.
Figure 4.
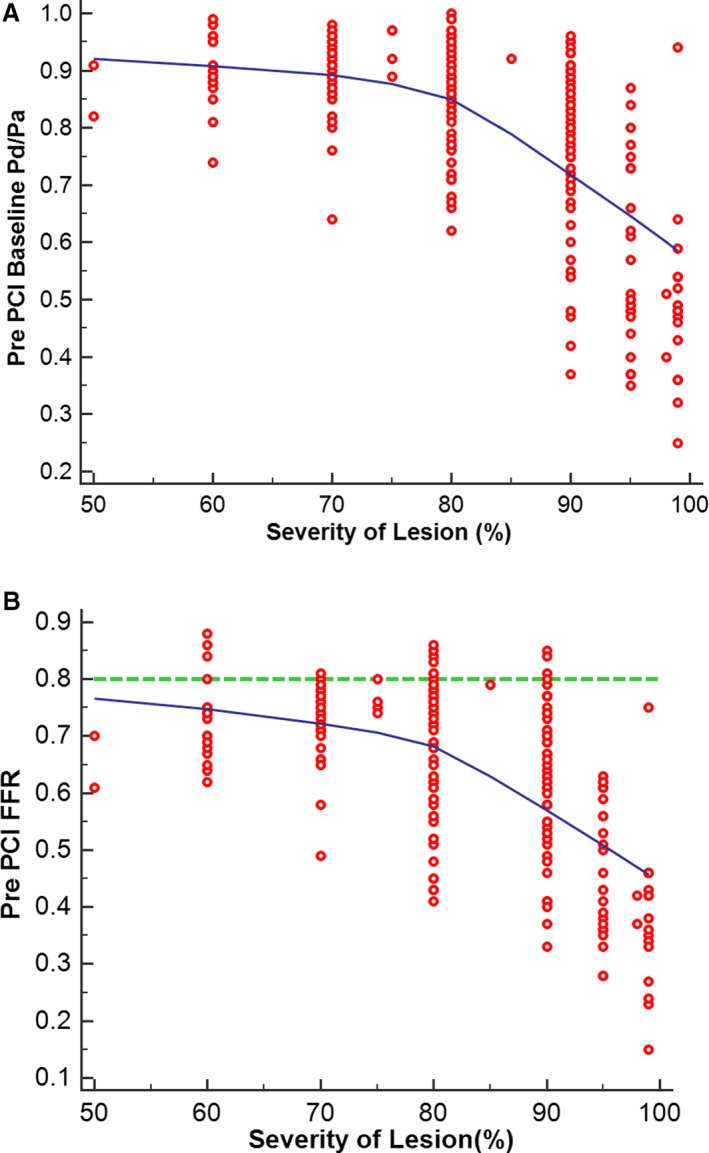
Relationship of resting pressure gradient across the lesion (Pd/Pa) (A) and fractional flow reserve (FFR) (B) to severity of lesion, as assessed by percentage diameter stenosis. PCI indicates percutaneous coronary intervention; Pd/Pa, ratio of resting pressure distal to an obstruction to arterial pressure.
Ischemia Relief After PCI Based on Angiography and FFR
PCI led to a decrease in diameter stenosis from 80% (IQR: 70–90) to 0% (IQR: 0–0; P<0.0001). After determination of satisfactory angiographic appearance, FFR showed effective ischemia reduction (pre‐PCI: 0.69 [IQR: 0.54–0.75]; post‐PCI: 0.85 [IQR: 0.77–90]; P<0.0001; Figure 5). Post‐PCI FFR was ≤0.80 in 84 vessels (36.5%), 0.81 to 0.85 in 37 vessels (16.1%), 0.86 to 0.90 in 60 vessels (26.1%), 0.91 to 0.95 in 38 vessels (16.5%), and >0.95 in 11 vessels (4.8%; Figure 6). Multivariate analysis showing the strongest associations with low FFR (≤0.80) after angiographic optimization were left anterior descending location (odds ratio [OR]: 8.71; 95% CI, 3.71–20.45), diffuse angiographic disease (OR: 2.53; 95% CI, 1.08–5.94), and prior PCI (OR: 2.7; 95% CI, 1.14–6.64; Table 3, Figure 7). In this group, a careful pullback identified 29 vessels (34.5%) with findings recommending further intervention. Subsequent procedures included noncompliant balloon dilatation of the implanted stent (n=4), implantation of another stent (n=15), both dilatation of the stented area and additional stenting (n=5), imaging followed by stent after dilatation (n=4), and imaging followed by further stenting (n=1). After subsequent intervention in this subgroup, FFR significantly increased (P<0.001) from 0.73 (IQR: 0.69–0.77; after PCI) to 0.80 (IQR: 0.77–0.85; Figure 8). Of these vessels, 48.2% were rendered nonischemic, with the final incidence of ischemic FFR in the entire cohort reduced to 30.4%. This FFR increase after subsequent intervention improved the final FFR of the entire group to 0.86` (IQR: 0.79–0.90). Final FFR was ≤0.80 in 69 vessels (30%), 0.81 to 0.85 in 41 vessels (17.8%), 0.86 to 0.90 in 63 vessels (27.4%), 0.91 to 0.95 in 41 vessels (17.8%), and >0.95 in 13 vessels (5.7%); FFR was not measured after further intervention in 3 vessels (1.3%). Patients with the lowest final FFR had the smallest change in FFR from before to after PCI (0.12; IQR: 0.04–0.30), and those with the highest final FFR showed the greatest increment (0.23; IQR: 0.13–0.37; Figure 9).
Figure 5.
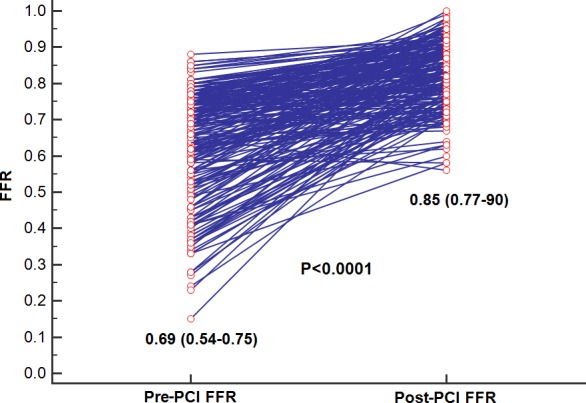
In the entire cohort, fractional flow reserve (FFR) significantly improved from 0.64±0.15 to 0.83±0.09 (P<0.0001). PCI indicates percutaneous coronary intervention.
Figure 6.
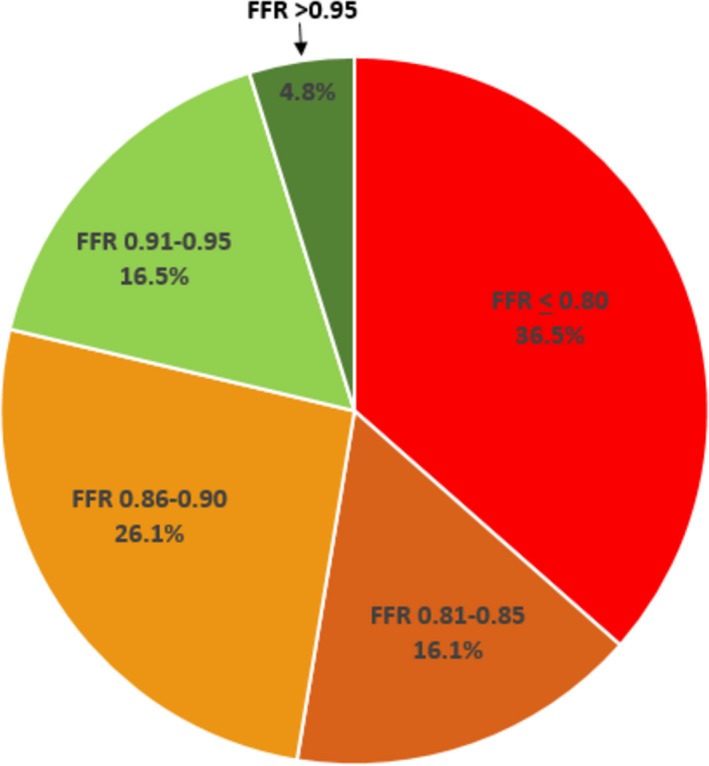
Fractional flow reserve (FFR) distribution after angiographic optimization. More than a third (36.5%) of vessels showed FFR in the ischemic range (≤0.80), and only 21.3% had FFR ≥0.90.
Table 3.
Logistic Regression for Predictors of Post‐PCI Ischemia
| Variable | OR (95% CI) | P Value |
|---|---|---|
| Prior MI | 1.1 (0.46–2.63) | 0.8228 |
| Prior PCI | 2.7 (1.14–6.64) | 0.025 |
| Diffuse disease | 2.53 (1.08–5.94) | 0.0323 |
| LAD | 8.71 (3.71–20.45) | <0.0001 |
| Severity of lesion, % | 0.93 (0.89–0.98) | 0.0025 |
| Moderate–severe calcification | 1.63 (0.64–4.13) | 0.3052 |
| Pre‐PCI FFR | 0.0002 (0.0000–0.0056) | <0.0001 |
| Stent diameter | 0.14 (0.04–0.52) | 0.0033 |
FFR indicates fractional flow reserve; LAD, left anterior descending; MI, myocardial infarction; OR, odds ratio; PCI, percutaneous coronary intervention.
Figure 7.
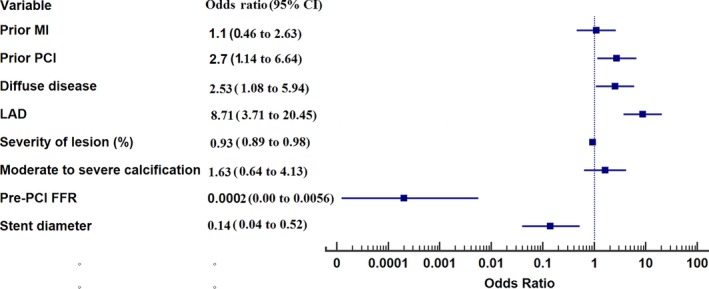
Forest plot of factors related to postintervention ischemia. FFR indicates fractional flow reserve; LAD, left anterior descending artery; MI, myocardial infarction; PCI, percutaneous coronary intervention.
Figure 8.
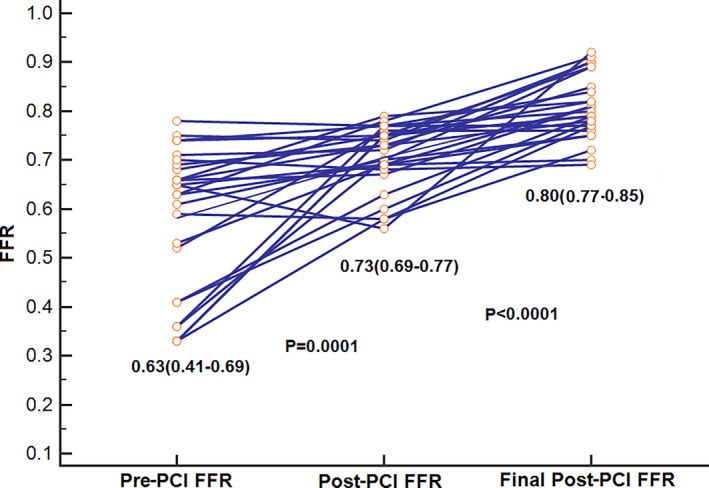
Vessels that underwent further intervention because of ischemic fractional flow reserve (FFR) after angiographic optimization showed an increase in FFR from 0.71±0.07 to 0.81±0.06 (P<0.0001). PCI indicates percutaneous coronary intervention.
Figure 9.
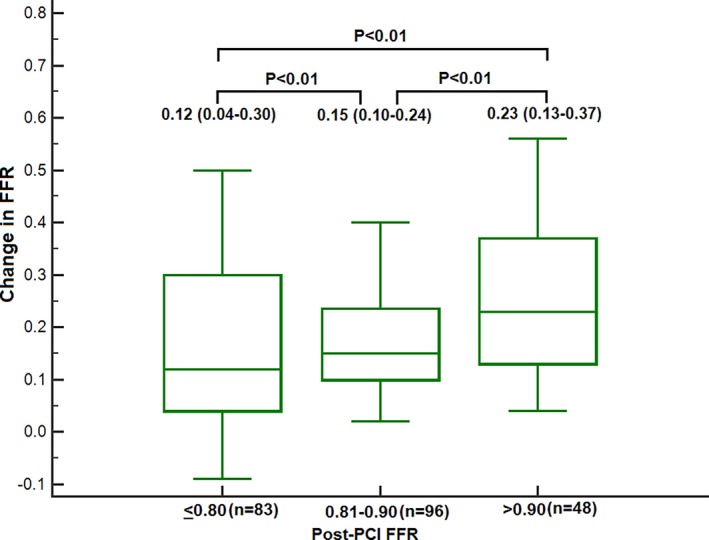
Patients with lowest final fractional flow reserve (FFR) had the smallest change in FFR from before to after intervention (0.12; interquartile range: 0.04–0.30), and the highest final FFR showed the greatest increment (0.23; interquartile range: 0.13–0.37).
Location of Ischemia Relative to Stented Segment
Of 138 vessels studied by systematic pullback after all interventions, ischemia incidence by FFR (≤0.80) was 33.8% with the transducer in the distal position, 7.9% with the transducer immediately distal to the stent, and 0.7% with the transducer immediately proximal to the stent (P<0.001 for all comparisons; Figure 10).
Figure 10.
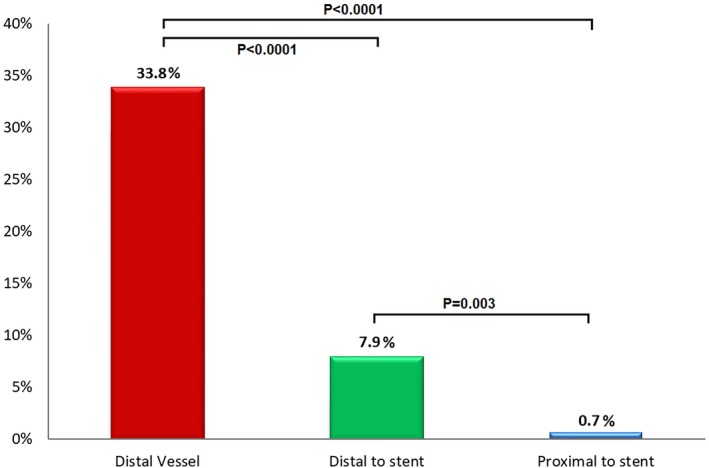
Incidence of ischemia (fractional flow reserve [FFR] ≤0.80) after percutaneous coronary intervention relative to pressure transducer location on pullback. With the pressure transducer in the distal vessel, a third of angiographically optimized vessels showed an ischemic FFR. The frequency dropped to <10% immediately distal to the stent site and <1% proximal to the stent. This finding emphasizes that relative stent underexpansion plays a substantial role in producing ischemia after angiographic optimization.
Median TSG was 0.04 (IQR: 0.02–0.06; 0.00 in 13 patients [9.4%], 0.01 to 0.04 in 67 [48.6%], 0.05 to 0.09 in 47 [34.1%], and >0.09 in 11 [7.9%]). TSG was higher in patients with ischemic than nonischemic FFR (0.06 [IQR: 00.4–0.08] versus 0.03 [IQR: 0.01–0.05]; P<0.0001; Table S1). Multivariate predictors of TSG >0.04 (the median TSG value) included left anterior descending location (OR: 6.02; 95% CI, 2.35–15.31; P=0.002), stent length (OR: 1.06; 95% CI, 1.02–1.10; P=0.004), moderate to severe calcification (OR: 3.56; 95% CI, 1.27–9.97; P=0.02), and moderate to severe tortuosity (OR: 4.81; 95% CI, 1.57–14.70; P=0.006; Tables 4 and 5, Figure 11, Figure S1). In a separate multivariate analysis in the subgroup with systematic pullback, TSG >0.04 was also a significant predictor of final post‐PCI ischemia (OR: 4.75; 95% CI, 1.6–4.13; P=0.005; Tables S1 and S2).
Table 4.
Comparison of Vessels With Trans‐Stent Increase in FFR on Pullback Above and Below Median
| Variable | Overall Lesions (n=138) | TSG ≤0.04 (n=80) | TSG >0.04 (n=58) | P Value |
|---|---|---|---|---|
| Diffuse disease | 50 (36.2) | 26 (32.5) | 24 (41.4) | 0.29 |
| Moderate–severe calcification | 32 (23.2) | 12 (15) | 20 (34.5) | 0.008 |
| Moderate–severe tortuosity | 24 (17.4) | 10 (12.5) | 14 (24.1) | 0.08 |
| Lesion location | ||||
| LAD | 62 (44.9) | 27 (33.8) | 35 (60.3) | |
| LCX | 36 (26.1) | 27 (33.8) | 9 (15.5) | |
| RCA | 38 (27.5) | 25 (31.3) | 13 (22.4) | |
| Ramus | 2 (1.4) | 1 (1.3) | 1 (1.7) | 0.01 |
| Angiographic severity | ||||
| Intermediate | 12 (11.6) | 8 (10) | 4 (6.9) | |
| Severe | 122 (88.4) | 70 (90) | 52 (89.7) | 0.54 |
| In‐stent restenosis | 19 (14.8) | 12 (15) | 7 (12.1) | 0.62 |
| Pre‐PCI stenosis | 80 (70–90) | 80 (70–90) | 80 (50–100) | 0.50 |
| Post‐PCI stenosis | 0 | 0 | 0 (0–50) | 0.44 |
| Intervention | ||||
| Balloon angioplasty | 8 (5.8) | 5 (6.3) | 3 (5.2) | |
| DES | 123 (9.17) | 70 (87.5) | 53 (91.4) | |
| BMS | 7 (5.8) | 5 (6.3) | 2 (3.4) | 0.72 |
| Stent diameter, mm | 2.81±0.37 | 2.82±0.42 | 2.79±0.29 | 0.65 |
| Total stent length, mm | 24.8±13.1 | 22.2±10.6 | 28.5±15.2 | 0.006 |
| Pre‐PCI Pd/Pa | 0.85 (0.71–0.91) | 0.88 (0.75–0.92) | 0.81 (0.66–0.88) | 0.02 |
| Post‐PCI Pd/Pa | 0.93 (0.88–0.97) | 0.95 (0.90–0.99) | 0.90 (0.88–0.95) | 0.0003 |
| Pre‐PCI FFR | 0.66 (0.52–0.74) | 0.69 (0.55–0.75) | 0.62 (0.43–0.73) | 0.07 |
| Post‐PCI FFR | 0.83 (0.75–0.89) | 0.88 (0.82–0.92) | 0.77 (0.73–0.86) | <0.0001 |
| Final FFR* | 0.84 (0.78–0.90) | 0.88 (0.82–0.93) | 0.80 (0.76–0.86) | <0.0001 |
| Drift | 0.01 (0.01–0.03) | 0.02 (0.01–0.03) | 0.01 (0–0.03) | 0.50 |
| TSGa | 0.04 (0.02–0.06) | 0.02 (010–0.03) | 0.07 (0.06–0.09) | <0.0001 |
Data are shown as mean±SD, n (%), or median (interquartile range). BMS indicates bare metal stent; DES, drug‐eluting stent; FFR, fractional flow reserve; LAD, left anterior descending; LCX, left circumflex; Pd/Pa, ratio of resting pressure distal to an obstruction to arterial pressure; PCI, percutaneous coronary intervention; RCA, right coronary artery; TSG, trans‐stent fractional flow reserve gradient.
*FFR in vessel with low FFR that underwent further intervention (see Methods).
TSG equals the FFR proximal to the stent minus FFR distal to the stent.
Table 5.
Predictors of Increased TSG (>0.04)
| Predictor | OR (95% CI) | P Value |
|---|---|---|
| LAD | 6.02 (2.37–15.31) | 0.0002 |
| Stent diameter | 0.99 (0.32–3.14) | 0.9949 |
| Total stent length | 1.06 (1.02–1.10) | 0.0036 |
| Moderate–severe calcification | 3.56 (1.27–9.97) | 0.0157 |
| Moderate–severe tortuosity | 4.81 (1.57–14.70) | 0.0059 |
| Diffuse disease | 0.45 (0.16–1.24) | 0.122 |
LAD indicates left anterior descending; TSG, trans‐stent fractional flow reserve gradient.
Figure 11.
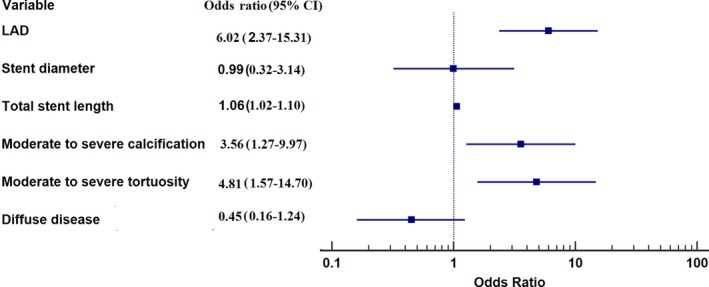
Forest plot of factors related to increased trans‐stent fractional flow reserve gradient (>0.04). LAD indicates left anterior descending artery.
Safety
No complications were attributed to the FCI procedure. Two patients (0.9%) had transient atrioventricular nodal block that resolved after stopping intravenous adenosine.
Discussion
This study is the first prospective evaluation of the feasibility and results of a strategy to include functional testing as an end point to determine adequacy of coronary intervention in an all‐comer population across the entire stenosis severity spectrum. The main findings include (1) that the strategy of FCI (ie, FFR both before and after PCI) can be successful in >90% of lesions (it is feasible using an optical‐sensor pressure wire), (2) that more than a third of vessels with angiographically successful PCI will have residual ischemia, (3) that ischemia can be improved by undertaking further interventions during the index procedure, and (4) that inadequate stent deployment contributes to residual ischemia.
The concept of functional optimization was introduced by Andreas Gruntzig in 1977.12 Because of equipment limitations, decrease in pressure gradient as an efficacy measure was rapidly discarded. With improvement in balloon catheters, stents, and particularly pressure wires, functional evaluation after intervention as an integral part of determining successful intervention can be reconsidered. The pressure wire employed was chosen because it uses an optical sensor, which improves wire‐handling characteristics. Its ability to navigate challenging anatomy was shown by a >95% lesion passage rate despite almost half of the lesions having stenosis ≥90%.
The incidence of residual ischemia (as defined by an FFR ≤0.8) in this prospective all‐comer registry in angiographically optimized vessels is higher than in any previous study. The reasons are likely due to the patient population studied and the pressure transducer location. Pijls et al4 described FFR <0.80 incidence of 5.7% in patients with single‐vessel disease. With the transducer by design placed 1 cm distal to the implanted stent, Li et al5 described 3.8% incidence, whereas incidence in the FAME trial was 21% with the transducer placed at the “junction between the proximal two third and the distal one third of the length of the epicardial artery.”13 With the pressure transducer in the distal vessel, Lee et al6 showed incidence of 18.2% and Agarwal et al3 showed incidence of 21%.
These findings emphasize the additive effects of multiple causes of obstruction over the entire vessel including a relatively underexpanded stent, as reflected by the TSG, and distal diffuse disease. Because the purpose of intervention is to eliminate ischemia in the territory at risk, it is proposed as a standard that the pressure transducer after PCI be placed in a distal position, where PCI can be performed if evidence of focal step‐up is confirmed on pullback. In this regard, it is not surprising that the left anterior descending artery, which has the longest course and supplies the largest amount of myocardium, had the strongest independent association with residual ischemia in this and several previous studies.14, 15, 16 Pressure drift cannot explain the current results because pullback to the guide catheter was measured in all patients; if drift was ≥0.04, the pressures were re‐equalized and pullback repeated.
Importantly, this prospective evaluation demonstrated that FFR can be improved by subsequent intervention. However, unlike a previous retrospective analysis3 in which most vessels with residual ischemia (91%) were functionally improved by further intervention, successful intervention was possible less frequently in the current study (35% of vessels with residual ischemia). Patients not treated were considered to have diffuse disease based on a pullback showing gradual pressure increase; in some cases, this was corroborated with imaging. The study results are likely related to the more extensive plaque burden related in turn to the routine use of the FFR wire in severe lesions up to 99%; this group of patients has not previously been evaluated prospectively.
Several studies have attempted to ascertain a post‐PCI FFR threshold (0.85–0.96) to decide on subsequent intervention to improve long‐term outcomes.17 The current study considered the threshold for further intervention as ≤0.8 based on randomized studies using this value for decision‐making to initially intervene.18, 19 Although different studies have used different FFR thresholds to intervene, what is clear is that in studies evaluating long‐term outcome, the highest FFR subgroup after PCI in each study demonstrated the lowest incidence of adverse long‐term outcomes, supporting the concept that for post‐PCI FFR, “higher” is better. This finding encourages evaluation for a treatable source of obstruction, including imaging, if the cause of the low FFR is not apparent.
Moreover, the majority of persistently ischemic vessels after intervention showed an FFR in the normal range on pullback immediately distal to the stent. Thus, a major location of ischemia after intervention is distal to the stent in an angiographically optimized vessel without a clear stenosis (with a pullback showing a gradual increase in FFR compatible with diffuse disease). Although this finding may appear to favor diffuse disease as the primary cause of residual ischemia in this study, stent underexpansion or undersizing likely also played an important role. Theoretically, there should be no TSG if the stent is sized correctly to match the true diameter of the nondiseased vessel. There was, in fact, an intrastent gradient on pullback in >90%, with the frankly ischemic vessels showing significantly higher TSG (Table 2), which is in keeping with relative stent underexpansion. van Zandvoort et al7 showed by intravascular ultrasound in vessels with post‐PCI FFR <0.85 that stent underexpansion was present in 74% of cases compared with 22% of vessels with FFR >0.85.7 In the present study, complex lesion characteristics including moderate to severe calcification and tortuosity were strongly associated with increased TSG, lending further credence to incomplete stent expansion despite satisfactory angiographic appearance. Therefore, imaging vessels with residual ischemia may identify stent underexpansion and provide an opportunity to improve final FFR.
Clinical Applicability of FCI
This study showed that FCI improves short‐term results but leaves a large percentage of vessels (3 in 10) with some degree of residual ischemia. Complementary imaging is likely to further decrease the percentage of vessels with residual ischemia, as illustrated by Figure 1. When using intravascular ultrasound routinely during PCI and comparing long‐term outcomes with angiography alone in the ULTIMATE (Intravascular Ultrasound Guided Drug Eluting Stent Implantation in “All‐Comers” Coronary Lesion) trial,20 the intravascular ultrasound group showed fewer long‐term target vessel failures. Particularly relevant to functional testing, stents that did not meet the prespecified definition of satisfactory implantation (likely reflected by higher TSG on FFR) had a rate of target vessel failure almost 3 times higher (4.4%) than that of stented vessels with optimized expansion (1.6%). In this regard, it is hypothesized that the addition of imaging where residual ischemia exists after apparent angiographic optimization will clarify the cause of low FFR and provide a guide to further treat the vessel and improve the final functional result and subsequent long‐term outcomes.
Further efficiencies in FCI are likely to occur with use of resting indexes such as instantaneous wave‐free ratio or other nonhyperemic resting indexes20 that do not require the use of adenosine, decreasing both expense and time. Recently, multiple resting diastolic indexes have been compared with instantaneous wave‐free ratio and show >99% correlation.21 The relationship of these nonhyperemic indexes after PCI to long‐term outcomes is required.
The presence of low FFR (≤0.80) in a substantial percentage of patients in this study also emphasizes the importance of maintaining guideline‐directed medical therapy. The finding of residual ischemia may explain, in part, improved outcomes with bypass surgery in certain subgroups, particularly patients with diffuse disease, for whom residual ischemia may potentially be treated better with bypass surgery than PCI.22
The ultimate value of the FCI strategy requires a randomized long‐term study comparing FCI to angiographic optimization alone. The current study demonstrates the feasibility of FCI and confirms that a relatively large percentage of patients with severe coronary obstruction who have an excellent angiographic result have residual low FFR that can be improved by further intervention.
Study Limitations
This study has some limitations. The data emanate from a single center, which may limit generalizability, and because PCI was performed on male veterans, our results can only be extrapolated to women. However, the registry was prospectively designed with informed consent and a plan to use post‐PCI FFR as a routine clinical approach in all eligible patients; by and large, this approach was successful. Decision‐making and subsequent interventions were based on the operator's discretion without a “preset” FFR threshold; although this may be considered a limitation, it is in keeping with current clinical practice. Imaging was not mandatory. It is emphasized that the registry design was used to simulate current clinical practice including maintaining procedural efficiency; the only modification was the use of post‐PCI FFR testing. It is clearly possible—in fact, likely—that the addition of imaging in functionally unsatisfactory cases may further improve immediate functional results by identifying vessel sites to treat. In fact, the results of this study, particularly evidence for stent underexpansion by the presence of a TSG, encourage further imaging to ensure adequate stent deployment. The higher incidence of residual ischemia in this study than in previous studies and the lower rate of intervention in this group may have been the play of chance. However, a more likely explanation is that more severely diseased vessels, which are known to have larger plaque burden, were evaluated.
Conclusions
This study shows that FCI is feasible and safe. Residual ischemia is frequent after angiographically optimized PCI and can be improved by further intervention. Ischemia is primarily located distal to the stent and is contributed by stent underexpansion and diffuse disease. Further studies are required to determine the long‐term outcomes using the FCI strategy.
Disclosures
Dr Uretsky received speaking fees from Opsens Inc. The remaining authors have no disclosures to report.
Supporting information
Table S1. Angiographic Characteristics in the Subgroup With Systematic Pullback (n=138)
Table S2. Predictors of Ischemia in the Subgroup With Systematic Pullback (n=138)
Figure S1. Forest plot of factors related to postintervention ischemia in the subgroup with systematic pullback (n=138).
(J Am Heart Assoc. 2020;9:e015073 DOI: 10.1161/JAHA.119.015073.)
References
- 1. Hakeem A, Uretsky BF. Role of postintervention fractional flow reserve to improve procedural and clinical outcomes. Circulation. 2019;139:694–706. [DOI] [PubMed] [Google Scholar]
- 2. Wolfrum M, De Maria GL, Benenati S, Langrish J, Lucking AJ, Channon KM, Kharbanda RK, Banning AP. What are the causes of suboptimal FFR after coronary stent deployment? EuroIntervent . 2018;14:e1324–e1331. [DOI] [PubMed] [Google Scholar]
- 3. Agarwal SK, Kasula S, Hacioglu Y, Ahmed Z, Uretsky BF, Hakeem A. Utilizing post‐intervention fractional flow reserve to optimize acute results and the relationship to long‐term outcomes.JACC Cardiovasc. Interv. 2016;9:1022–1031. [DOI] [PubMed] [Google Scholar]
- 4. Pijls NH, Klauss V, Siebert U, Powers E, Takazawa K, Fearon WF, Escaned J, Tsurumi Y, Akasaka T, Samady H, De Bruyne B; for the Fractional Flow Reserve (FFR) Post‐Stent Registry Investigators . Coronary pressure measurement after stenting predicts adverse events at follow‐up. Circulation. 2002;105:2950–2954. [DOI] [PubMed] [Google Scholar]
- 5. Li SJ, Ge Z, Kan J, Zhang J‐J, Ye F, Kwan TW, Santoso T, Yang S, Sheiban I, Qian X‐S, Tian N‐L, Rab TS, Ling T, Chen S‐L. Cutoff value and long‐term prediction of clinical events by FFR measured immediately after implantation of a drug‐eluting stent in patients with coronary artery disease.JACC. Cardiovasc Interv. 2017;10:986–995. [DOI] [PubMed] [Google Scholar]
- 6. Lee JM, Hwang D, Choi KH, Rhee T‐M, Park J, Kim HY, Jung HW, Hwang J‐W, Lee H, Jang H‐J, Kim SH, Song BY, Cho Y‐K, Nam C‐W, Hahn J‐Y, Shin E‐S, Kawase Y, Matsuo A, Tanaka N, Doh J‐H, Koo B‐K, Matsuo H. Prognostic implications of relative increase and final fractional flow reserve in patients with stent implantation.J. Am Coll Cardiol Intv. 2018;11:2099–2109. [DOI] [PubMed] [Google Scholar]
- 7. van Zandvoort LJC, Masdjedi K, Witberg K, Ligthart J, Tovar Forero MN, Diletti R, Lemmert ME, Wilschut J, de Jaegere PPT, Boersma E, Zijlstra F, Mieghem NM, Daemen J.Explanation of postprocedural fractional flow reserve below 0.85. Circ Cardiovasc Interv. 2019;12:e007030. [DOI] [PubMed] [Google Scholar]
- 8. Piroth Z, Toth GG, Tonino PAL, Aghlmandi S, Curzen N, Rioufol G, Pijls NHJ, Fearon WF, Jüni P, De Bruyne B. Prognostic value of fractional flow reserve measured immediately after drug‐eluting stent implantation. Circ Cardiovasc Interv. 2017;10:e005233. [DOI] [PubMed] [Google Scholar]
- 9. Johnson NP, Tóth GG, Lai D, Lai D, Zhu H, Açar G, Agostoni P, Appelman Y, Arslan F, Barbato E, Chen S‐L, Serafino L, Domínguez‐Franco AJ, Dupouy P, Esen AM, Esen OB, Hamilos M, Iwasaki K, Jensen LO, Jiménez‐Navarro MF, Katritsis DG, Kocaman SA, Koo B‐K, López‐Palop R, Lorin JD, Miller LH, Muller O, Nam C‐W, Puymirat E, Rieber J, Rioufol G, Rodés‐Cabau J, Sedlis SP, Tonino PAL, Van Belle E, Verna E, Werner GS, Fearon WF, Pijls NHJ, De Bruyne B, Gould KL. Prognostic value of fractional flow reserve. J Am Coll Cardiol. 2014;64:1641–1654. [DOI] [PubMed] [Google Scholar]
- 10. Sels JW, Tonino PA, Siebert U, Fearon WF, Van't Veer M, De Bruyne B, Pijl NHJ. Fractional flow reserve in unstable angina and non‐ST‐segment elevation myocardial infarction experience from the FAME study. JACC Cardiovasc Interv. 2011;4:1183–1189. [DOI] [PubMed] [Google Scholar]
- 11. Peduzzi P, Concato J, Feinstein AR, Holford TR. Importance of events per independent variable in proportional hazards regression analysis. II. Accuracy and precision of regression estimates. J Clin Epidemiol. 1995;48:1503–1510. [DOI] [PubMed] [Google Scholar]
- 12. Grüntzig A, Senning A, Siegenthaler W. Nonoperative dilatation of coronary‐artery stenosis. N Engl J Med. 1979;301:61–68. [DOI] [PubMed] [Google Scholar]
- 13. Piroth Z, Toth GG, Tonino PAL, Barbato E, Aghlmandi S, Curzen N, Rioufol G, Pijl NHJ, Fearon WF, Juni P, De Bruyne B. Response by Piroth et al to letter regarding article, “Prognostic value of fractional flow reserve measured immediately after drug‐eluting stent implantation”. Circ Cardiovasc Interv. 2017;10:e005973. [DOI] [PubMed] [Google Scholar]
- 14. Samady H, McDaniel M, Veledar E, De Bruyne B, Pijls NH, Fearon WF, Vaccarino V. Baseline fractional flow reserve and stent diameter predict optimal post‐stent fractional flow reserve and major adverse cardiac events after bare‐metal stent deployment. J Am Coll Cardiol Intv. 2009;2:357–363. [DOI] [PubMed] [Google Scholar]
- 15. Agarwal SK, Kasula S, Almomani A, Hacioglu Y, Ahmed Z, Uretsky BF, Hakeem A. Clinical and angiographic predictors of persistently ischemic fractional flow reserve after percutaneous revascularization. Am Heart J. 2017;184:10–16. [DOI] [PubMed] [Google Scholar]
- 16. Kimura Y, Tanaka N, Okura H, Yoshida K, Akabane M, Takayama T, Hirayama A, Tada T, Kimura T, Takano H, Mizuno K, Inami T, Yoshino H, Yamashina A. Characterization of real‐world patients with low fractional flow reserve immediately after drug‐eluting stents implantation. Cardiovasc Interv Ther. 2016;31:29–37. [DOI] [PubMed] [Google Scholar]
- 17. Koo B‐K, Hwang D. Imaging and physiological assessment after stent implantation. Circ Cardiovasc Interv. 2019;12.. [DOI] [PubMed] [Google Scholar]
- 18. van Nunen LX, Zimmermann FM, Tonino PAL, Barbato E, Baumbach A, Engstrøm T, Klauss V, MacCarthy PA, Manoharan G, Oldroyd KG, Ver Lee PN, Van't Veer M, Fearon WF, De Bruyne B, Pijls NH; FAME Study Investigators . Fractional flow reserve versus angiography for guidance of PCI in patients with multivessel coronary artery disease (FAME). Lancet. 2015;386:1853–1860. [DOI] [PubMed] [Google Scholar]
- 19. De Bruyne B, Pijls NH, Kalesan B, Barbato E, Tonino PA, Piroth Z, Jagic N, Möbius‐Winkler S, Rioufol G, Witt N, Kala P, MacCarthy P, Engström T, Oldroyd KG, Mavromatis K, Manoharan G, Verlee P, Frobert O, Curzen N, Johnson JB, Jüni P, Fearon WF; FAME 2 Trial Investigators . Fractional flow reserve‐guided PCI versus medical therapy in stable coronary disease. N Engl J Med. 2012;367:991–1001. [DOI] [PubMed] [Google Scholar]
- 20. Zhang J, Gao X, Kan J, Zhang J, Gao X, Kan J, Ge Z, Han L, Lu S, Tian N, Lin S, Lu Q, Wu X, Li Q, Liu Z, Chen Y, Qian X, Wang J, Chai D, Chen C, Li X, Gogas BD, Pan T, Shan S, Ye F, Chen SL. Intravascular ultrasound‐guided versus angiography‐guided implantation of drug‐eluting stents in all‐comers. J Am Coll Cardiol. 2018;72:3126–3137. [DOI] [PubMed] [Google Scholar]
- 21. van ’t Veer M, Pijls NHJ, Hennigan B, Watkins S, Ali ZA, De Bruyne B, Zimmermann FM, van Nunen LX, Barbato E, Berry C, Oldroyd KG. Comparison of different diastolic resting indexes to iFR. JACC. 2017;70:3088–3096. [DOI] [PubMed] [Google Scholar]
- 22. Farkouh ME, Domanski M, Dangas GD, Shah B, Stefanini GG, Sidhu MS, Tanguay J‐F, Ramanathan K, Sharma SK, French J, Hueb W, Cohen DJ, Fuster V; for the FREEDOM Follow‐On study investigators . Long‐term survival following multivessel revascularization in patients with diabetes. J Am Coll Cardiol. 2019;73:629–638. [DOI] [PMC free article] [PubMed] [Google Scholar]
Associated Data
This section collects any data citations, data availability statements, or supplementary materials included in this article.
Supplementary Materials
Table S1. Angiographic Characteristics in the Subgroup With Systematic Pullback (n=138)
Table S2. Predictors of Ischemia in the Subgroup With Systematic Pullback (n=138)
Figure S1. Forest plot of factors related to postintervention ischemia in the subgroup with systematic pullback (n=138).


