Abstract
Background
Race is an established risk factor for sudden cardiac death (SCD). We sought to determine whether the association of electrophysiological substrate with SCD varies between black and white individuals.
Methods and Results
Participants from the ARIC (Atherosclerosis Risk in Communities) study with analyzable ECGs (n=14 408; age, 54±6 years; 74% white) were included. Electrophysiological substrate was characterized by ECG metrics. Two competing outcomes were adjudicated: SCD and non‐SCD. Interaction of ECG metrics with race was studied in Cox proportional hazards and Fine‐Gray competing risk models, adjusted for prevalent cardiovascular disease, risk factors, and incident nonfatal cardiovascular disease. At the baseline visit, adjusted for age, sex, and study center, blacks had larger spatial ventricular gradient magnitude (0.30 mV; 95% CI, 0.25–0.34 mV), sum absolute QRST integral (18.4 mV*ms; 95% CI, 13.7–23.0 mV*ms), and Cornell voltage (0.30 mV; 95% CI, 0.25–0.35 mV) than whites. Over a median follow‐up of 24.4 years, SCD incidence was higher in blacks (2.86 per 1000 person‐years; 95% CI, 2.50–3.28 per 1000 person‐years) than whites (1.37 per 1000 person‐years; 95% CI, 1.22–1.53 per 1000 person‐years). Blacks with hypertension had the highest rate of SCD: 4.26 (95% CI, 3.66–4.96) per 1000 person‐years. Race did not modify an association of ECG variables with SCD, except QRS‐T angle. Spatial QRS‐T angle was associated with SCD in whites (hazard ratio, 1.38; 95% CI, 1.25–1.53) and hypertension‐free blacks (hazard ratio, 1.52; 95% CI, 1.09–2.12), but not in blacks with hypertension (hazard ratio, 1.15; 95% CI, 0.99–1.32) (P‐interaction=0.004).
Conclusions
Race did not modify associations of electrophysiological substrate with SCD and non‐SCD. Electrophysiological substrate does not explain racial disparities in SCD rate.
Keywords: ECG, global electrical heterogeneity, race, sudden cardiac death
Subject Categories: Race and Ethnicity, Epidemiology, Electrophysiology
Clinical Perspective
What Is New?
Race does not modify an association between electrophysiological substrate and sudden cardiac death.
Voltage‐based ECG metrics (spatial ventricular gradient magnitude, sum absolute QRST integral, and Cornell voltage) are larger in black than white individuals.
Voltage‐based ECG metrics are associated with increased sudden cardiac death risk in obese black individuals.
What Are the Clinical Implications?
Applying Critical Race Theory to increased risk of sudden cardiac death in black compared with white individuals emphasizes the need for additional studies investigating the effects of institutionalized racism on health.
Development of race‐specific sudden cardiac death risk stratification tools is needed to incorporate race‐specific thresholds of ECG voltage‐based metrics.
Prevention and treatment of obesity in black individuals with increased voltage‐based ECG metrics may be potentially lifesaving.
Sudden cardiac death (SCD) disproportionately affects black individuals, with a nearly 2‐fold increased risk of SCD in black compared with white individuals.1, 2, 3 Socioeconomic disparities and the burden of cardiovascular risk have been proposed as factors that may underlie the observed racial differences in SCD.1 However, adjustment for socioeconomic and behavioral measures of health does not fully explain an excess of SCD risk in black inidividuals.1, 2, 4 Moreover, the large prospective community‐based cohort, the ARIC (Atherosclerosis Risk in Communities) study, showed that race modifies an association of several major risk factors with SCD. Prevalent coronary heart disease (CHD) and body mass index (BMI) carried greater risk of SCD in white compared with black individuals.1 In contrast, hypertension carried a significantly larger risk of SCD in black individuals compared with white individuals.1 The mechanisms behind these observed interactions remain unclear but pose the question of differences in electrophysiological substrate metrics between the 2 racial groups.
A conventional 12‐lead ECG characterizes the global electrophysiological substrate of SCD,5 which can be assessed by traditional ECG metrics, such as heart rate, QRS duration, corrected QT (QTc) interval, and ECG left ventricular hypertrophy (LVH). Previous studies did not find differences in heart rate, QRS duration, and QT (QTc) QTc interval between white and black individuals.2 Yet, racial differences in ECG LVH are well‐known,6, 7, 8 bearing challenges in ECG interpretation.9 Although racial differences in ECG LVH diagnostic criteria are recognized,10 it is unknown whether there are racial differences in the strength of association between electrophysiological substrate and SCD.
Global electrical heterogeneity (GEH) is a novel ECG measure of global electrophysiological substrate.11, 12 GEH is measured by spatial QRS‐T angle, magnitude and direction (elevation and azimuth) of the spatial ventricular gradient (SVG) vector, and its scalar value sum absolute QRST integral (SAI QRST). The addition of GEH to known cardiovascular risk factors improves the reclassification of SCD risk.13 The SVG vector describes the magnitude and direction of the steepest gradient between the areas of the heart with the longest and the shortest total recovery time.14, 15, 16 The SVG is related to global heterogeneity of action potential duration and morphological characteristics17, 18 through the heart. Although association of GEH with SCD is independent of cardiovascular disease and known cardiovascular risk factors,13 it remains unknown whether race can modify an association of GEH with SCD.
Self‐identified race is a social construct. Recently, the Public Health Critical Race Praxis19 was developed as a theoretical framework for studies of racial disparities. Critical Race Theory20 aims to acknowledge inequities in the biomedical field and bring to light health consequences that result from discrimination and inequalities in access to health care. Race is a product of social processes of power. Critical Race Theory defines race not as an inherent characteristic of a person, but as a product of social practices.20 Our goal was to apply the Public Health Critical Race Praxis19 approach to the epidemiological study of SCD substrate, to answer the question of whether race modifies the association of electrophysiological substrate with SCD. We hypothesized that (1) there are racial differences in global ECG measures of electrophysiological substrate and (2) self‐identified race modifies the association of electrophysiological substrate with SCD.
Methods
The ARIC study data are available through the National Heart, Lung, and Blood Institute's Biological Specimen and Data Repository Information Coordinating Center21 and the National Center of Biotechnology Information's Database of Genotypes and Phenotypes.22 Informed consent was obtained from all study participants before enrollment. The study was approved by the Oregon Health and Science University Institutional Review Board.
Study Population
The ARIC study recruited 15 792 participants (age, 45–64 years) in 1987 to 1989. All participants underwent standardized examinations.23 In this study, we included ARIC study cohort participants with recorded resting 12‐lead ECG and measured GEH13 (n=15 777). We excluded participants who self‐identified themselves as nonwhite or nonblack race (n=48), as black at the Washington County and Minneapolis field centers (because of small subgroup size; n=55), and those with missing covariates (n=1220), outcome (n=1), and nonsinus median beat (n=45). The final sample of participants with normal sinus median beat included 14 408 participants (Figure 1).
Figure 1.
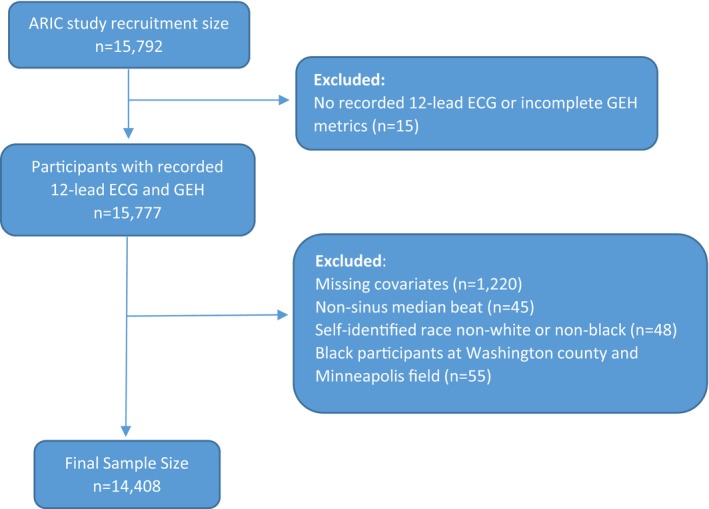
Flowchart of study cohort development. ARIC indicates Atherosclerosis Risk in Communities; GEH, global electrical heterogeneity.
Exposures of Race and Electrocardiographic GEH
Race was self‐reported. We analyzed resting 12‐lead ECGs of the first 5 study visits.24 Visit 1 was conducted in 1987 to 1989, visit 2 in 1990 to 1992, visit 3 in 1993 to 1995, visit 4 in 1996 to 1998, and visit 5 in 2011 to 2013.
Electrophysiological substrate was characterized by traditional and novel global ECG metrics.24 Traditional ECG metrics (heart rate, QRS duration, Bazett‐corrected QTc interval, and RaVL and SV3 amplitudes) were measured by the 12 SL algorithm, as implemented in the Magellan ECG Research Workstation V2 (GE Marquette Electronics, Milwaukee, WI); and Cornell voltage was calculated as the sum of RaVL and SV3 amplitudes.
GEH was measured by spatial QRS‐T angle, SVG magnitude, azimuth, and elevation, and SAI QRST.25 Both area and peak SVG vectors as well as QRS‐T angles were measured.25 We used normal sinus time‐coherent median beat with identified isoelectric heart vector origin point.26 The open‐source MATLAB (MathWorks, Natick, MA) software code for GEH measurement and the heart vector origin definition is provided at https://physionet.org/physiotools/geh and https://github.com/Tereshchenkolab/Origin.
Primary Outcome: SCD
Follow‐up of ARIC study participants27 and determination of SCD have been described in prior reports.24 SCD, the primary study outcome, was defined as a sudden pulseless condition in a previously stable participant without a noncardiac cause of arrest if it occurred outside of the hospital or in the emergency department. It was classified as definite, probable, or possible, on the basis of physician adjudication.
Competing mortality outcome: non‐SCD
Competing non‐SCD was defined as an SCD exclusion, a composite of fatal CHD, heart failure (HF) death, death in a participant with baseline HF, or incident hospitalized HF. Fatal CHD cases were adjudicated by the ARIC study Morbidity and Mortality Classification Committee.27, 28 Baseline prevalent HF was based on Gothenburg criteria (stage 3 symptomatic HF with both cardiac and pulmonary symptoms and current medical treatment29) or self‐reported use of HF medication. Incident HF was defined as the presence of HF codes in a death certificate or an International Classification of Diseases, Ninth Revision (ICD‐9), discharge code, as previously described.30 All other deaths were included in the noncardiac death outcome.
Baseline Clinical Characteristics
BMI was categorized as underweight (<18.5 kg/m2), normal weight (18.5–<25.0 kg/m2), overweight (25.0–<30.0 kg/m2), or obese (≥30.0 kg/m2). Hypertension was defined as blood pressure of ≥140/90 mm Hg or self‐reported antihypertensive medications at visit 1. Diabetes mellitus was defined as nonfasting blood glucose ≥200 mg/dL, fasting blood glucose ≥126 mg/dL, self‐reported physician diagnosis of diabetes mellitus, or self‐reported medications for diabetes mellitus or high blood sugar at visit 1. Stages of chronic kidney disease (CKD) were based on estimated glomerular filtration rate (eGFR), calculated using the CKD Epidemiology Collaboration (CKD‐EPI) equation.31 Participants were classified into stage 1 CKD (eGFRCKD‐EPI ≥90 mL/min per 1.73 m2), stage 2 CKD (eGFRCKD‐EPI 60–<90 mL/min per 1.73 m2), stage 3 CKD (eGFRCKD‐EPI 30–<60 mL/min per 1.73 m2), stage 4 CKD (eGFRCKD‐EPI 15–<30 mL/min per 1.73 m2), stage 5 CKD (eGFRCKD‐EPI <15 mL/min per 1.73 m2), or established kidney failure. Baseline serum electrolyte concentrations were measured in the central laboratory.
Prevalent stroke was based on a previously reported stroke and transient ischemic attack diagnostic algorithm.32 Prevalent CHD included a self‐reported physician diagnosis of myocardial infarction, baseline ECG evidence of myocardial infarction by the Minnesota code,33 or a history of coronary revascularization (via either coronary artery bypass surgery or percutaneous coronary intervention). The use of antiarrhythmic drugs included self‐reported and validated by medications inventory use of class I, II (β blockers), III, IV (phenylalkylamines and benzothiazepine calcium channel blockers), or V (digoxin) antiarrhythmic agents.
Socioeconomic Factors
Socioeconomic status was assessed during a home interview at visit 1. Total combined family income for the past 12 months (in 1987–1989 values) was self‐reported in one of the following categories: <$5000; $5000 to $7999; $8000 to $11 999; $12 000 to $15 999; $16 000 to $24 999; $25 000 to $34 999; $35 999 to $49 999; >$50 000; or not reported. Lifetime educational level was defined as the highest grade or year of school completed. The most recent occupation was recorded in one of the following categories: (1) managerial and professional specialty occupations; (2) technical, sales, and administrative support occupations; (3) service occupations; (4) farming, forestry, and fishing occupations; (5) precision production, craft, and repair occupations; (6) operators, fabricators, and laborers; (7) homemakers; (8) retired; or (9) others.
Baseline physical activity was measured at work, in sport, and during leisure time, using the modified Baecke questionnaire,34 which defined semicontinuous indexes ranging from 1 (low) to 5 (high). Current cigarette smoking and consumption of alcoholic beverages were self‐reported at visit 1. Self‐reported health insurance status was ascertained at visit 1.
Incident Nonfatal Cardiovascular Events
Incident nonfatal cardiovascular events included atrial fibrillation, stroke, CHD, and HF. Incident atrial fibrillation included atrial fibrillation detected on follow‐up 12‐lead ECG or hospital discharge records (ICD‐9 code 427.3).35 Physician‐adjudicated definite or probable incident strokes were included.36 Incident CHD was physician adjudicated and included definite or probable myocardial infarction or a coronary revascularization procedure.27, 28 Incident HF was defined above.30
Statistical Analyses
Cross‐sectional analyses of visit 1 data
To investigate differences in global ECG metrics between black and white individuals, we performed cross‐sectional linear regression analyses using visit 1 data. Model 1 was adjusted for age, sex, and study center. To determine whether racial differences in GEH could be explained by racial disparities, including differences in socioeconomic, traditional, and novel clinical risk factors, model 2 was additionally adjusted for prevalent cardiovascular disease (HF, CHD, or stroke), known cardiovascular risk factors (diabetes mellitus, hypertension, current smoking and alcohol intake, work, sport, and leisure physical activity levels, levels of total cholesterol, high‐density lipoprotein, and triglycerides, and BMI), use of antihypertensive and antiarrhythmic medications, serum concentrations of sodium, potassium, calcium, magnesium, phosphorus, and uric acid, total protein and albumin, blood urea nitrogen, CKD stage classified by eGFRCKD‐EPI, traditional ECG characteristics (mean heart rate, QRS duration, QTc interval, and Cornell voltage), and socioeconomic factors (education level, occupation category, income, and health insurance).
Analysis of circular variables
Spatial QRS‐T angle, SVG azimuth, and SVG elevation are circular variables. Unadjusted comparison of circular variables was performed using the Watson U‐square statistic and the Kuiper statistics.
By convention, QRS‐T and SVG elevation angles can be only positive, ranging from 0° to 180°. Because distributions of QRS‐T angle and SVG elevation angle were normal or nearly normal, QRS‐T and SVG elevation angles were included in all conventional statistical analyses without transformation. The SVG azimuth angle is expressed as an axial variable, ranging from −180° to 180°. As recommended for circular statistics,37 we transformed SVG azimuth by doubling its value and then adding 360°. We then analyzed the SVG azimuth using a conventional statistical approach, and for interpretation, transformed it back.
Survival analyses
We built Cox proportional hazards and Fine‐Gray competing risks models. The proportional‐hazards assumption was verified using stcox PH‐assumptions suite of tests implemented in STATA (StataCorp LP, College Station, TX) for all predictors of interest in most models. Exceptions were stated. All ECG variables were represented as their z score to standardize comparisons. To adjust for confounders, we constructed 2 models, performed a statistical test for interaction with race in each model, and constructed race‐stratified models for white and black individuals. Relative hazard ratio with 95% CI of SCD risk for black relative to white individuals was reported, assuming hazard ratio for white individuals is a reference.
Model 1 was adjusted for demographic characteristics (age, sex, and study center), prevalent cardiovascular disease (HF, CHD, and stroke), baseline cardiovascular risk factors (diabetes mellitus, hypertension, levels of total cholesterol, high‐density lipoprotein, and triglycerides, BMI, use of antihypertensive and antiarrhythmic medications, serum concentrations of sodium, potassium, calcium, magnesium, phosphorus, and uric acid, total protein and albumin, blood urea nitrogen, and CKD stage classified by eGFRCKD‐EPI,), and socioeconomic factors measured at visit 1 (smoking and alcohol intake, work, sport, and leisure physical activity levels, education level, occupation category, income, and health insurance). Time‐updated model 2 included time‐updated ECG predictors (one by one), all baseline covariates included in model 1, and time‐varying covariate incident nonfatal cardiovascular events (atrial fibrillation, HF, CHD, and stroke). ECG variables were time varying, updated in the exact date of ECG recording. The span of time was either from one ECG recording to another ECG recording or from an ECG recording to the primary outcome, competing death outcome, or the last known follow‐up (censored). Race‐stratified associations of continuous ECG variables with SCD were also studied using adjusted (model 1) Cox regression models incorporating cubic splines with 4 knots.
To compare competing risks of SCD and non‐SCD, we constructed 2 Fine and Gray's competing risk models38 for SCD and non‐SCD outcomes, using the same covariates as in Cox models. We calculated the relative sub–hazard ratio with 95% CI of SCD risk for black relative to white individuals, assuming sub–hazard ratio for the white participants is a reference.
On the basis of a recent study demonstrating that race significantly modified association of hypertension, CHD, and BMI with SCD,1 we additionally constructed sets of models that included 2‐way interactions with race and hypertension, race and CHD, and race and BMI categories. Because of the small size of the underweight BMI category, for 2‐by‐2 interaction analysis, we lumped together underweight and normal‐weight BMI categories and referenced them as normal weight. The white hypertension‐free, white CHD‐free, and white normal‐weight subgroups were the reference subgroups in respective models. The 2‐by‐2 interaction analysis was performed for global ECG variables that were significantly different by race (voltage‐based global ECG metrics), or if race significantly modified their association with SCD (spatial QRS‐T angle).
Statistical analyses were performed using STATA MP 16.1 (StataCorp LP, College Station, TX). Considering the many multivariate analyses performed, statistical significance at the 0.05 level should be interpreted cautiously.
Results
Study Population
Black study participants (Table 1) were slightly younger, with a higher prevalence of HF, stroke, and major risk factors (hypertension, diabetes mellitus, and smoking) than white individuals. White participants had a higher prevalence of CHD, had a higher level of triglycerides, were less physically active at work, but were more physically active at leisure and sport than black participants. There were large disparities between races in access to health care, income, education, and occupation.
Table 1.
Comparison of Baseline Clinical and ECG Characteristics in Black and White Participants
| Characteristics | Black Participants (n=3739) | White Participants (n=10 669) | P Value |
|---|---|---|---|
| Age, mean (SD), y | 53.5 (5.8) | 54.4 (5.7) | <0.0001 |
| Women, n (%) | 2309 (61.8) | 5622 (52.7) | <0.0001 |
| Heart failure, n (%) | 257 (6.9) | 407 (3.8) | <0.0001 |
| Coronary heart disease, n (%) | 148 (4.0) | 534 (5.0) | 0.009 |
| Stroke, n (%) | 106 (2.8) | 138 (1.29) | <0.0001 |
| Body mass index, mean (SD), kg/m2 | 29.6 (6.2) | 27.0 (4.9) | <0.0001 |
| Diabetes mellitus, n (%) | 733 (19.6) | 965 (9.0) | <0.0001 |
| Hypertension, n (%) | 2077 (55.6) | 2886 (27.1) | <0.0001 |
| Antihypertensive drugs, n (%) | 1644 (44.0) | 2731 (25.6) | <0.0001 |
| Current tobacco smoker, n (%) | 1126 (30.1) | 2643 (24.8) | <0.0001 |
| Current alcohol drinker, n (%) | 1189 (31.8) | 6894 (64.6) | <0.0001 |
| Leisure physical activity score, mean (SD) | 2.1 (0.6) | 2.5 (0.5) | <0.0001 |
| Sport physical activity score, mean (SD) | 2.2 (0.7) | 2.5 (0.8) | <0.0001 |
| Work physical activity score, mean (SD) | 2.3 (1.0) | 2.1 (0.9) | <0.0001 |
| Family income <$25 000, n (%) | 2406 (64.4) | 2779 (26.0) | <0.0001 |
| Education less than high school, n (%) | 1538 (41.1) | 1813 (17.0) | <0.0001 |
| Health insurance, n (%) | 2883 (77.1) | 10 163 (95.3) | <0.0001 |
| Total cholesterol, mean (SD), mmol/L | 5.6 (1.2) | 5.6 (1.1) | 0.924 |
| HDL cholesterol, mean (SD), mg/dL | 55.2 (17.7) | 50.4 (16.7) | <0.0001 |
| Triglycerides, mean (SD), mmol/L | 1.3 (0.9) | 1.6 (1.0) | <0.0001 |
| Chronic kidney disease stage ≤1, n (%) | 2901 (77.6) | 7039 (66.0) | <0.0001 |
| Use of antiarrhythmic drugs, n (%) | 548 (14.7) | 1464 (13.7) | 0.156 |
| Heart rate, mean (SD), bpm | 66.5 (11.0) | 66.2 (9.9) | 0.132 |
| QRS duration, mean (SD), ms | 91.4 (12.6) | 92.5 (12.2) | <0.0001 |
| QTc, mean (SD), ms | 418 (21) | 416 (18) | <0.0001 |
| Cornell voltage, mean (SD), mV | 1.5 (0.6) | 1.2 (0.5) | <0.0001 |
| Peak QRS‐T angle, mean (circular SD), ° | 47.3 (36.3) | 40.6 (30.2) | <0.001 |
| Area QRS‐T angle, mean (circular SD), ° | 60.8 (29.4) | 60.4 (27.6) | <0.05 |
| Peak SVG elevation, mean (circular SD), ° | 66.4 (14.2) | 62.4 (15.5) | <0.001 |
| Area SVG elevation, mean (circular SD), ° | 71.5 (15.9) | 66.0 (17.5) | <0.001 |
| Peak SVG azimuth, mean (circular SD), ° | 6.7 (19.5) | 1.2 (21.1) | <0.001 |
| Area SVG azimuth, mean (circular SD), ° | 25.2 (21.5) | 24.6 (21.5) | <0.001 |
| SAI QRST, mean (SD), mV*ms | 157 (60) | 139 (46) | <0.0001 |
| Peak SVG magnitude, mean (SD), mV | 1.8 (0.5) | 1.5 (0.4) | <0.0001 |
| SVG magnitude, mean (SD), mV | 2.0 (0.5) | 1.6 (0.4) | <0.0001 |
Bpm indicates beats per minute; HDL, high‐density lipoprotein; SAI QRST, sum absolute QRST integral; SVG, spatial ventricular gradient; QTc, corrected QT.
Differences in ECG Metrics Between Black and White Participants
SVG magnitude, SAI QRST, and Cornell voltage were significantly larger in black than white individuals, even after adjustment for confounders (Table 2 and Figure 2). The spatial QRS‐T angle and direction of SVG, as well as QTc, were similar in white and black participants (Figures S1 and S2).
Table 2.
Difference in GEH Variables in Black Compared With White Participants
| GEH Characteristic | Model 1 | P Value | Model 2 | P Value |
|---|---|---|---|---|
| Difference (95% CI) | Difference (95% CI) | |||
| Peak QRS‐T angle, ° | 11 (8.6 to 15.0) | <0.0001 | 5.2 (2.2 to 8.3) | 0.001 |
| Area QRS‐T angle, ° | 1.4 (−1.2 to 4.1) | 0.284 | −2.7 (−5.2 to −0.3) | 0.031 |
| Peak SVG elevation, ° | 4.6 (3.1 to 6.0) | <0.0001 | 0.8 (−0.5 to 2.2) | 0.832 |
| Area SVG elevation, ° | 6.1 (4.5 to 7.8) | <0.0001 | 2.3 (0.6 to 3.9) | 0.006 |
| Peak SVG azimuth, ° | 11.0 (5.8 to 15.6) | <0.0001 | 0.3 (−4.5 to 5.0) | 0.907 |
| Area SVG azimuth, ° | 1.8 (−3.1 to 6.7) | 0.475 | −11.3 (−15.9 to −6.6) | <0.0001 |
| SAI QRST, mV*ms | 18.4 (13.7 to 23.0) | <0.0001 | 14.0 (9.8 to 18.0) | <0.0001 |
| Peak SVG magnitude, mV | 0.26 (0.21 to 0.30) | <0.0001 | 0.22 (0.18 to 0.26) | <0.0001 |
| SVG magnitude, mV | 0.30 (0.25 to 0.34) | <0.0001 | 0.28 (0.23 to 0.33) | <0.0001 |
| Cornell voltage, mV | 0.30 (0.25 to 0.35) | <0.0001 | 0.22 (0.18 to 0.27) | <0.0001 |
| QRS duration, ms | −0.4 (−1.6 to 0.7) | 0.440 | −3.3 (−4.4 to −2.2) | <0.0001 |
| QT interval, ms | 2.4 (0.5 to 4.2) | 0.011 | −0.6 (−2.3 to 1.1) | 0.517 |
| Heart rate, bpm | −0.8 (−1.8 to 0.2) | 0.098 | −3.2 (−4.2 to −2.3) | <0.0001 |
Linear regression model 1 was adjusted for age, sex, and study center. Model 2 was additionally adjusted for prevalent heart failure, coronary heart disease, stroke, diabetes mellitus, hypertension, current smoking and alcohol intake, work, sport, and leisure physical activity levels, levels of total cholesterol, high‐density lipoprotein, and triglycerides, body mass index, use of antihypertensive and antiarrhythmic medications, serum concentrations of sodium, potassium, calcium, magnesium, phosphorus, and uric acid, total protein and albumin, blood urea nitrogen, chronic kidney disease stage classified by estimated glomerular filtration rate (calculated using the Chronic Kidney Disease–Epidemiology Collaboration equation), education level, occupation category, income, health insurance, heart rate, QRS, QTc, and Cornell voltage. Bpm indicates beats per minute; °, degrees; GEH, global electrical heterogeneity; SAI QRST, sum absolute QRST integral; SVG, spatial ventricular gradient; QTc, corrected QT.
Figure 2.
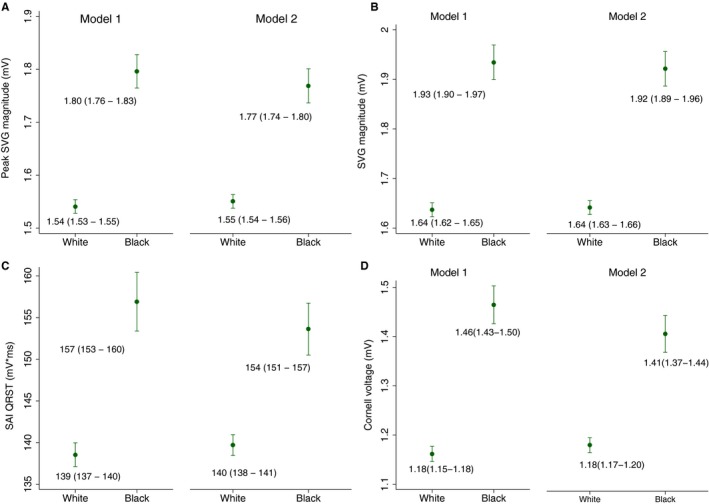
Estimated adjusted marginal (least‐squares) means and 95% CIs of peak spatial ventricular gradient (SVG) magnitude (A), area SVG magnitude (B), sum absolute QRST integral (SAI QRST) (C), and Cornell voltage (D) for white and black participants. Model 1 was adjusted for age, sex, and study center. Model 2 was additionally adjusted for heart failure, coronary heart disease, stroke, diabetes mellitus, hypertension, current smoking and alcohol intake, work, sport, and leisure physical activity levels, levels of total cholesterol, high‐density lipoprotein, and triglycerides, body mass index, use of antihypertensive and antiarrhythmic medications, serum concentrations of sodium, potassium, calcium, magnesium, phosphorus, and uric acid, total protein and albumin, blood urea nitrogen, and chronic kidney disease stage classified by estimated glomerular filtration rate (calculated using the Chronic Kidney Disease–Epidemiology Collaboration equation), heart rate, QRS duration, Bazett‐corrected QT interval, Cornell voltage, education level, occupation category, income, and health insurance.
Over a median follow‐up of 24.4 years, there were 522 SCDs (incidence, 1.74 per 1000 person‐years; 95% CI, 1.59–1.89 per 1000 person‐years) and 2147 non‐SCDs (incidence, 7.14 per 1000 person‐years; 95% CI, 6.85–7.45 per 1000 person‐years). SCD incidence was 2 times higher in black (2.86 per 1000 person‐years; 95% CI, 2.50–3.28 per 1000 person‐years) than white participants (1.37 per 1000 person‐years; 95% CI, 1.22–1.53 per 1000 person‐years). Incidence of non‐SCD was higher in black (9.60 per 1000 person‐years; 95% CI, 8.92–10.33 per 1000 person‐years) than white participants (6.33 per 1000 person‐years; 95% CI, 6.01–6.67 per 1000 person‐years).
Considering hypertension subgroups, the lowest SCD incidence was observed in hypertension‐free white individuals (0.95 per 1000 person‐years; 95% CI, 0.82–1.11 per 1000 person‐years), followed by hypertension‐free black individuals (1.31 per 1000 person‐years; 95% CI, 0.98–1.75 per 1000 person‐years), and then by white individuals with hypertension (2.59 per 1000 person‐years; 95% CI, 2.20–3.04 per 1000 person‐years). Black individuals with hypertension had the highest rate of SCD: 4.26 per 1000 person‐years (95% CI, 3.66–4.96 per 1000 person‐years) (Figure 3).
Figure 3.
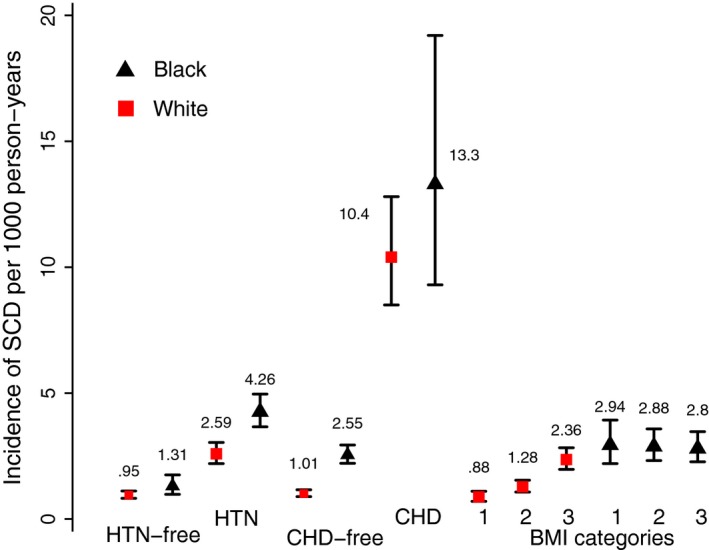
Incidence of sudden cardiac death (SCD) per 1000 person‐years in black (black triangles) and white (red quadrants) participants with and without hypertension (HTN) and coronary heart disease (CHD), and by body mass index (BMI) subgroups. Black lines correspond to 95% CI bounds.
Among CHD subgroups, CHD‐free white participants had the lowest SCD incidence (1.01 per 1000 person‐years; 95% CI, 0.89–1.16 per 1000 person‐years), followed by CHD‐free black participants (2.55 per 1000 person‐years; 95% CI, 2.21–2.94 per 1000 person‐years). SCD incidence was dramatically higher in participants with CHD (both white [10.4 per 1000 person‐years; 95% CI, 8.5–12.8 per 1000 person‐years] and black participants [13.3 per 1000 person‐years; 95% CI, 9.3–19.2 per 1000 person‐years]).
In BMI categories subgroups, normal‐weight white participants had the lowest incidence of SCD (0.88 per 1000 person‐years; 95% CI, 0.70–1.10 per 1000 person‐years), followed by overweight white individuals (1.28 per 1000 person‐years; 95% CI, 1.07–1.54 per 1000 person‐years), and then by obese white individuals (2.36 per 1000 person‐years; 95% CI, 1.97–2.83 per 1000 person‐years). Incidence of SCD in black individuals with any BMI was significantly higher than in white individuals: 2.94 per 1000 person‐years (95% CI, 2.20–3.93 per 1000 person‐years) in normal‐weight individuals, 2.88 per 1000 person‐years (95% CI, 2.32–3.58 per 1000 person‐years) in overweight individuals, and 2.80 per 1000 person‐years (95% CI, 2.27–3.47 per 1000 person‐years) in obese black participants (Figure 3).
Association of Electrophysiological Substrate With SCD in Black and White Participants
All traditional ECG metrics, SVG direction, and SAI QRST were associated with a similar risk of SCD in black and white participants, a finding that was consistent in both Cox regression (Tables S1 and S2) and competing risk models (Tables S3 and S4).
Time‐updated Cox regression model 2 revealed significant interaction with SVG magnitude (Figure 4). However, competing risk analysis found no effect modification by race of SVG magnitude and SCD association (Figure 4 and Table S3). Continuous hazard functions were similar for white and black individuals (Figure S3), suggesting an absence of meaningful effect modification.
Figure 4.
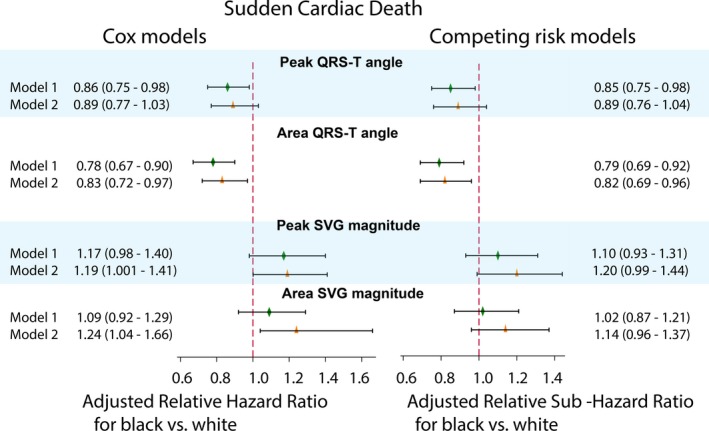
Adjusted Cox proportional relative hazard ratio and competing sudden cardiac death risk relative sub–hazard risk ratio with 95% CI for black compared with white participants, with hazard ratio/sub–hazard ratio for white participants equal 1.0. Models 1 (green diamond) and models 2 (orange triangle) for the QRS‐T angle and spatial ventricular gradient (SVG) magnitude are shown. Black lines correspond to 95% CI bounds. Model 1 was adjusted for age, sex, study center, prevalent heart failure (HF), coronary heart disease (CHD), stroke, diabetes mellitus, hypertension, levels of total cholesterol, high‐density lipoprotein, and triglycerides, body mass index, use of antihypertensive and antiarrhythmic medications, serum concentrations of sodium, potassium, calcium, magnesium, phosphorus, and uric acid, total protein and albumin, blood urea nitrogen, chronic kidney disease stage classified by estimated glomerular filtration rate (calculated using the Chronic Kidney Disease–Epidemiology Collaboration equation), smoking and alcohol intake, work, sport, and leisure physical activity levels, education level, occupation category, income, and health insurance. Time‐updated model 2 included time‐updated ECG predictors (one by one), all baseline covariates included in model 1, and time‐updated incident nonfatal atrial fibrillation, HF, CHD, and stroke.
Race did not modify associations of ECG measures with non‐SCD (Tables S3 and S4).
Race and Hypertension Modify an Association of Spatial QRS‐T Angle With SCD
Race significantly modified an association of spatial QRS‐T angle with SCD, in both Cox regression (Figure 4 and Table S1) and competing risk models (Figure 4 and Table S3). The spatial QRS‐T angle was associated with ≈20% reduced risk of SCD for black participants compared with white participants. Adjustment for incident nonfatal cardiovascular disease in Cox model 2 attenuated the effect modification (Figure 4). In race‐stratified Cox regression (Figure 5 and Table S2) and competing risk models 1 and 2 (Figure 6 and Table S4), spatial QRS‐T angle was associated with SCD in white, but not black, participants (Figure 7).
Figure 5.
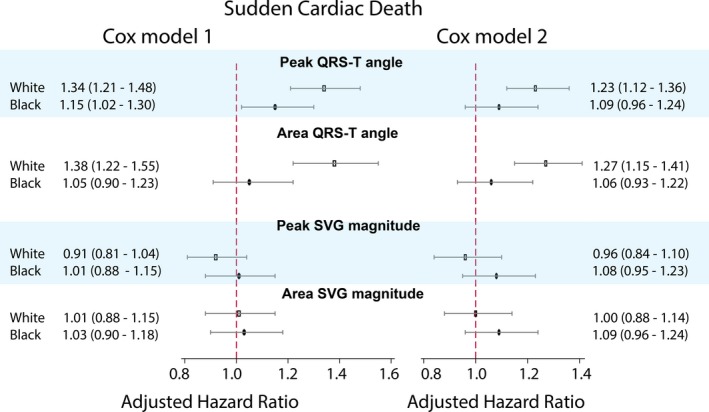
Race‐stratified adjusted (models 1 and 2, as described in Figure 4 legend) Cox proportional hazard ratio and 95% CI of sudden cardiac death for QRS‐T angle and spatial ventricular gradient (SVG) magnitude in white (hollow rectangle) and black (black oval) individuals. Black lines correspond to 95% CI bounds.
Figure 6.
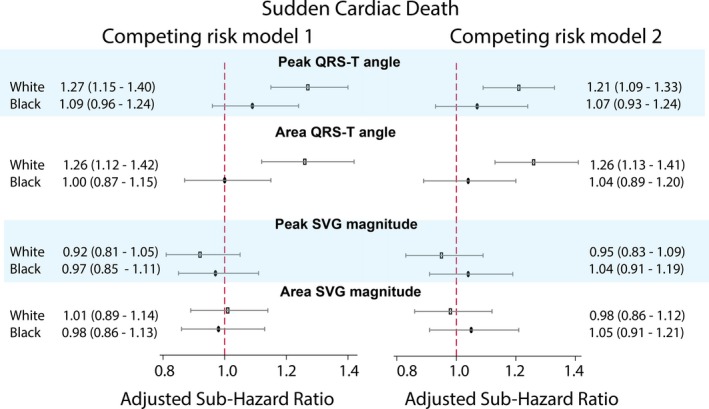
Adjusted (models 1 and 2, as described in Figure 4 legend) competing risk sub–hazard ratio and 95% CI of sudden cardiac death for QRS‐T angle and spatial ventricular gradient (SVG) magnitude in white (hollow rectangle) and black (black oval) individuals. Black lines correspond to 95% CI bounds.
Figure 7.
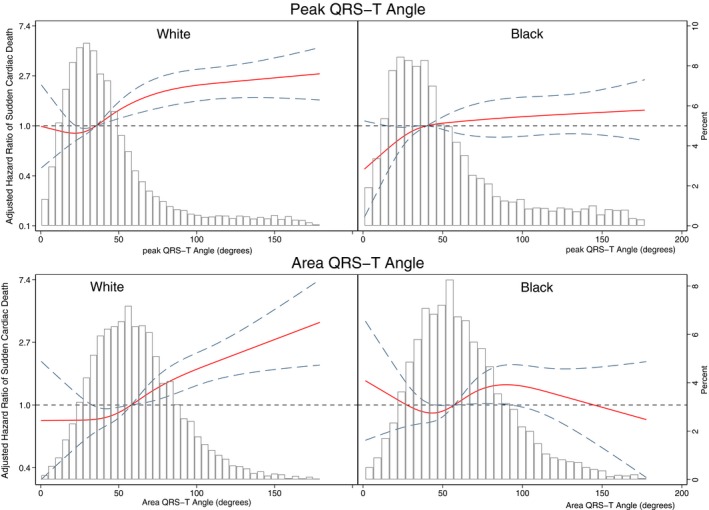
Adjusted (model 1, as described in Figure 4 legend) risk of sudden cardiac death associated with area and peak QRS‐T angle in black and white participants. Restricted cubic spline with 95% CI shows a change in the hazard ratio (y axis) in response to QRS‐T angle change (x axis). The 50th percentile of QRS‐T angle is selected as a reference. Knots of peak QRS‐T angle in white participants are at 10° to 28° to 44° to 118°, and in black participants are at 11° to 31° to 53° to 149°. Knots of area QRS‐T angle in white participants are at 22° to 48° to 69° to 112°, and in black participants are at 21° to 48° to 69° to 118°.
Further analysis of the interaction with both race and hypertension showed that spatial QRS‐T angle was associated with SCD similarly in white and hypertension‐free black participants (Figure 8 and Table S5), but not in black participants with hypertension. Effect modification by race and hypertension remained significant after adjustment for incident cardiovascular events in both Cox regression (Figure 9 and Table S5) and competing risk models (Table S6).
Figure 8.
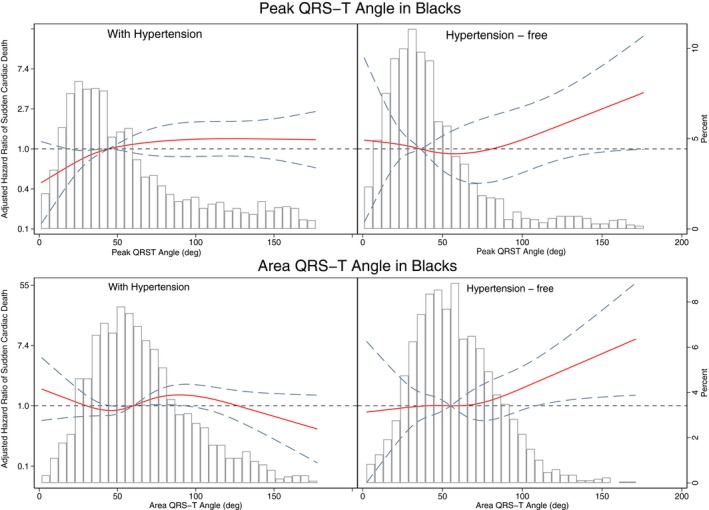
Adjusted (model 1, as described in Figure 4 legend) risk of sudden cardiac death associated with area and peak QRS‐T angle in black participants with and without hypertension. Restricted cubic spline with 95% CI shows a change in the hazard ratio (y axis) in response to QRS‐T angle change (x axis). The 50th percentile of QRS‐T angle is selected as reference. Knots of peak QRS‐T angle are at 10° to 29° to 45° to 120°. Knots of area QRS‐T angle in black participants with hypertension are at 21° to 50° to 72° to 130°, and in hypertension‐free black participants are at 20° to 46° to 66° to 103°.
Figure 9.
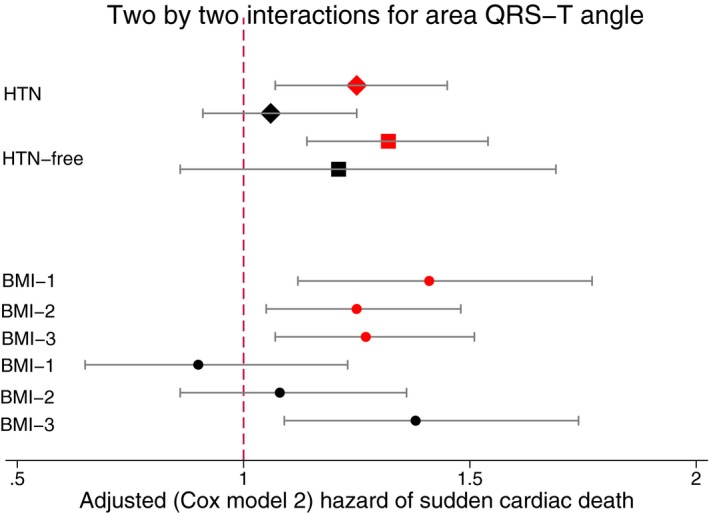
The 2‐by‐2 interactions for area QRS‐T angle. Adjusted (model 2, as described in Figure 4 legend) Cox proportional hazard ratio and 95% CI of sudden cardiac death in white (red) and black (black) individuals with (diamonds) and without (quadrants) hypertension (HTN). Circles indicate body mass index (BMI) subgroups. Black lines correspond to 95% CI bounds.
Two‐Way Interaction With Race and Prevalent CHD
In Cox and competing risk models 1, SAI QRST had a stronger association with SCD in white participants with CHD, compared with CHD‐free white participants (Tables S5 and S6). In contrast, in black CHD participants, SAI QRST was associated with less SCD risk (Figure 10), but greater incidence of non‐SCD (relative sub–hazard ratio, 1.29; 95% CI, 1.13–1.47; P<0.0001 in competing non‐SCD risk model 2). As expected, after adjustment for incident cardiovascular events, there was no significant 2‐way interaction with race‐CHD category in association of ECG measures with SCD (Tables S5 and S6).
Figure 10.
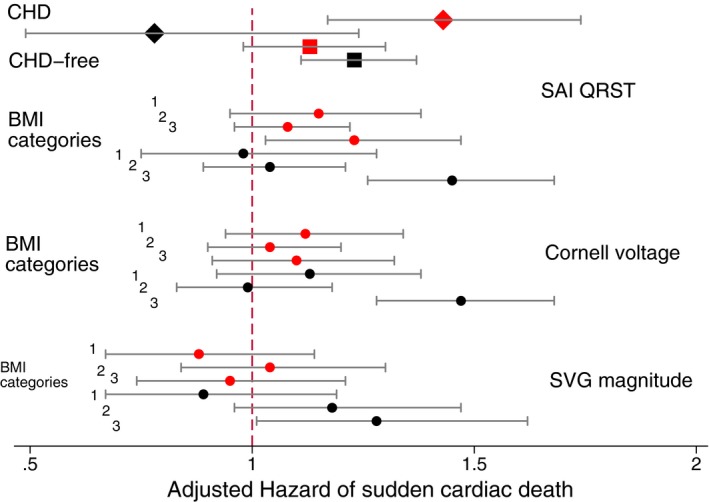
The 2‐by‐2 interactions for voltage‐based ECG metrics (sum absolute QRST integral [SAI QRST], peak spatial ventricular gradient [SVG] magnitude, and Cornell voltage). Adjusted Cox proportional hazard ratio and 95% CI of sudden cardiac death in white (red) and black (black) individuals with (diamonds) and without (quadrants) coronary heart disease (CHD) (Cox model 1). Circles indicate body mass index (BMI) subgroups (Cox model 2). Black lines correspond to 95% CI bounds. Models as described in Figure 4 legend.
Race and BMI Modify Associations of Spatial QRS‐T Angle and SVG Magnitude With SCD
Analysis of the interaction with both race and BMI showed that spatial QRS‐T angle was associated with SCD similarly in white and obese black participants, but not in normal‐weight or overweight black participants, as shown in both Cox regression and competing risk analyses (Figure 9 and Tables S5 through S8).
After adjustment for incident cardiovascular events, all global voltage‐based ECG metrics (SVG magnitude, Cornell voltage, and SAI QRST) had a significantly stronger association with SCD in obese black participants, compared with normal‐weight white participants (Figure 10 and Tables S5 through S8).
Discussion
This large, prospective, community‐based cohort study of >14 000 participants showed several important findings. Apart from the QRS‐T angle, the association of electrophysiological substrate with SCD was similar in black and white individuals. In this study, race did not modify an association of electrophysiological substrate with SCD, supporting the recognition of race as a product of social practices, but not an inherent characteristic of individuals. Similar strength of the association of global ECG metrics with SCD in black and white individuals implies that electrophysiological substrate does not explain racial disparities in SCD rate.
Furthermore, we observed that black individuals with hypertension experienced 4.5‐fold higher SCD incidence than hypertension‐free white individuals. Black race in the presence of hypertension is associated with high SCD risk regardless of QRS‐T angle, which explains the weaker association of QRS‐T angle with SCD in black than white individuals. However, relative risk of SCD carried by QRS‐T angle did not differ in hypertension‐free black or white individuals with or without hypertension. We also observed that black individuals had larger amplitude‐based ECG metrics (SAI QRST, SVG magnitude, and Cornell voltage) compared with white individuals. The difference of ≈0.3 mV was robustly observed, even after accounting for socioeconomic status and other confounders. This finding is consistent with previous studies6, 7 and supports use of race‐specific thresholds for abnormal SAI QRST,13 SVG magnitudes,13 and ECG LVH.8, 10 Moreover, we showed that SAI QRST, SVG magnitude, and Cornell voltage convey higher risk of SCD in obese black individuals, compared with normal‐weight white individuals, by 20% to 50%. Prevention of obesity in black individuals with increased SVG magnitude, SAI QRST, or Cornell voltage can be potentially lifesaving. A randomized clinical trial is warranted to test this hypothesis.
Race Does Not Modify an Association of Electrophysiological Substrate With SCD
Our study found that all traditional ECG metrics (QTc, QRS duration, and Cornell voltage), SVG direction, and SAI QRST were associated with a similar risk of SCD among black and white individuals. There is little existing literature studying the association of ECG metrics and the risk of SCD by race, and this study provides new insight into racial differences and similarities. In our prior study on sex differences,39 we found that Cornell voltage, SVG magnitude, and SAI QRST are associated with a 16% to 24% greater risk of SCD in women compared with men. Sex is biologically determined and therefore may cause differences in electrophysiological substrate in contrast to race, which is a complex social construct.
There has been growing recognition of the Critical Race Theory,20 which aims to better account for the effects of institutionalized racism on health. The results of our study support the Critical Race Theory postulate. Many previous studies recognized race as an independent and strong risk factor of SCD, even after adjusting for socioeconomic factors but attributed it, at least partially, to underlying biological differences between black and white individuals.1, 2, 4 In contrast, our comprehensive study of electrophysiological substrate did not find meaningful effect modification by race. Results of our study call attention to structural racism as an important determinant of the increased SCD rate in black compared with white individuals.40
Several studies investigated the effects of racism on physical health. These studies showed that self‐reported daily discrimination and stress was associated with increased waist circumference, increased waist/hip ratio, and higher fasting glucose level.41, 42, 43 Not only does daily stress increase potential risk factors for SCD, but long‐term negative emotions also increase vulnerability to life‐threatening arrhythmias44 and can potentially contribute to racial disparities in SCD. Consistent with previous studies, we observed 2‐by‐2 interaction with race and BMI. Disproportionally high risk of SCD was associated with all voltage‐based ECG metrics (Cornell voltage, SAI QRST, and SVG magnitude) in black obese (but not in black overweight or normal‐weight) individuals.
When thinking about race and potential biological differences determining health, it is important to consider that race is not equivalent to genetic ancestry, but as mentioned above is a social construct. In our study, participants self‐identified as black or white, but no ancestry information was analyzed. Ancestry analyses of the self‐reported racial and ethnic identity in the United States have shown that self‐identified black individuals carry up to 24% of European ancestry, and ≈1 in 10 self‐identified white individuals in the US South have at least 1% of African ancestry.45 Association of genetic ancestry with electrophysiological substrate of SCD4 deserves separate investigation.
Race‐Specific Thresholds of ECG Voltage Measurements and Excess of SCD Risk in Obese Black Individuals
Racial differences in ECG voltage and ECG LVH definition have been previously reported.6, 7, 8 This study showed consistent results: voltage‐based ECG metrics (SVG magnitude, SAI QRST, and Cornell voltage) were larger in black than white individuals, by 0.2 to 0.3 mV. Comprehensive adjustment for cardiovascular risk factors in this study did not affect the racial differences in SVG magnitude, SAI QRST, and Cornell voltage. Similarly, the DHS (Dallas Heart Study) reported46 that after adjustment for cardiovascular risk factors and body composition, both black race and African ancestry were associated with ≈0.25‐mV larger ECG voltage. A recent genome‐wide association study of GEH revealed 10 GEH‐associated loci.47 Four loci (11p11.2 cluster, near ACTB, LUZP1‐KDM1A, and IGF1R) were associated with increase in both SAI QRST and SVG magnitude. SAI QRST–associated locus near LUZP1‐KDM1A has higher effect allele frequency47 in African ancestry (0.92) compared with European ancestry (0.59), which can potentially contribute to larger SAI QRST in a black population. Further studies are needed to test these hypotheses.
More important, we showed that all ECG voltage‐based metrics carry excess SCD risk in obese black individuals. Prevention of obesity in black individuals with increased SVG magnitude, SAI QRST, or Cornell voltage can be potentially lifesaving, and should be investigated in randomized clinical trials. Furthermore, development of race‐specific SCD risk stratification is needed, to incorporate race‐specific thresholds of ECG voltage‐based metrics and observed heterogeneity of response.
Two‐Way Interaction of SAI QRST With Race and Prevalent CHD
Previous studies showed that in the predominantly white population of patients with HF, larger SAI QRST was associated with increased risk of ventricular tachyarrhythmias,48 whereas in a mixed population that included black patients with HF, smaller SAI QRST was associated with increased risk of sustained ventricular tachyarrhythmias.49, 50 Results of this study confirmed 2‐by‐2 interaction of SAI QRST with race and prevalent CHD, showing opposite directions of associations of SAI QRST with SCD in black and white participants with CHD. In white patients with CHD, large SAI QRST conveys increased SCD risk, whereas in black patients with CHD, large SAI QRST indicates risk of competing nonsudden cardiovascular death, rather than SCD. In black individuals, CHD is likely diagnosed later, at more advanced stages, and treated less effectively, compared with white individuals, which can explain observed competing risk differences.
Strengths and Limitations
The strengths of our study included the sizable community‐dwelling cohort, the extended follow‐up, and the rigorous adjudication of SCD. We were also able to adjust for time‐varying ECG measurements and incident nonfatal cardiovascular events and conduct competing risk analyses. However, our study has limitations, as previously acknowledged.13 Although efforts were made to differentiate SCD from non‐SCD, it is possible than some SCD events were secondary to sudden noncardiac catastrophe as opposed to ventricular arrhythmias. However, these events likely compromise a small fraction of SCD events and therefore should not significantly affect study results. This study did not include resuscitated out‐of‐hospital cardiac arrest because of difficulty accurately differentiating its cause. Another important consideration is the inclusion of only black and white individuals, which limits generalizability to multiethnic populations. Further studies in other races and ethnicities are needed to validate our findings. The results of 2‐way interaction analyses should be interpreted with caution. As in any observational study, residual confounding is a limitation of the study.
Sources of Funding
The ARIC (Atherosclerosis Risk in Communities) study has been funded in whole or in part with federal funds from the National Heart, Lung, and Blood Institute, National Institutes of Health, Department of Health and Human Services, under contracts HHSN268201700001I, HHSN268201700002I, HHSN268201700003I, HHSN268201700004I, and HHSN268201700005I. This work was supported by HL118277 (Dr Tereshchenko) and Oregon Health & Science University (OHSU) President Bridge funding (Dr Tereshchenko).
Disclosures
None.
Supporting information
Table S1. Race Interaction in Association of Global ECG Measures With SCD in Cox Models
Table S2. Association of GEH With SCD in Cox Models for White and Black
Table S3. Race Interaction in Association of GEH With SCD and NonSCD in Competing Risk Models
Table S4. Competing Risks of Sudden Cardiac Death and Non‐Sudden Cardiovascular Death for White and Black
Table S5. Two‐Way Interactions in Association of Global ECG Measures With SCD in Cox Models: Race‐Hypertension; Race‐Coronary Heart Disease, and Race‐BMI Category
Table S6. Two‐Way Interactions in Association of Global ECG Measures With SCD in Competing Risk Models: Race‐Hypertension; Race‐Coronary Heart Disease, and Race‐BMI Category
Table S7. Stratified Association of Global ECG Measures With SCD in Cox Models: Race‐Hypertension; Race‐Coronary Heart Disease, and Race‐BMI Category Subgroups
Table S8. Competing Risk of Sudden Cardiac Death in Race‐Hypertension, Race‐Coronary Heart Disease, and Race‐BMI Category Subgroups.
Figure S1. Estimated adjusted marginal (least‐squares) means and 95% CI of (A) peak QRS‐T angle, (B) area QRS‐T angle, (C) peak SVG azimuth, and (D) area SVG azimuth for white and black participants.
Figure S2. Estimated adjusted marginal (least‐squares) means and 95% CI of (A) peak SVG elevation, (B) heart rate, (C) QRS duration, and (D) QTc for white and black participants.
Figure S3. Adjusted (model 1) risk of SCD associated with an area and peak SVG magnitude in black and white participants. Restricted cubic spline with 95% CI shows change in hazard ratio (y‐axis) in response to SVG magnitude change (x‐axis). 50th percentile of SVG magnitude is selected as reference. Knots of area SVG magnitude in black participants are at 1.2 to 1.7 to 2.1 to 2.9 mV, and in white participants are at 1.0 to 1.4 to 1.8 to 2.4 mV. Knots of peak SVG magnitude in black participants are at 1.1 to 1.6 to 2.0 to 2.6 mV, and in white participants are at 0.9 to 1.4 to 1.7 to 2.2 mV.
Acknowledgments
The authors thank the staff and participants of the ARIC (Atherosclerosis Risk in Communities) study for their important contributions. We would like to acknowledge the sudden cardiac death mortality classification committee members: Nona Sotoodehnia (lead), Selcuk Adabag, Sunil Agarwal, Lin Chen, Rajat Deo, Leonard Ilkhanoff, Liviu Klein, Saman Nazarian, Ashleigh Owen, Kris Patton, and Larisa Tereshchenko.
(J Am Heart Assoc. 2020;9:e015012 DOI: 10.1161/JAHA.119.015012.)
References
- 1. Zhao D, Post WS, Blasco‐Colmenares E, Cheng A, Zhang Y, Deo R, Pastor‐Barriuso R, Michos ED, Sotoodehnia N, Guallar E. Racial differences in sudden cardiac death. Circulation. 2019;139:1688–1697. [DOI] [PMC free article] [PubMed] [Google Scholar]
- 2. Deo R, Safford MM, Khodneva YA, Jannat‐Khah DP, Brown TM, Judd SE, McClellan WM, Rhodes JD, Shlipak MG, Soliman EZ, Albert CM. Differences in risk of sudden cardiac death between blacks and whites. J Am Coll Cardiol. 2018;72:2431–2439. [DOI] [PMC free article] [PubMed] [Google Scholar]
- 3. Tseng ZH, Olgin JE, Vittinghoff E, Ursell PC, Kim AS, Sporer K, Yeh C, Colburn B, Clark NM, Khan R, Hart AP, Moffatt E. Prospective countywide surveillance and autopsy characterization of sudden cardiac death: POST SCD study. Circulation. 2018;137:2689–2700. [DOI] [PMC free article] [PubMed] [Google Scholar]
- 4. Fender EA, Henrikson CA, Tereshchenko L. Racial differences in sudden cardiac death. J Electrocardiol. 2014;47:815–818. [DOI] [PMC free article] [PubMed] [Google Scholar]
- 5. Tereshchenko LG. Electrocardiogram as a screening tool in the general population: a strategic review. J Electrocardiol. 2013;46:553–556. [DOI] [PubMed] [Google Scholar]
- 6. Rautaharju PM, Zhou SH, Calhoun HP. Ethnic differences in ECG amplitudes in North American white, black, and Hispanic men and women: effect of obesity and age. J Electrocardiol. 1994;27(suppl):20–31. [DOI] [PubMed] [Google Scholar]
- 7. Vitelli LL, Crow RS, Shahar E, Hutchinson RG, Rautaharju PM, Folsom AR; Atherosclerosis Risk in Communities (ARIC) Study Investigators . Electrocardiographic findings in a healthy biracial population. Am J Cardiol. 1998;81:453–459. [DOI] [PubMed] [Google Scholar]
- 8. Rautaharju PM, Park LP, Gottdiener JS, Siscovick D, Boineau R, Smith V, Powe NR. Race‐ and sex‐specific ECG models for left ventricular mass in older populations: factors influencing overestimation of left ventricular hypertrophy prevalence by ECG criteria in African‐Americans. J Electrocardiol. 2000;33:205–218. [DOI] [PubMed] [Google Scholar]
- 9. Waase MP, Mutharasan RK, Whang W, DiTullio MR, DiFiori JP, Callahan L, Mancell J, Phelan D, Schwartz A, Homma S, Engel DJ. Electrocardiographic findings in national basketball association athletes. JAMA Cardiol. 2018;3:69–74. [DOI] [PMC free article] [PubMed] [Google Scholar]
- 10. Okin PM, Wright JT, Nieminen MS, Jern S, Taylor AL, Phillips R, Papademetriou V, Clark LT, Ofili EO, Randall OS, Oikarinen L, Viitasalo M, Toivonen L, Julius S, Dahlof B, Devereux RB. Ethnic differences in electrocardiographic criteria for left ventricular hypertrophy: the LIFE study: Losartan Intervention For Endpoint. Am J Hypertens. 2002;15:663–671. [DOI] [PubMed] [Google Scholar]
- 11. Tereshchenko LG. Global electrical heterogeneity: mechanisms and clinical significance. Comput Cardiol Conf (CinC). 2018;45:e165. [DOI] [PMC free article] [PubMed] [Google Scholar]
- 12. Waks JW, Tereshchenko LG. Global electrical heterogeneity: a review of the spatial ventricular gradient. J Electrocardiol. 2016;49:824–830. [DOI] [PMC free article] [PubMed] [Google Scholar]
- 13. Waks JW, Sitlani CM, Soliman EZ, Kabir M, Ghafoori E, Biggs ML, Henrikson CA, Sotoodehnia N, Biering‐Sorensen T, Agarwal SK, Siscovick DS, Post WS, Solomon SD, Buxton AE, Josephson ME, Tereshchenko LG. Global electric heterogeneity risk score for prediction of sudden cardiac death in the general population: the Atherosclerosis Risk in Communities (ARIC) and Cardiovascular Health (CHS) studies. Circulation. 2016;133:2222–2234. [DOI] [PMC free article] [PubMed] [Google Scholar]
- 14. Burger HC. A theoretical elucidation of the notion ventricular gradient. Am Heart J. 1957;53:240–246. [DOI] [PubMed] [Google Scholar]
- 15. Wilson FN, Macleod AG, Barker PS, Johnston FD. The determination and the significance of the areas of the ventricular deflections of the electrocardiogram. Am Heart J. 1934;10:46–61. [Google Scholar]
- 16. Wilson FN, MacLeod AG, Barker PS. The T deflection of the electrocardiogram. Trans Assoc Am Physicians. 1931;46:29–38. [Google Scholar]
- 17. Plonsey R. A contemporary view of the ventricular gradient of Wilson. J Electrocardiol. 1979;12:337–341. [DOI] [PubMed] [Google Scholar]
- 18. Geselowitz DB. The ventricular gradient revisited: relation to the area under the action potential. IEEE Trans Biomed Eng. 1983;30:76–77. [DOI] [PubMed] [Google Scholar]
- 19. Ford CL, Airhihenbuwa CO. Commentary: just what is critical race theory and what's it doing in a progressive field like public health? Ethn Dis. 2018;28:223–230. [DOI] [PMC free article] [PubMed] [Google Scholar]
- 20. Bridges KM, Keel T, Obasogie OK. Introduction: critical race theory and the health sciences. Am J Law Med. 2017;43:179–182. [DOI] [PubMed] [Google Scholar]
- 21. Coady SA, Mensah GA, Wagner EL, Goldfarb ME, Hitchcock DM, Giffen CA. Use of the National Heart, Lung, and Blood Institute Data Repository. N Engl J Med. 2017;376:1849–1858. [DOI] [PMC free article] [PubMed] [Google Scholar]
- 22. Tryka KA, Hao L, Sturcke A, Jin Y, Wang ZY, Ziyabari L, Lee M, Popova N, Sharopova N, Kimura M, Feolo M. NCBI's database of genotypes and phenotypes: dbGaP. Nucleic Acids Res. 2014;42:D975–D979. [DOI] [PMC free article] [PubMed] [Google Scholar]
- 23. investigators . The Atherosclerosis Risk in Communities (ARIC) Study: design and objectives. Am J Epidemiol. 1989;129:687–702. [PubMed] [Google Scholar]
- 24. Perez‐Alday EA, Bender A, German D, Mukundan SV, Hamilton C, Thomas JA, Li‐Pershing Y, Tereshchenko LG. Dynamic predictive accuracy of electrocardiographic biomarkers of sudden cardiac death within a survival framework: the Atherosclerosis Risk in Communities (ARIC) study. BMC Cardiovasc Disord. 2019;19:255. [DOI] [PMC free article] [PubMed] [Google Scholar]
- 25. Thomas JA, A Perez‐Alday E, Junell A, Newton K, Hamilton C, Li‐Pershing Y, German D, Bender A, Tereshchenko LG. Vectorcardiogram in athletes: the Sun Valley Ski Study. Ann Noninvasive Electrocardiol. 2019;24:e12614. [DOI] [PMC free article] [PubMed] [Google Scholar]
- 26. Perez‐Alday EA, Li‐Pershing Y, Bender A, Hamilton C, Thomas JA, Johnson K, Lee TL, Gonzales R, Li A, Newton K, Tereshchenko LG. Importance of the heart vector origin point definition for an ECG analysis: the Atherosclerosis Risk in Communities (ARIC) study. Comput Biol Med. 2019;104:127–138. [DOI] [PMC free article] [PubMed] [Google Scholar]
- 27. White AD, Folsom AR, Chambless LE, Sharret AR, Yang K, Conwill D, Higgins M, Williams OD, Tyroler HA. Community surveillance of coronary heart disease in the Atherosclerosis Risk in Communities (ARIC) Study: methods and initial two years’ experience. J Clin Epidemiol. 1996;49:223–233. [DOI] [PubMed] [Google Scholar]
- 28. Luepker RV, Apple FS, Christenson RH, Crow RS, Fortmann SP, Goff D, Goldberg RJ, Hand MM, Jaffe AS, Julian DG, Levy D, Manolio T, Mendis S, Mensah G, Pajak A, Prineas RJ, Reddy KS, Roger VL, Rosamond WD, Shahar E, Sharrett AR, Sorlie P, Tunstall‐Pedoe H. Case definitions for acute coronary heart disease in epidemiology and clinical research studies: a statement from the AHA Council on Epidemiology and Prevention; AHA Statistics Committee; World Heart Federation Council on Epidemiology and Prevention; the European Society of Cardiology Working Group on Epidemiology and Prevention; Centers for Disease Control and Prevention; and the National Heart, Lung, and Blood Institute. Circulation. 2003;108:2543–2549. [DOI] [PubMed] [Google Scholar]
- 29. Eriksson H, Caidahl K, Larsson B, Ohlson LO, Welin L, Wilhelmsen L, Svardsudd K. Cardiac and pulmonary causes of dyspnoea–validation of a scoring test for clinical‐epidemiological use: the Study of Men Born in 1913. Eur Heart J. 1987;8:1007–1014. [DOI] [PubMed] [Google Scholar]
- 30. Loehr LR, Rosamond WD, Chang PP, Folsom AR, Chambless LE. Heart failure incidence and survival (from the Atherosclerosis Risk in Communities study). Am J Cardiol. 2008;101:1016–1022. [DOI] [PubMed] [Google Scholar]
- 31. Matsushita K, Selvin E, Bash LD, Astor BC, Coresh J. Risk implications of the new CKD Epidemiology Collaboration (CKD‐EPI) equation compared with the MDRD Study equation for estimated GFR: the Atherosclerosis Risk in Communities (ARIC) Study. Am J Kidney Dis. 2010;55:648–659. [DOI] [PMC free article] [PubMed] [Google Scholar]
- 32. Toole JF, Chambless LE, Heiss G, Tyroler HA, Paton CC. Prevalence of stroke and transient ischemic attacks in the Atherosclerosis Risk in Communities (ARIC) study. Ann Epidemiol. 1993;3:500–503. [DOI] [PubMed] [Google Scholar]
- 33. Blackburn H, Keys A, Simonson E, Rautaharju P, Punsar S. The electrocardiogram in population studies: a classification system. Circulation. 1960;21:1160–1175. [DOI] [PubMed] [Google Scholar]
- 34. Richardson MT, Ainsworth BE, Wu HC, Jacobs DR Jr, Leon AS. Ability of the Atherosclerosis Risk in Communities (ARIC)/Baecke Questionnaire to assess leisure‐time physical activity. Int J Epidemiol. 1995;24:685–693. [DOI] [PubMed] [Google Scholar]
- 35. Alonso A, Agarwal SK, Soliman EZ, Ambrose M, Chamberlain AM, Prineas RJ, Folsom AR. Incidence of atrial fibrillation in whites and African‐Americans: the Atherosclerosis Risk in Communities (ARIC) study. Am Heart J. 2009;158:111–117. [DOI] [PMC free article] [PubMed] [Google Scholar]
- 36. Rosamond WD, Folsom AR, Chambless LE, Wang CH, McGovern PG, Howard G, Copper LS, Shahar E. Stroke incidence and survival among middle‐aged adults: 9‐year follow‐up of the Atherosclerosis Risk in Communities (ARIC) cohort. Stroke. 1999;30:736–743. [DOI] [PubMed] [Google Scholar]
- 37. Cox NJ. Speaking Stata: in praise of trigonometric predictors. Stata J. 2006;6:561–579. [Google Scholar]
- 38. Fine JP, Gray RJ. A proportional hazards model for the subdistribution of a competing risk. J Am Stat Assoc. 1999;94:496–509. [Google Scholar]
- 39. Howell SJ, German D, Bender A, Phan F, Mukundan SV, Perez‐Alday EA, Rogovoy NM, Haq K, Yang K, Wirth A, Jensen K, Tereshchenko LG. Does sex modify an association of electrophysiological substrate with sudden cardiac death? The Atherosclerosis Risk In Communities (ARIC) study. bioRxiv. 2019;674689 DOI: 10.1101/674689. [DOI] [PMC free article] [PubMed] [Google Scholar]
- 40. Galea S, Blaney S, Nandi A, Silverman R, Vlahov D, Foltin G, Kusick M, Tunik M, Richmond N. Explaining racial disparities in incidence of and survival from out‐of‐hospital cardiac arrest. Am J Epidemiol. 2007;166:534–543. [DOI] [PubMed] [Google Scholar]
- 41. Hunte HE. Association between perceived interpersonal everyday discrimination and waist circumference over a 9‐year period in the Midlife Development in the United States cohort study. Am J Epidemiol. 2011;173:1232–1239. [DOI] [PMC free article] [PubMed] [Google Scholar]
- 42. Vines AI, Baird DD, Stevens J, Hertz‐Picciotto I, Light KC, McNeilly M. Associations of abdominal fat with perceived racism and passive emotional responses to racism in African American women. Am J Public Health. 2007;97:526–530. [DOI] [PMC free article] [PubMed] [Google Scholar]
- 43. Butler C, Tull ES, Chambers EC, Taylor J. Internalized racism, body fat distribution, and abnormal fasting glucose among African‐Caribbean women in Dominica, West Indies. J Natl Med Assoc. 2002;94:143–148. [PMC free article] [PubMed] [Google Scholar]
- 44. Lampert R. Mental stress and ventricular arrhythmias. Curr Cardiol Rep. 2016;18:118. [DOI] [PubMed] [Google Scholar]
- 45. Bryc K, Durand EY, Macpherson JM, Reich D, Mountain JL. The genetic ancestry of African Americans, Latinos, and European Americans across the United States. Am J Hum Genet. 2015;96:37–53. [DOI] [PMC free article] [PubMed] [Google Scholar]
- 46. Alame AJ, Garg S, Kozlitina J, Ayers C, Peshock RM, Matulevicius SA, Drazner MH. Association of African ancestry with electrocardiographic voltage and concentric left ventricular hypertrophy: the dallas heart study. JAMA Cardiol. 2018;3:1167–1173. [DOI] [PMC free article] [PubMed] [Google Scholar]
- 47. Tereshchenko LG, Sotoodehnia N, Sitlani CM, Ashar FN, Kabir M, Biggs ML, Morley MP, Waks JW, Soliman EZ, Buxton AE, Biering‐Sorensen T, Solomon SD, Post WS, Cappola TP, Siscovick DS, Arking DE. Genome‐wide associations of global electrical heterogeneity ECG phenotype: the ARIC (Atherosclerosis Risk in Communities) study and CHS (Cardiovascular Health Study). J Am Heart Assoc. 2018;7:e008160 DOI: 10.1161/JAHA.117.008160. [DOI] [PMC free article] [PubMed] [Google Scholar]
- 48. Tereshchenko LG, McNitt S, Han L, Berger RD, Zareba W. ECG marker of adverse electrical remodeling post‐myocardial infarction predicts outcomes in MADIT II study. PLoS One. 2012;7:e51812. [DOI] [PMC free article] [PubMed] [Google Scholar]
- 49. Tereshchenko LG, Cheng A, Fetics BJ, Marine JE, Spragg DD, Sinha S, Calkins H, Tomaselli GF, Berger RD. Ventricular arrhythmia is predicted by sum absolute QRST integral but not by QRS width. J Electrocardiol. 2010;43:548–552. [DOI] [PMC free article] [PubMed] [Google Scholar]
- 50. Tereshchenko LG, Cheng AA, Fetics BJ, Butcher B, Marine JE, Spragg DD, Sinha S, Dalal D, Calkins H, Tomaselli GF, Berger RD. A new electrocardiogram marker to identify patients at low risk for ventricular tachyarrhythmias: sum magnitude of the absolute QRST integral. J Electrocardiol. 2011;44:208–216. [DOI] [PMC free article] [PubMed] [Google Scholar]
Associated Data
This section collects any data citations, data availability statements, or supplementary materials included in this article.
Supplementary Materials
Table S1. Race Interaction in Association of Global ECG Measures With SCD in Cox Models
Table S2. Association of GEH With SCD in Cox Models for White and Black
Table S3. Race Interaction in Association of GEH With SCD and NonSCD in Competing Risk Models
Table S4. Competing Risks of Sudden Cardiac Death and Non‐Sudden Cardiovascular Death for White and Black
Table S5. Two‐Way Interactions in Association of Global ECG Measures With SCD in Cox Models: Race‐Hypertension; Race‐Coronary Heart Disease, and Race‐BMI Category
Table S6. Two‐Way Interactions in Association of Global ECG Measures With SCD in Competing Risk Models: Race‐Hypertension; Race‐Coronary Heart Disease, and Race‐BMI Category
Table S7. Stratified Association of Global ECG Measures With SCD in Cox Models: Race‐Hypertension; Race‐Coronary Heart Disease, and Race‐BMI Category Subgroups
Table S8. Competing Risk of Sudden Cardiac Death in Race‐Hypertension, Race‐Coronary Heart Disease, and Race‐BMI Category Subgroups.
Figure S1. Estimated adjusted marginal (least‐squares) means and 95% CI of (A) peak QRS‐T angle, (B) area QRS‐T angle, (C) peak SVG azimuth, and (D) area SVG azimuth for white and black participants.
Figure S2. Estimated adjusted marginal (least‐squares) means and 95% CI of (A) peak SVG elevation, (B) heart rate, (C) QRS duration, and (D) QTc for white and black participants.
Figure S3. Adjusted (model 1) risk of SCD associated with an area and peak SVG magnitude in black and white participants. Restricted cubic spline with 95% CI shows change in hazard ratio (y‐axis) in response to SVG magnitude change (x‐axis). 50th percentile of SVG magnitude is selected as reference. Knots of area SVG magnitude in black participants are at 1.2 to 1.7 to 2.1 to 2.9 mV, and in white participants are at 1.0 to 1.4 to 1.8 to 2.4 mV. Knots of peak SVG magnitude in black participants are at 1.1 to 1.6 to 2.0 to 2.6 mV, and in white participants are at 0.9 to 1.4 to 1.7 to 2.2 mV.


