Abstract
Terbinafine hydrochloride (THCl) has a broad-spectrum antifungal activity. THCl has oral bioavailability 40%, which increases dosing frequency of the drug, thus leads to some systemic side effects. Sustained release THCl nanosponges hydrogel was fabricated to deliver the drug topically. Pure THCl (drug), polyvinyl alcohol (emulsifier), and ethyl cellulose (EC, polymer to produce nanosponges) were used. THCl nanosponges were produced successfully by the emulsion solvent evaporation method. Based on a 32 full factorial design, different THCl: EC ratios and stirring rates were used as independent variables. The optimized formula selected based on the particle size and entrapment efficiency % (EE) was formulated as topical hydrogel. All formulations were found in the nanosize range except F7and F9. EE was ranged from 33.05% to 90.10%. THCl nanosponges hydrogel released more than 90% of drug after 8 h and showed the highest in vivo skin deposition and antifungal activity. The increase in drug: EC ratio was observed to increase EE and the particle size while higher stirring rate resulted in finer emulsion globules and significant reduction in EE. The drug release profile was slow from dosage form when it was incorporated in entrapped form as nanosponges rather than unentrapped one. The nanosponges hydrogel succeeded to sustain THCl release over 8 h. It showed the highest antifungal activity and skin deposition. THCl nanosponges hydrogel represents an enhanced therapeutic approach for the topical treatment of fungal infection.
Key words: Emulsion-solvent evaporation, hydrogel, polymer, skin deposition, sustained release
INTRODUCTION
The requirements of nanotechnology are very essential as traditional formulations encounter a lot of issues such as huge side effects, nonaccurate targeting, and problems in solubility and stability. Nanosponges are porous solid particles. It can accommodate various pH, mild heating, and ecocomposite solvent.[1]
THCl is an allylamine with a broad-spectrum antifungal activity. It causes fungal cell death by inhibiting the ergosterol synthesis. Oral THCl causes severe side effects such as hepatotoxicity, anorexia, vomiting, and fatigue.[2] The present research effort was to avoid terbinafine THCl systemic side effects.
MATERIALS AND METHODS
Materials
Pure terbinafine hydrochloride (THCl) was purchased from Global Napi Pharmaceuticals, Egypt. Dichloromethane (DCM), polyvinyl alcohol (PVA), ethyl cellulose (EC), and dimethyl sulfoxide (DMSO) were purchased from Sigma Aldrich, USA. Carbopol® 934 was received as a gift from Memphis Co., Egypt. Triethanolamine was purchased from ADWIC, Egypt.
Animals
The Ethics Committee of Pharmacy Faculty, MSA University, approved the study protocol (ethical code: PT 2/EC2/2018 PD). Forty-five female Wistar rats weighing 150–200 g were used. They were acclimatized at October University for Modern Sciences and Arts Animals' House. under normal conditions and were fed with standard diet ad libitum.
Experimental design
A 32 full factorial design was used for the estimation of the drug: EC ratio (X1) and the stirring rate (X2) effects, as independent variables on two dependent variables, the particle size of the nanosponges (Y1) as well as entrapment efficiency (EE) (Y2) of all prepared possible combinations. Drug: EC ratios (w/w) and stirring rate (rpm) were optimized using a design of experiment® 7.0 at three different levels: low (−1), medium (0), and high (+1) [Table 1].
Table 1.
32 full factorial design levels and factors
| Independent variables | Levels |
||
|---|---|---|---|
| −1 | 0 | 1 | |
| X1 (THCl: EC ratio, w/w) | 1:1 | 1:2 | 1:3 |
| X2 (stirring rate, rpm) | 2000 | 4000 | 6000 |
THCl: Terbinafine hydrochloride, EC: Ethyl cellulose
Preparation method
Terbinafine hydrochloride nanosponges preparation
THCl nanosponges were prepared by the emulsion solvent diffusion method. THCl and EC were dissolved in DCM (Phase 1), whereas Phase 2 was prepared by adding PVA to distilled water. Phase 1 and Phase 2 were put separately on a magnetic stirrer for 15 min. We slowly added Phase 1 to Phase 2 while stirring and then left them for 15 min on the stirrer at room temperature. The mixture was homogenized at different speeds for 2 h. After that, it filtered. The formed nanosponges were dried at 40°C for 12 h. The different ratios of drug: EC and stirring rate for the nine formulations are presented in Table 2.[3]
Table 2.
Terbinafine hydrochloride nanosponges formulations
| Formulation | THCl:EC ratio | PVA (% w/v) | DCM (Ml) | Stirring rate (rpm) | Stirring time (H) | Distilled water (Ml) |
|---|---|---|---|---|---|---|
| F1 | 0.25:0.25 | 1 | 10 | 2000 | 2 | 20 |
| F2 | 0.25:0.25 | 1 | 10 | 6000 | 2 | 20 |
| F3 | 0.25:0.50 | 1 | 10 | 2000 | 2 | 20 |
| F4 | 0.25:0.50 | 1 | 10 | 4000 | 2 | 20 |
| F5 | 0.25:0.50 | 1 | 10 | 6000 | 2 | 20 |
| F6 | 0.25:0.75 | 1 | 10 | 6000 | 2 | 20 |
| F7 | 0.25: 0.25 | 1 | 10 | 4000 | 2 | 20 |
| F8 | 0.25:0.75 | 1 | 10 | 2000 | 2 | 20 |
| F9 | 0.25:0.75 | 1 | 10 | 4000 | 2 | 20 |
THCl: Terbinafine hydrochloride, EC: Ethyl cellulose, PVA: Polyvinyl alcohol, DCM: Dichloromethane
Preparation of terbinafine hydrochloride nanosponges hydrogel
A quantity of 1.5 g of carbopol® 934 was dissolved in 100 ml distilled water. pH was neutralized using triethanolamine. Optimized THCl nanosponges equivalent weight was incorporated into the hydrogel to attain 1% w/w THCl. A conventional THCl gel was also prepared. The prepared gel was packed in a suitable vessel and kept in the refrigerator overnight to ensure complete dissolution of carbopol® 934 for further use.[4]
Characterization of terbinafine hydrochloride nanosponges
Production yield percent
Production yield (PY) % was calculated by:[5]
PY (%) = (Practical mass of nanosponges/ Theoretical mass [polymer + drug]) × 100 (1)
Particle size measurement
The particle size was determined using the particle size analyzer (Zeta sizer Nano series, UK). The formulations were diluted with an appropriate volume of phosphate buffer solution (PBS, pH 6.8). The measurements were carried out three times where the mean value was used.[6]
Entrapment efficiency
Weighed amount (20 g) of nanosponges was dissolved in 100 ml PBS (pH 6.8) and 20 ml ethanol and then sonicated for breakage. After suitable dilution, it was analyzed using ultraviolet spectrophotometer (Shimadzu-1700, Japan) at λmax = 222 nm.[5]. Finally, EE was calculated using the formula:
EE = (Actual drug content in nanosponges/Theoretical drug content) × 100 (2)
Surface morphology
The study was carried out using a scanning electron microscope (SEM, JEM-100S, JEOL, Japan). We spread over a slab a concentrated aqueous suspension and then dried it under vacuum.[7]
Characterization of terbinafine hydrochloride nanosponges hydrogel
Differential scanning calorimetry analysis
Pure THCl, THCl nanosponges, and THCl nanosponges hydrogel are tested with differential scanning calorimetry (DSC) (Mettler FP85, Switzerland) within the range 10°C/min–300°C/min using nitrogen as atmosphere and aluminum as a medium.[8]
Transmission electron microscopy
Morphology and structure of the nanosponges hydrogel were studied using the transmission electron microscopy (TEM) (JEOL, JEM 1010, Japan). The samples were stained with 2% uranyl acid.[3]
Drug content
The THCl nanosponges hydrogel was accurately weighed (2 g) and then transferred into a volumetric flask containing 10 ml PBS (pH 6.8) and then stirred for 30 min. After suitable dilution, the absorbance is measured spectrophotometrically at λmax = 222 nm.[9]
pH determination
pH was determined by weighing 50 g hydrogel and then transferred into a beaker and measured using digital pH meter (Jenway, United Kingdom).[9]
In vitro release
In vitro release studies of THCl nanosponges, THCl nanosponges hydrogel, and marketed cream were done using a modified Franz diffusion cell. The cellulose membrane was soaked overnight in PBS (pH 6.8). In Franz diffusion cell receptor compartment, 7 ml of PBS (pH 6.8) were filled. While in the donor compartment, equivalent amount of tested formula was placed on the cellulose membrane. The samples were analyzed spectrophotometrically at λmax = 222 nm, and the concentration of the drug was estimated. Each data point represented the mean of three determinations.[10]
Kinetics study
We fitted the in vitro release data to Higuchi, first-order, zero-order kinetics equations and to general exponential function: Mt/M∞= ktn, where Mt/M∞ represents solvent fractional uptake (or solute release) normalized regarding to conditions of equilibrium; n is an exponent of diffusion which is the characteristics of the release mechanism and k denotes of the polymer and the drug properties.[11]
In vitro antifungal activity study
We used the cup-plate method. Sabouraud dextrose agar was used as culture media. Inoculating was carried out by using Candida albicans (ATCC 10231) and Aspergillus niger (ATCC 16404). The mean inhibition zone was determined.[12]
In vivo skin deposition study
The animals were classified into three groups randomly with 15 animals for each: Group (1) served as control receiving THCl hydrogel, Group (2) received marketed cream, and finally Group (3) received THCl nanosponges hydrogel. Caps of bottle served as drug pools (0.05 m2) area were stuck to rats' dorsal skin. They were shaved.[13] Three animals were sacrificed from each group at each time intervals point (1, 2, 4, 6, and 8 h). Then, the dorsal rats' skin were excised and washed immediately with normal saline. The excised skin was cut into pieces and then sonicated for 30 min in 5 ml DMSO. The extract was filtered through a 0.45 μm filter membrane, and the concentrations were measured using a validated high-performance liquid chromatography analysis method. The skin analysis of variance was performed using InStat software (GraphPad InStat version 3.05 for Windows 95, GraphPad Software, San Diego, California USA, www.graphpad.com).
RESULTS AND DISCUSSION
Production yield percent
PY percent is represented in Table 3. It was observed that the increase in polymer ratios was accompanied by the increase in PY percent.[7]
Table 3.
Particle size, entrapment efficiency, and PY (%) of terbinafine hydrochloride nanosponges formulations
| Formulation | Particle size* (nm) | EE* | PY* (%) |
|---|---|---|---|
| F1 | 159±10 | 85.76±1.19 | 78.90±3.24 |
| F2 | 135±20.26 | 60.01±2.14 | 75.50±6.20 |
| F3 | 174±25.19 | 83.30±0.50 | 80.95±7.41 |
| F4 | 485±28.93 | 90.10±0.98 | 85.02±5.47 |
| F5 | 104±30.09 | 58.25±2.50 | 83.09±9.10 |
| F6 | 302±16.95 | 33.05±0.99 | 95.45±4.07 |
| F7 | 1102±40.86 | 50.85±1.65 | 76.90±8.07 |
| F8 | 174±21.95 | 80.45±1.98 | 96.08±1.99 |
| F9 | 1557±27.81 | 55.02±1.90 | 95.20±1.66 |
*Data are mean values (n=3)±SD. SD: Standard deviation, EE: Entrapment efficiency, PY: Production yield
Statistical analysis
Particle size measurement
All formulations were in nanosize range except F7 and F9, as shown in Table 3 and Figure 1.
Figure 1.
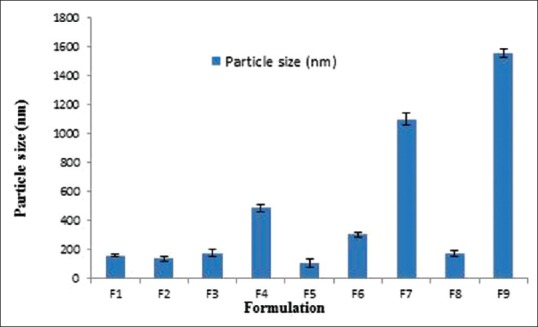
Particle size of different terbinafine hydrochloride nanosponges formulations
Coded factors equation:
Y1= +836.56 + 106.17 A + 5.67 B − 38.00 A B + 317.17 A2 − 873.33 B2 (3)
(where F = 3.30, P < 0.05, R2 = 0.9501, Adeq Precision = 4.830)
The design was evaluated by a quadratic model and equation (3) was determined based on the selected model. Y1 is the response variable (particle size) whereas A and B are the independent variables X1 and X2 coded levels, respectively, that symbolize the mean results of one factor changing at a time from low to higher levels.
From previous equation, the particle size is decreased due to the statistically significant negative coefficient value of B2 (P < 0.05) that was accompanied by increasing the stirring rate (X2), which could be attributed to the effect of homogenization speed, as the magnitude of shear stress is inversely proportional to the particle size of the prepared nanosponges [Figures 2 and 3].
Figure 2.
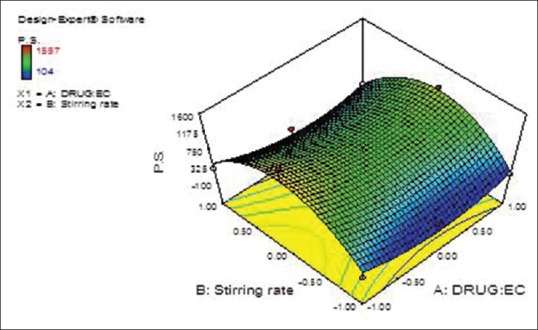
Terbinafine hydrochloride: Ethyl cellulose ratio (X1) and stirring rate (X2) effects on the prepared terbinafine hydrochloride nanosponges particle size (Y1) response surface plot
Figure 3.
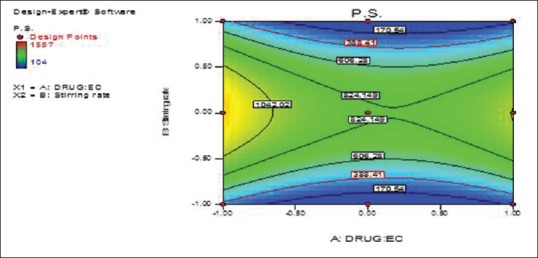
Terbinafine hydrochloride: Ethyl cellulose ratio (X1) and stirring rate (X2) effects on the prepared terbinafine hydrochloride nanosponges particle size (Y1) overlay plot (contour plot)
Entrapment efficiency
EE of THCl nanosponges formulations is illustrated in Table 3 and Figure 4.
Figure 4.
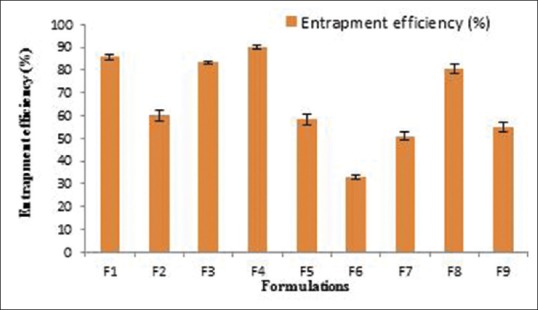
Entrapment efficiency of different terbinafine hydrochloride nanosponges formulations
Coded factors equation:
Y2= +66.30 + 4.69 A − 16.38 B (4)
(where F = 4.10, P < 0.05, R2 = 0.9907, Adeq Precision = 5.011).
The design was evaluated by the linear model, and equation (4) was determined based on the selected model, where Y2 is the response variable (EE). From the previous equation, EE was observed to be decreased due to the statistically significant negative coefficient value of B (P < 0.05) that was accompanied by increasing the stirring rate [Figures 5 and 6].
Figure 5.
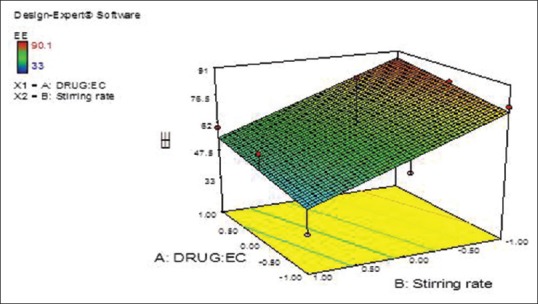
Terbinafine hydrochloride: Ethyl cellulose ratio (X1) and stirring rate (X2) effects on entrapment efficiency of the prepared terbinafine hydrochloride nanosponges (Y2) response surface plot
Figure 6.
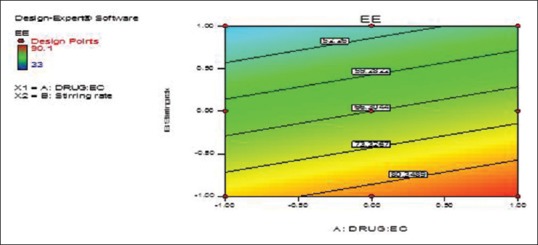
Terbinafine hydrochloride: Ethyl cellulose ratio (X1) and stirring rate (X2) effects on entrapment efficiency of the prepared terbinafine hydrochloride nanosponges (Y2) overlay plot (contour plot)
Checkpoint analysis and optimization of design
For optimizing the responses with various targets, the software design expert 7.0 suggested one formulation (F10), based on a multi-criterion decision way. The selected optimum variables values obtained were (X1 = 1:2) and (X2 = 1500 rpm). Table 4 shows that there is a great coincidence between the predicted and observed values.
Table 4.
Checkpoint analysis of optimized terbinafine hydrochloride nanosponges formulation (F10)
| Response | Expected | Observed | Residual | Desirability |
|---|---|---|---|---|
| Particle size (nm) | 251 | 302 | 51 | 1 |
| EE | 78.15 | 85.08 | 6.93 | 1 |
EE: Entrapment efficiency
Surface morphology
Micrographs of optimized formula confirmed nanosponges porous nature. Figure 7 shows that nanosponges depicted spherical, smooth surface, and uniformly porous particles. The occurrence of surface fine orifices could be due to DCM diffusion during nanosponges preparation.[7]
Figure 7.
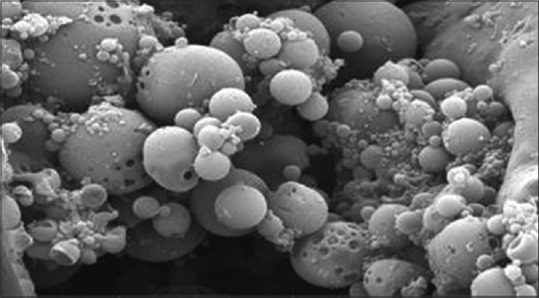
Scanning electron microscopy of dried terbinafine hydrochloride nanosponges
Characterization of terbinafine hydrochloride nanosponges hydrogel
Differential scanning calorimetry analysis
DSC thermograms of pure THCl, THCl nanosponges, and THCl nanosponges hydrogel are shown in Figure 8a–c, respectively. The endothermic peak of THCl was greatly decreased in THCl nanosponges and THCl nanosponges hydrogel. That may be due to nanosponge encapsulation of THCl. In addition, it is in amorphous state after entrapment with the polymer because drug crystals completely dissolved inside the polymer matrix during the scanning of temperatures up to the melting value.[8]
Figure 8.
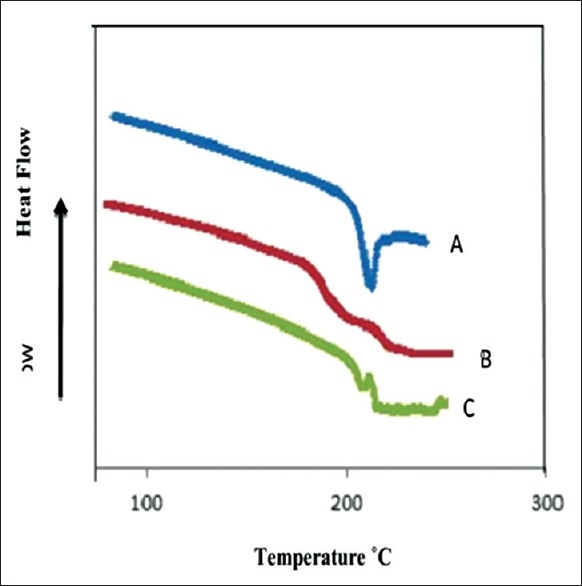
Differential scanning calorimetry thermograms of (a) pure terbinafine hydrochloride, (b) terbinafine hydrochloride nanosponges, and (c) terbinafine hydrochloride nanosponges hydrogel
Transmission electron microscopy
Figure 9 shows that TEM of the THCl nanosponges hydrogel confirmed the nanosponges incorporation into the hydrogel did not influence the nanosponges integrity.[9]
Figure 9.
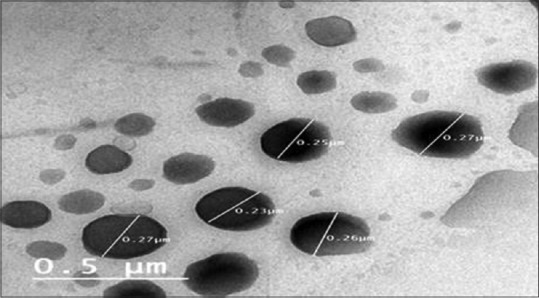
Transmission electron microscopy of terbinafine hydrochloride nanosponges hydrogel
Drug content and pH determination
The results of drug content are within the accepted limit (97.25 ± 3.1). The hydrogel pH values were 5.5, and hence it is acceptable and there is no risk of skin irritation.[9]
In vitro release study
The results of in vitro release studies are shown in Figure 10. THCl nanosponges hydrogel succeeded to sustain the release of the drug for 8 h. Hence, it was clear that drug released slowly from dosage form when it was incorporated as an entrapped form rather than the unentrapped form.
Figure 10.
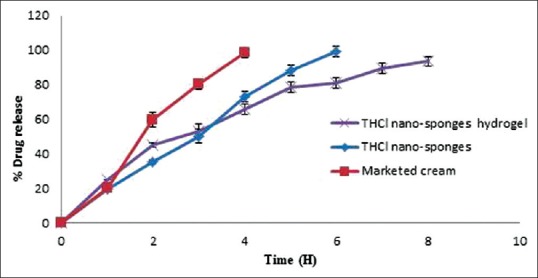
In vitro release profiles of terbinafine hydrochloride nanosponges and terbinafine hydrochloride nanosponges hydrogel formulation in comparison with marketed cream
Kinetics study
The results in Table 5 show the in vitro drug release kinetic data and Korsmeyer–Peppas equation data.
Table 5.
Kinetic data of optimized terbinafine hydrochloride nanosponges and terbinafine hydrochloride nanosponges hydrogel
| Formulation | Zero order |
First order |
Higuchi diffusion |
Korsmeyer-Peppas |
Possible kinetics order and mechanism of the drug release | |||||
|---|---|---|---|---|---|---|---|---|---|---|
| r | k | r | k | r | k | r | k | n | ||
| THCl nanosponges | 0.9962 | 0.2754 | 0.8949 | 0.0134 | 0.9913 | 7.3871 | 0.9999 | 0.0057 | 0.8609 | Zero-order kinetics, Case II transport |
| THCl nanosponges hydrogel | 0.9767 | 0.1575 | 0.9871 | 0.0056 | 0.9944 | 4.8418 | 0.9849 | 0.0148 | 0.6986 | Diffusion, Case II transport |
THCl: Terbinafine hydrochloride
In vitro antifungal activity study
As shown in Table 6, the mean growth inhibition zone of THCl nanosponges hydrogel is higher than that of marketed cream and THCl hydrogel (positive control).
Table 6.
The results of the in-vitro antifungal activity
| Formula | Mean zone of inhibition (cm)* |
|
|---|---|---|
| Aspergillus niger | Candida albicans | |
| THCl hydrogel | 1.8±0.2 | 1.7±0.05 |
| Marketed cream | 1.6±0.1 | 2.2±0.03 |
| THCl nanosponges hydrogel | 2.8±0.3 | 3.0±0.14 |
| Plain Carbopol® 934 gel | 0 | 0 |
*Data are mean values (n=3)±SD. THCl: Terbinafine hydrochloride, SD: Standard deviation
In vivo skin deposition study
Figure 11 shows that the skin deposition of THCl nanosponges hydrogel is significantly higher than THCl hydrogel and marketed cream at P< 0.01 during almost all the study period.
Figure 11.
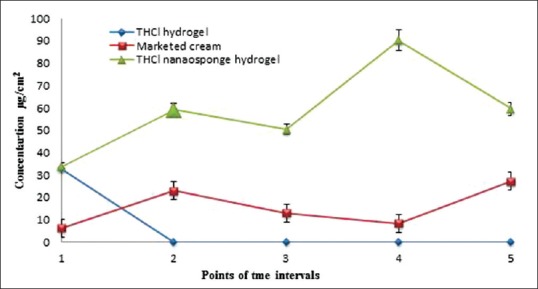
Collective results of skin deposition of the three different treatments at 5 points (each point represents the results at a certain time after 1, 2, 4, 6, and 8 h)
CONCLUSION
The nanosponges hydrogel formula succeeded to sustain the release of THCl across cellulose membrane over 8 h. It showed higher antifungal activity and skin deposition than marketed cream. Hence, it represents an enhanced therapeutic approach for the treatment of fungal infection.
Financial support and sponsorship
Nil.
Conflicts of interest
There are no conflicts of interest.
REFERENCES
- 1.Selvamuthukumar S, Anandam S, Krishnamoorthy K, Rajappan M. Nanosponges: A novel class of drug delivery system – Review. J Pharm Pharm Sci. 2012;15:103–11. doi: 10.18433/j3k308. [DOI] [PubMed] [Google Scholar]
- 2.Baline K, Hali F. Fonsecaea pedrosoi-induced chromoblastomycosis: About a case. Pan Afr Med J. 2018;30:187. doi: 10.11604/pamj.2018.30.187.5326. [DOI] [PMC free article] [PubMed] [Google Scholar]
- 3.Aldawsari HM, Badr-Eldin SM, Labib GS, El-Kamel AH. Design and formulation of a topical hydrogel integrating lemongrass-loaded nanosponges with an enhanced antifungal effect: In vitro/in vivo evaluation. Int J Nanomedicine. 2015;10:893–902. doi: 10.2147/IJN.S74771. [DOI] [PMC free article] [PubMed] [Google Scholar]
- 4.Jain PS, Chaudhari AJ, Patel SA, Patel ZN, Patel DT. Development and validation of the UV-spectrophotometric method for determination of terbinafine hydrochloride in bulk and in formulation. Pharm Methods. 2011;2:198–202. doi: 10.4103/2229-4708.90364. [DOI] [PMC free article] [PubMed] [Google Scholar]
- 5.Zaman M, Qureshi S, Sultana K, Hanif M, Mahmood A, Shaheryar ZA, et al. Application of quasi-emulsification and modified double emulsification techniques for formulation of tacrolimus microsponges. Int J Nanomedicine. 2018;13:4537–48. doi: 10.2147/IJN.S166413. [DOI] [PMC free article] [PubMed] [Google Scholar]
- 6.Ng WK, Saiful Yazan L, Yap LH, Wan Nor Hafiza WA, How CW, Abdullah R. Thymoquinone-loaded nanostructured lipid carrier exhibited cytotoxicity towards breast cancer cell lines (MDA-MB-231 and MCF-7) and cervical cancer cell lines (HeLa and SiHa) Biomed Res Int. 2015;2015:1–10. doi: 10.1155/2015/263131. [DOI] [PMC free article] [PubMed] [Google Scholar]
- 7.Osmani RA, Aloorkar NH, Ingale DJ, Kulkarni PK, Hani U, Bhosale RR, et al. Microsponges based novel drug delivery system for augmented arthritis therapy. Saudi Pharm J. 2015;23:562–72. doi: 10.1016/j.jsps.2015.02.020. [DOI] [PMC free article] [PubMed] [Google Scholar]
- 8.Moin A, Deb TK, Osmani RA, Bhosale RR, Hani U. Fabrication, characterization, and evaluation of microsponge delivery system for facilitated fungal therapy. J Basic Clin Pharm. 2016;7:39–48. doi: 10.4103/0976-0105.177705. [DOI] [PMC free article] [PubMed] [Google Scholar]
- 9.El-Housiny S, Shams Eldeen MA, El-Attar YA, Salem HA, Attia D, Bendas ER, et al. Fluconazole-loaded solid lipid nanoparticles topical gel for treatment of pityriasis versicolor: Formulation and clinical study. Drug Deliv. 2018;25:78–90. doi: 10.1080/10717544.2017.1413444. [DOI] [PMC free article] [PubMed] [Google Scholar]
- 10.Ansari KA, Vavia PR, Trotta F, Cavalli R. Cyclodextrin-based nanosponges for delivery of resveratrol:In vitro characterisation, stability, cytotoxicity and permeation study. AAPS PharmSciTech. 2011;12:279–86. doi: 10.1208/s12249-011-9584-3. [DOI] [PMC free article] [PubMed] [Google Scholar]
- 11.Jagdale SC, Sali MS, Barhate AL, Kuchekar BS, Chabukswar AR. Formulation, development, and evaluation of floating pulsatile drug delivery system of atenolol. PDA J Pharm Sci Technol. 2013;67:214–28. doi: 10.5731/pdajpst.2013.00916. [DOI] [PubMed] [Google Scholar]
- 12.Wong SS, Kao RY, Yuen KY, Wang Y, Yang D, Samaranayake LP, et al. In vitro and in vivo activity of a novel antifungal small molecule against Candida infections. PLoS One. 2014;9:e85836. doi: 10.1371/journal.pone.0085836. [DOI] [PMC free article] [PubMed] [Google Scholar]
- 13.Shen LN, Zhang YT, Wang Q, Xu L, Feng NP. Enhanced in vitro and in vivo skin deposition of apigenin delivered using ethosomes. Int J Pharm. 2014;460:280–8. doi: 10.1016/j.ijpharm.2013.11.017. [DOI] [PubMed] [Google Scholar]


