Abstract
Obesity-associated type 2 diabetes mellitus (T2DM) entails insulin resistance and loss of β-cell mass. Adipose tissue mitochondrial dysfunction is emerging as a key component in the etiology of T2DM. Identifying approaches to preserve mitochondrial function, adipose tissue integrity, and β-cell mass during obesity is a major challenge. Mitochondrial ferritin (FtMT) is a mitochondrial matrix protein that chelates iron. We sought to determine whether perturbation of adipocyte mitochondria influences energy metabolism during obesity. We used an adipocyte-specific doxycycline-inducible mouse model of FtMT overexpression (FtMT-Adip mice). During a dietary challenge, FtMT-Adip mice are leaner but exhibit glucose intolerance, low adiponectin levels, increased reactive oxygen species damage, and elevated GDF15 and FGF21 levels, indicating metabolically dysfunctional fat. Paradoxically, despite harboring highly dysfunctional fat, transgenic mice display massive β-cell hyperplasia, reflecting a beneficial mitochondria-induced fat-to-pancreas interorgan signaling axis. This identifies the unique and critical impact that adipocyte mitochondrial dysfunction has on increasing β-cell mass during obesity-related insulin resistance.
Introduction
Obesity-related type 2 diabetes is characterized by insulin resistance and β-cell dysfunction. Mitochondrial dysfunction, specifically in white adipose tissue (WAT), is an unappreciated yet significant contributor to the development of insulin resistance (1). Therefore, identifying mechanisms that maintain adequate mitochondrial function during a metabolic challenge that are associated with the preservation of healthy WAT expansion and insulin sensitivity, is a key challenge.
In our previous studies, we used the outer mitochondrial membrane protein mitoNEET as a tool to manipulate mitochondrial iron homeostasis exclusively in adipose tissue. Induction of mitoNEET in adipocytes compromises mitochondrial function and paradoxically, promotes metabolically healthy WAT expansion. This resulted in the heaviest Mus musculus ever reported to date (2). As proof of concept, we next asked: Does induction of any adipose tissue mitochondrial protein involved in iron homeostasis yield a “massively obese, yet metabolically healthy” mouse? To address this, we explored the properties of another key mitochondrial protein, mitochondrial ferritin (FtMT).
Unlike mitoNEET, which resides in the outer mitochondrial membrane, FtMT is located in the mitochondrial matrix. FtMT displays ferroxidase activity by chelating and storing surplus redox-active iron within the mitochondrial matrix (3). FtMT also contributes to the regulation of oxidative stress (4). In vitro studies highlight that by storing iron, FtMT prevents reactive oxygen species (ROS) generation through the Fenton reaction (3,5). Here, our aim was not to characterize the endogenous function of FtMT per se; rather, we take advantage of its unique properties, which entail its ability to shuttle and sequester iron in the mitochondrial matrix (i.e., we use FtMT as an “in vivo tool” to create an environment of adipocyte mitochondrial dysfunction). This allows us to examine the local and system-wide mechanisms by which a dysregulation in adipocyte mitochondrial function alters adipose tissue expansion, specifically during the progression of diet-induced obesity (DIO) and insulin resistance. We hypothesize that 1) adipocyte-specific induction of FtMT impacts mitochondrial function in a similar manner to mitoNEET, such that the adipocyte unleashes positive compensatory mechanisms that produce an “obese yet metabolically favorable” mouse and that 2) an FtMT-driven alteration in adipocyte mitochondrial function preserves whole-body insulin sensitivity during DIO.
Research Design and Methods
Mice
All animal experimental protocols were approved by the Institutional Animal Care and Use Committee of the University of Texas Southwestern Medical Center at Dallas. We generated a doxycycline (Dox)-inducible mouse model of FtMT overexpression (TRE-FtMT mouse). Transgene-positive TRE-FtMT offspring were genotyped using PCR with the primer set 5′-GACAAGCACACGCTTGGAAG and 5′-ATGAGGGTCCATGGTGATAC. Adiponectin-rtTA mice were generated as previously described (6). Adiponectin-rtTA offspring were genotyped using PCR with the primer set 5′- AGTCATTCCGCTGTGCTCTC and 5′-GCTCCTGTTCCTCCAATACG. All experiments were conducted using littermate male mice as the control. Mice were fed a standard chow diet (#5058; LabDiet, St. Louis, MO), a Dox-chow diet (600 mg/kg Dox) (Bio-Serv, Frenchtown, NJ), or a Dox–high-fat diet (Dox-HFD; 600 or 10 mg/kg Dox) (Bio-Serv). All experiments were initiated at ∼6–12 weeks of age.
Systemic Tests and Treatments
For oral glucose tolerance tests (OGTTs), mice were fasted for 3 h before the administration of glucose (2.5 g/kg body wt by gastric gavage). At the indicated times, venous blood samples were collected in heparin-coated capillary tubes from the tail vein. Glucose levels were measured using an oxidase-peroxidase assay (Sigma-Aldrich). For triglyceride (TG) clearance, mice were fasted (∼14–16 h), then gavaged 20% Intralipid (15 μL/g body wt) (Fresenius Kabi Clayton, L.P., Clayton, NC). Insulin and adiponectin levels were measured using commercially available ELISA kits (Millipore Linco Research, St. Charles, MO). GDF15 was measured using an ELISA kit (R&D Systems, Minneapolis, MN). Cytoplasmic and mitochondrial total iron levels were measured using a commercially available kit (BioAssay Systems).
Immunoblotting
Frozen tissues were processed, and blotting and imaging were performed as previously described (2). An anti-rabbit polyclonal antibody for FtMT was used (1:1,000) (Uscn Life Sciences). A monoclonal MitoProfile Total OXPHOS Rodent Antibody Cocktail was used (1:1,000) (MitoSciences, Cambridge, MA). A monoclonal prohibitin antibody was also used (1:1,000) (Abcam, Cambridge, MA). Bound F2-isoprostane levels (ROS damage by lipid peroxidation) and hepatic TG content were measured as previously detailed (2).
Quantitative Real-time PCR and Illumina Microarray
Total RNA was isolated, and cDNA was prepared from frozen tissues as previously described (2). Supplementary Table 6 details the primer sequences that were used for quantitative real-time (q)PCR. Results were calculated using the threshold cycle method (7), with β-actin used for normalization. For Illumina microarray, total cDNA was synthesized from subcutaneous WAT (sWAT) and spotted onto a mouse BeadArray platform (Illumina). Fold-changes and significance were calculated based on three independent replicates. For statistical analyses, a Student t test was used for comparison between two independent groups. Significance was accepted at a P value of <0.05.
Histology and Immunohistochemical and Immunofluorescence Staining
The relevant fat pads (sWAT, gonadal WAT [gWAT], and brown adipose tissue [BAT]), liver and pancreas tissues were excised and fixed in 10% PBS-buffered formalin for 24 h. After paraffin embedding and sectioning (5 μm), tissues were stained with hematoxylin and eosin (H&E) or a Masson trichrome stain. For immunohistochemistry (IHC), paraffin-embedded sections were stained using monoclonal anti-Mac2 antibodies (1:1,000) (#CL8942AP; CEDARLANE Laboratories USA). For immunofluorescence (IF), paraffin-embedded sections were stained using monoclonal anti-perilipin antibodies (1:250) (Fitzgerald), polyclonal anti–4-hydroxy-2-noneal (4-HNE) antibodies (1:200) (Alpha Diagnostic International), a guinea pig anti-swine insulin antibody (1:500) (Dako, Carpinteria, CA), or a rabbit anti-glucagon antibody (1:250) (Zymed, Grand Island, NY).
Hyperinsulinemic-Euglycemic Clamps and Hyperglycemic Clamps
Hyperinsulinemic-euglycemic clamps and hyperglycemic clamps were performed, as previously described (2,8).
Lysophosphatidic Acid, Phosphatidic Acid, Ceramides, and Sphingolipid Measurements
Lysophosphatidic acid (LPA), phosphatidic acid, ceramides, and sphingolipids were quantified by liquid chromatography-electrospray ionization–tandem mass spectrometry, using a Nexera ultra-high-performance liquid chromatograph coupled to an LCMS-8050 (Shimadzu Scientific Instruments, Columbia, MD), as previously described (9). Data were processed using the LabSolutions 5.82 and LabSolutions Insight 2.0 program packages (Shimadzu Scientific Instruments).
Statistical Analyses
Results are provided as means ± SEM. Statistical analysis was performed using GraphPad Prism (GraphPad Prism Software, San Diego, CA). Differences between the two groups over time (as indicated in the relevant figure legends) were determined by a two-way ANOVA for repeated measures, followed by a Bonferroni posttest to compare replicate means in each time point. For comparison between two independent groups, a Student t test was used. The box-and-whisker analysis was performed to exclude any potential outliers accordingly. Significance was accepted at a P value of <0.05. All statistical information is provided in Supplementary Table 7.
Data and Resource Availability
The data sets generated during and/or analyzed during the current study are available in the National Center for Biotechnology Information repository (Gene Expression Omnibus [GEO] accession number GSE125900) at https://www.ncbi.nlm.nih.gov/geo/query/acc.cgi?acc=GSE125900. The data sets generated and/or analyzed during the current study are available from the corresponding author upon reasonable request.
Results
Inducible Overexpression of FtMT Specifically in Adipose Tissue
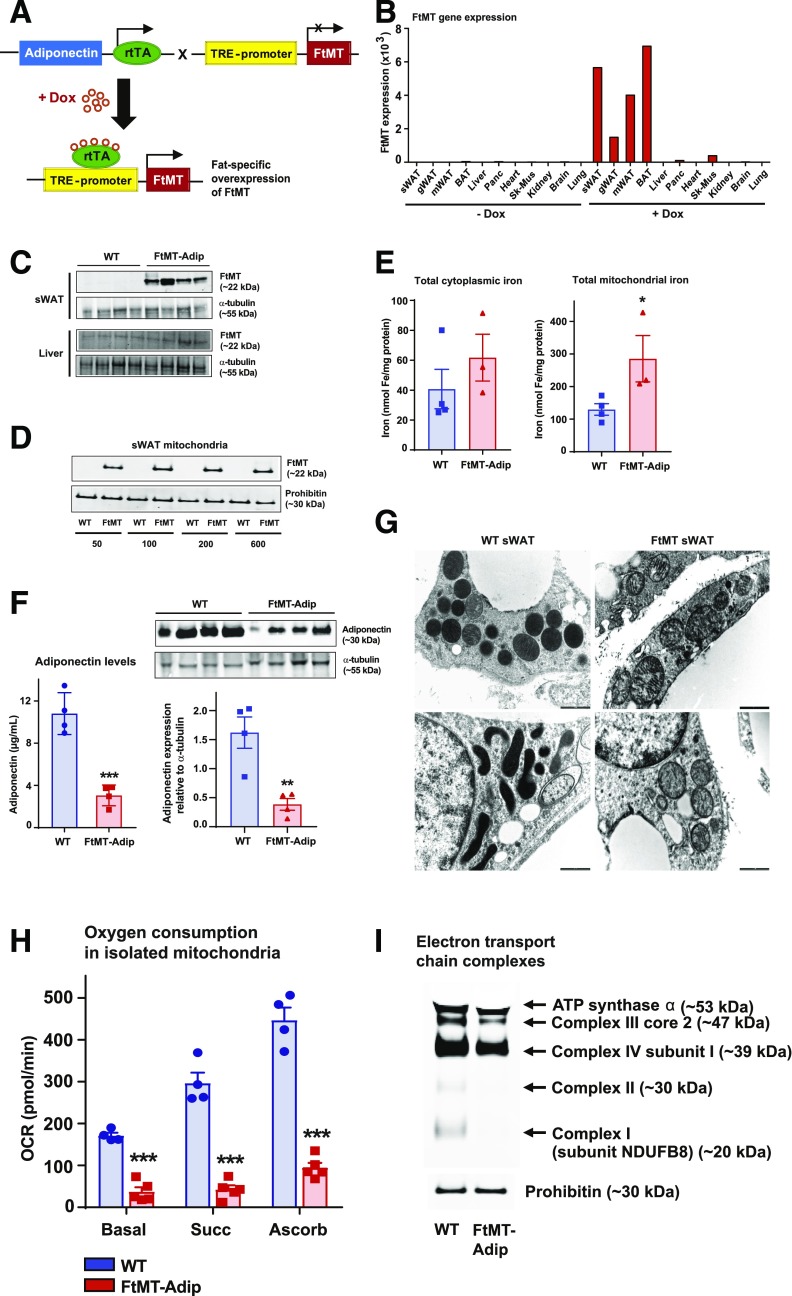
To trigger FtMT-induced mitochondrial dysfunction in WAT, we generated a mouse in which the expression of FtMT is driven by a tetracycline-inducible promoter element (a tet-responsive element, or TRE); that is, a “TRE-FtMT mouse.” For this promoter element to be operational, the “Tet-on” transcription factor, rtTA is required. We provide this factor in a fat-specific manner through a mouse that harbors rtTA under the control of the adiponectin promoter (6). Upon crossing TRE-FtMT mice with adiponectin-rtTA mice (FtMT-Adip mice) and with the administration of Dox, we achieve induction of FtMT specifically within adipose tissue (Fig. 1A). Our in vivo system of inducible FtMT is highly specific and titratable. After 1 week of Dox-chow (600 mg/kg Dox) feeding, FtMT mRNA (Fig. 1B) and protein (Fig. 1C) are markedly increased in transgenic sWAT. Consistent with FtMT localization to the mitochondrial matrix (10), FtMT protein levels are markedly enhanced in mitochondria isolated from transgenic fat (Fig. 1D). Given its iron-sequestering properties (10), FtMT increases total iron levels in adipose mitochondria, with no differences apparent in cytoplasmic total iron (Fig. 1E).
Figure 1.
Induction of FtMT in fat promotes mitochondrial dysfunction and reduces adiponectin. A: The breeding strategy to overexpress FtMT specifically in fat. Adipose tissue–specific adiponectin promoter (Adip)-rtTA mice were bred with TRE-FtMT mice. After Dox administration, the resulting FtMT-Adip mice overexpress FtMT exclusively in fat. B: A representative tissue distribution of FtMT gene expression levels (relative to β-actin) in sWAT, gWAT, mesenteric WAT (mWAT), BAT, liver, pancreas, heart, skeletal muscle (Sk-mus), kidney, brain, and lung from a male C57/BL6 FtMT-Adip mouse fed a standard chow diet or after 1 week of the Dox-chow diet (600 mg/kg). C: A representative Western blot of FtMT (∼22 kDa) and prohibitin (∼30 kDa) in sWAT and liver from WT mice and FtMT-Adip mice fed the Dox-chow diet for 1 week. D: A representative Western blot of FtMT in mitochondria isolated from sWAT of WT and FtMT-Adip mice that were fed the Dox-chow diet containing 50, 100, 200, or 600 mg/kg Dox. E: Cytoplasmic (left) and mitochondrial (right) iron levels in BAT from WT and FtMT-Adip mice that were fed the Dox-chow diet containing 600 mg/kg Dox (n = 3–4). F: Circulating adiponectin levels in WT and FtMT-Adip mice after the Dox-chow diet (n = 4) (left). Representative Western blots of adiponectin (∼30 kDa) and α-tubulin (∼55 kDa) in sWAT from Dox-chow–fed WT and FtMT-Adip mice (right). The bar graph shows the average adiponectin levels normalized to α-tubulin (n = 4–5). G: Representative electron microscope images of WT sWAT (left) and FtMT-Adip sWAT (right) from mice fed the Dox-chow diet for 2 weeks. Scale bars = 1,000 nm. H: Oxygen-consumption rates (OCRs) (pmol/min) in mitochondria (5 μg) isolated from WT and FtMT-Adip BAT in response to sequential additions of DMEM (basal measurements with DMEM media containing FCCP [carbonyl cyanide 4-[trifluoromethoxy]phenylhydrazone], pyruvate, malate, and the complex I inhibitor rotenone), succinate (complex II substrate), antimycin-A (complex III inhibitor), and ascorbate and TMPD (N,N,N′,N′-tetramethyl-p-phenylenediamine) (cytochrome c substrate) (n = 4–5). I: Western blot showing complex I (subunit NDUFB8), complex II, complex III (core 2), complex IV (subunit I), and ATP synthase α of the mitochondrial electron transport chain in WT and FtMT-Adip BAT. Identical amounts of total mitochondrial protein were loaded, as judged by the mitochondrial loading marker prohibitin (∼30 kDa). Data are shown as mean ± SEM. **P < 0.01; ***P < 0.001.
FtMT-Adip mice fed Dox-chow gain significantly less body weight (data not shown) and display a significant reduction in circulating and intracellular levels of adiponectin (Fig. 1F). As adiponectin is tightly associated with enhanced insulin sensitivity (11,12), this suggests a metabolically unfavorable phenotype in FtMT-Adip mice. Indeed, transgenic adipose mitochondria have less dense cristae (Fig. 1G), significantly lower oxygen-consumption rates (Fig. 1H), and exhibit reduced expression of electron transport chain complexes (Fig. 1I). Combined, this points to mitochondrial dysfunction in transgenic fat.
FtMT-Adip Mice Are Resistant to DIO but Are Glucose-Intolerant and Have Reduced Adiponectin With Local Oxidative Stress
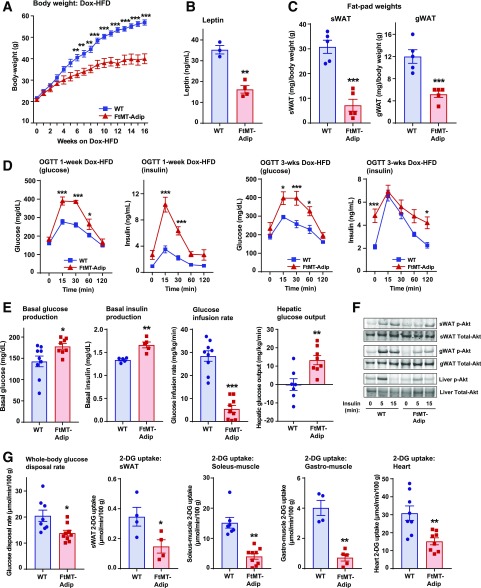
FtMT-Adip mice exhibit a large reduction in body weight (∼20 g) during Dox-HFD feeding (Fig. 2A), which is reflected by a significant decrease in circulating leptin levels (Fig. 2B) and reduced fat-pad mass (Fig. 2C). Despite being leaner, transgenic mice display glucose intolerance, even after 1 week of the Dox-HFD (Fig. 2D), which persists over several weeks (Fig. 2D and Supplementary Fig. 1A). FtMT-Adip mice also exhibit significantly higher levels of glucose and insulin during ad libitum feeding (Supplementary Table 1). Given that body weights do not diverge between genotypes after 3 weeks of the Dox-HFD (yet we observe glucose intolerance), we chose this 3-week time point for subsequent experiments.
Figure 2.
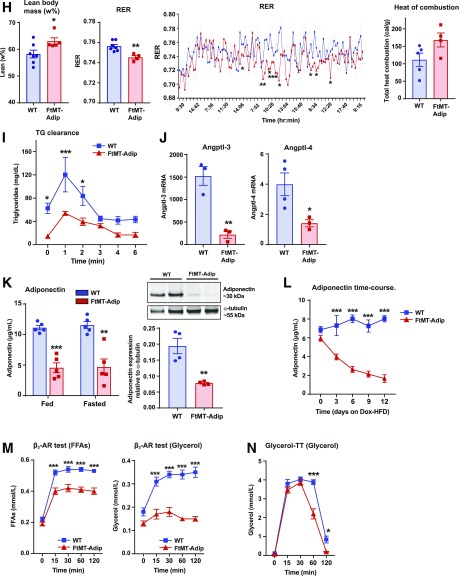
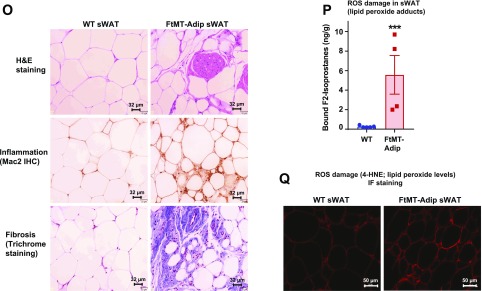
FtMT-Adip mice exhibit reduced diet-induced body weight gain, glucose intolerance, low adiponectin levels, and ROS damage in adipose tissue. A: Body weights (g) of WT vs. FtMT-Adip mice during Dox-HFD feeding (n = 5). B: Circulating leptin levels in WT and FtMT-Adip mice after Dox-HFD feeding (n = 3–4). C: Fat-pad (sWAT and gWAT) tissue weights (mg) normalized to total body weights (g) in WT and FtMT-Adip mice after 16 weeks of Dox-HFD feeding (n = 5). D: Glucose and insulin levels during an OGTT of male WT and FtMT-Adip mice after 1 week of the 10 mg/kg Dox-HFD (left) or 3 weeks of the 600 mg/kg Dox-HFD (right) (n = 5). E: Basal glucose (n = 9) and insulin production (n = 5), glucose infusion rates (n = 9), and hepatic glucose output (n = 7–8) during hyperinsulinemic-euglycemic clamps performed on conscious unrestrained 16-week-old male WT and FtMT-Adip mice. F: Representative Western blots of phosphorylated (p)-Akt and total-Akt expression (∼60 kDa) in sWAT, gWAT, and liver tissues from WT vs. FtMT-Adip mice before and after insulin injection (0-, 5- and 15-min time points) that were fed the Dox-HFD for 3 weeks. Mice were fasted overnight (∼14–16 h) before insulin injection (1 unit/kg body wt insulin i.p.). G: Whole-body 2-DG disposal rate (left) and glucose uptake in sWAT, soleus muscle, gastrocnemius (gastro) muscle, and the heart from WT and FtMT-Adip mice after 3 weeks of Dox-HFD feeding (n = 7–9; n = 4–5 for sWAT and gastrocnemius muscle). H: Metabolic cage analyses showing lean body mass (w%), respiratory exchange rate (RER), and total heat combustion (calories/g) of WT and FtMT-Adip mice after 3 weeks of Dox-HFD feeding (n = 4–7). I: TG clearance test on WT and FtMT-Adip mice. Mice were gavaged 20% Intralipid after an overnight fast (∼14–16 h; n = 5). J: Angptl-3 (left) and Angptl-4 (right) gene expression levels in WT and FtMT-Adip sWAT (n = 3–4). K: Circulating adiponectin levels (left) under fed and fasted (24 h) conditions in WT and FtMT-Adip mice (n = 5). Representative Western blots of adiponectin and α-tubulin (right) in sWAT from Dox-HFD–fed WT and FtMT mice, with the graph showing average adiponectin levels normalized to α-tubulin (n = 4). L: Circulating adiponectin levels during a Dox-HFD time course (every 3 days for up to 12 days) (n = 9). M: FFA (left) and glycerol levels (right) during a β3-AR agonist test on male WT and FtMT-Adip mice (n = 6–7). N: Glycerol levels during a glycerol tolerance test (TT; 20% glycerol i.p. at a dose of 2 mg/kg after an overnight fast of 14–16 h; n = 7). O: Representative images of H&E staining (top), Mac2 IHC staining (middle), and trichrome staining (bottom) of WT and FtMT-Adip sWAT after Dox-HFD feeding. Scale bars = 32 μm. P: ROS damage (bound F2-isoprostane [ng/g] levels reflecting lipid peroxide adducts) in WT and FtMT-Adip sWAT (n = 4–5). Q: Representative images of 4-HNE (a marker of ROS damage; lipid peroxide levels) IF staining of WT and FtMT-Adip sWAT. Scale bar = 50 μm. Data are shown as mean ± SEM *P < 0.05; **P < 0.01; ***P < 0.001.
Hyperinsulinemic-euglycemic clamps show transgenic mice have enhanced basal glucose and insulin production and require a significantly lower glucose infusion rate than wild-type (WT) littermates (Fig. 2E) (reflecting impaired whole-body insulin sensitivity). Hepatic insulin sensitivity is worsened in transgenic mice (as shown by significantly higher hepatic glucose output) (Fig. 2E). Transgenic sWAT, gWAT, and liver display impaired insulin signaling (reduced insulin-stimulated phosphorylated-Akt levels) (Fig. 2F). Consistent with glucose intolerance, 2-deoxyglucose (2-DG)-uptake experiments reveal significantly reduced whole-body glucose disposal rate (Rds), with reduced glucose uptake in transgenic sWAT, soleus and gastrocnemius muscle, and heart (Fig. 2G).
Metabolic cage studies (performed before body weights diverged, as no difference in body fat was evident) (Supplementary Fig. 1B) showed that transgenic mice have increased lean body mass (Fig. 2H) but no marked differences in oxygen-consumption rates (Supplementary Fig. 1B) or food intake (data not shown). Interestingly, FtMT-Adip mice exhibit a moderate increase in total heat consumption (Fig. 2H), suggesting their surplus calories are excreted and lost, possibly due to a malabsorption defect. This is paralleled with moderate increases in certain sphingolipid and ceramide species (Supplementary Fig. 1C), suggesting some contribution of toxic lipid species to this phenotype. Transgenic mice have a significantly lower respiratory exchange ratio (Fig. 2H), indicating a preferential fuel utilization toward free fatty acids (FFAs) as a primary energy source. Consistent with this, transgenic mice have significantly improved TG clearance rates (Fig. 2I). Lipoprotein lipase (LPL) is a rate-limiting enzyme that hydrolyzes TGs in circulating lipoproteins. Increased adipose LPL levels are typically associated with enhanced TG uptake (13). During fasting, induction of angiopoietin-3 (ANGPTL-3) and ANGPTL-4 inhibit LPL activity in WAT (14). The significant downregulation of Angptl-3 and Angptl-4 expression in transgenic sWAT (Fig. 2J) reaffirms their enhanced TG clearance rate. However, 3H-triolein tracer experiments reveal no marked differences in tissue mass, lipid uptake, or lipid oxidation in sWAT, gWAT, or liver (Supplementary Fig. 1D). This suggests that these tissues are not primarily responsible for enhanced lipid uptake in the transgenic mice at that given time point.
Elevated adiponectin levels correlate with improved insulin sensitivity (11,15). FtMT-Adip mice have significantly lower circulating levels of adiponectin in the fed and fasted state (24 h), with minimal levels expressed in WAT (Fig. 2K). Acute induction of FtMT in adipose tissue during Dox-HFD feeding further shows the significant gradual decline in circulating adiponectin levels (Fig. 2L). Fat-specific adiponectin-overexpressing mice are highly sensitive to β3-adrenergic receptor (AR) agonist treatment (16). Consistent with this, transgenic mice are less sensitive to adrenergic stimuli, as evident by low FFA and glycerol levels after β3-AR agonist treatment (Fig. 2M). FtMT-Adip mice also exhibit extremely low circulating levels of glycerol (Supplementary Table 1). Glycerol clearance tests reveal that transgenic mice clear exogenous glycerol from the circulation at a significantly higher rate than WT littermates (Fig. 2N), suggesting an additional preferential utilization of glycerol as an energy source.
Morphologically, transgenic mice have dysfunctional sWAT and gWAT, with enhanced infiltration of adipose tissue macrophages (inflammation) and fibrosis (Fig. 2O and Supplementary Fig. 2A). Whereas transgenic mice have reduced fat-pad mass (Fig. 2C), this is not due to adipose tissue apoptosis, as perilipin IF shows whole adipocyte staining in sWAT and BAT (Supplementary Fig. 2B). Strikingly, FtMT-Adip mice have a massive 21-fold increase in ROS damage (lipid peroxidation adducts) in sWAT (Fig. 2P), which is confirmed by 4-HNE IF staining (lipid peroxide levels) (Fig. 2Q). Combined, induction of FtMT in fat (as a unique tool to elicit mitochondrial dysfunction via disruption of mitochondrial iron homeostasis) yields a profoundly metabolically unhealthy phenotype.
FtMT Induction in Fat Exacerbates the Metabolically Unhealthy Phenotype of the ob/ob Mouse, Despite Lowering Body Weight During DIO
Given transgenic mice are protected from DIO (Fig. 2A), we crossed FtMT-Adip mice into a leptin-deficient diabetic ob/ob background to provide a prolonged metabolic challenge. During Dox-chow feeding, no differences in body weight or glucose tolerance were apparent between FtMT-Adip-ob/ob mice and their nontransgenic ob/ob counterparts (Supplementary Fig. 3A and B). Furthermore, no systemic phenotype was evident during feeding or fasting (Supplementary Table 2). Histologically, FtMT-Adip-ob/ob mice still exhibit dysfunctional fat (Supplementary Fig. 3C) and more pronounced hepatic steatosis with increased hepatic TG content (Supplementary Fig. 3D and E). Combined, this suggests a lack in systemic phenotype in transgenic-ob/ob under baseline conditions but a worsened fat and liver phenotype.
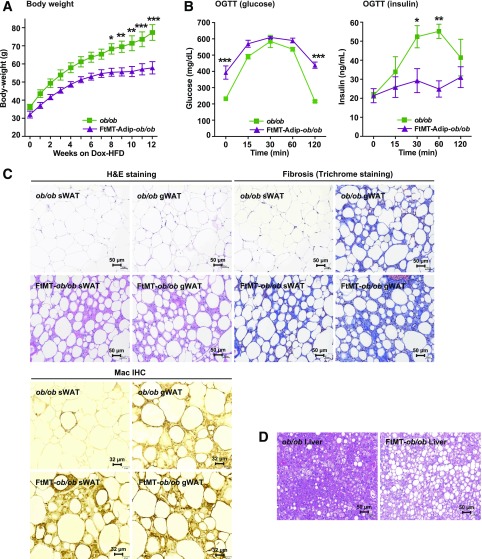
We subsequently added an extra metabolic challenge using Dox-HFD feeding. Interestingly, with the added dietary lipid component, a systemic phenotype was now apparent in FtMT-Adip-ob/ob mice, as they gained less body weight than their ob/ob littermates (Fig. 3A). Transgenic-ob/ob mice also exhibit profound glucose intolerance, with extremely hyperglycemic baseline glucose values of ∼400 mg/dL (Fig. 3B) during feeding and fasting (Supplementary Table 3). This was concomitant with impaired insulin secretion (Fig. 3B) and lower circulating levels of adiponectin (Supplementary Table 3). Finally, FtMT-Adip-ob/ob mice harbor highly dysfunctional, fibrotic, and inflamed fat (Fig. 3C) with chronic hepatic steatosis (Fig. 3D). Taken together, fat-specific induction of FtMT worsens the already metabolically unhealthy phenotype of the ob/ob mouse; however, the added component of dietary lipid is required for this detrimental phenotype to fully unravel.
Figure 3.
Adipose tissue induction of FtMT further worsens the metabolically unhealthy phenotype of the ob/ob mouse, despite reduced body weight during HFD feeding. A: Body weights (g) of ob/ob vs. FtMT-Adip-ob/ob mice during Dox-HFD feeding (n = 3–6). B: Glucose (left) and insulin (right) levels during an OGTT on male ob/ob and FtMT-Adip-ob/ob mice after 6 weeks of Dox-HFD feeding (n = 3–5). C: Representative images of H&E staining (top left), trichrome staining (top right), and Mac2 IHC (bottom) of sWAT and gWAT from ob/ob and FtMT-Adip-ob/ob mice after 12 weeks of Dox-HFD feeding. Scale bars = 50 μm and 32 μm. D: Representative images of H&E staining of liver tissues from ob/ob and FtMT-Adip-ob/ob mice after 12 weeks of Dox-HFD feeding. Scale bars = 50 μm. Data are shown as mean ± SEM. *P < 0.05; **P < 0.01; ***P < 0.001.
Enhancing the Antioxidant System Does Not Rescue the Detrimental Phenotype of Transgenic Mice
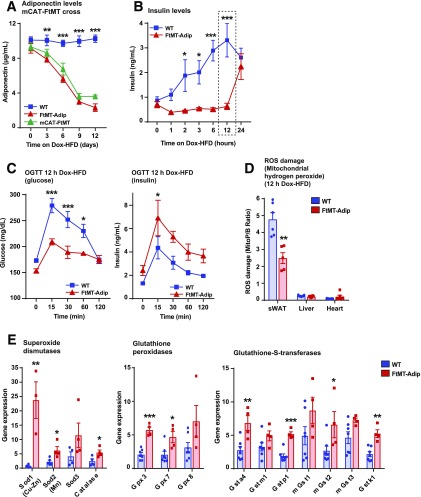
To examine whether high ROS damage in transgenic fat drives their detrimental systemic phenotype, we used an in vivo antioxidant approach. We crossed FtMT-Adip mice with mice that overexpress catalase targeted to mitochondria to achieve fat-specific induction of FtMT simultaneously with a constitutive overexpression of the antioxidant enzyme mitochondrial catalase (mCAT). After the Dox-HFD, constitutive overexpression of mCAT failed to improve glucose tolerance in FtMT-Adip mice (data not shown) or prevent the reduction in adiponectin levels (Fig. 4A). This suggests that mCAT, as an in vivo approach to alleviate an ROS-driven impairment in glucose tolerance, is not sufficient to rescue the detrimental metabolic phenotype of FtMT-Adip mice.
Figure 4.
Acute Dox-HFD feeding initiates a compensatory antioxidant response in FtMT-Adip mice that prevents oxidative stress and a diet-induced spike in insulin levels. A: Circulating adiponectin levels in WT, FtMT-Adip, and mCAT-FtMT mice during 12 day time course of Dox-HFD feeding (n = 6–7). B: Circulating ad libitum insulin levels during acute Dox-HFD feeding (0, 1, 2, 3, 6, 12, and 24 h) of WT and FtMT-Adip mice (n = 8). C: Glucose (left) and insulin (right) levels during an OGTT on WT and FtMT-Adip mice after 12 h of Dox-HFD feeding (n = 6–7). D: ROS damage (mitochondrial hydrogen peroxide), as measured by the peak area ratio of MitoP to MitoB, in sWAT, liver, and heart tissues from WT and FtMT-Adip mice after12 h of Dox-HFD feeding (n = 5–7). E: Antioxidant gene expression levels in WT and transgenic sWAT after 12 h of Dox-HFD (n = 3–7). Data are shown as mean ± SEM. *P < 0.05; **P < 0.01; ***P < 0.001.
While chronic ROS generation contributes to insulin resistance, recent in vivo studies show that mild ROS production paradoxically enhances insulin signaling and sensitivity (17). We next took advantage of the titratable nature of our system by using FtMT as a tool to acutely induce ROS in fat and address whether mild ROS preserves insulin sensitivity during DIO. Given that mild ROS levels are associated with enhanced insulin sensitivity (17) and that transgenic mice have increased basal insulin levels (Fig. 2E), we assessed insulin as an indirect indicator of ROS induction in fat. Figure 4B shows that transgenic mice maintain normoinsulinemia for up to 12 h of Dox-HFD feeding, whereas WT mice significantly elevate their insulin levels in response to the acute dietary challenge. Surprisingly, at the 12-h time point of Dox-HFD feeding, FtMT-Adip mice displayed improved glucose tolerance and enhanced glucose-stimulated insulin secretion (Fig. 4C). This suggests that mild ROS signaling may exert a beneficial role. Interestingly, ROS damage, as measured by mitochondrial hydrogen peroxide levels (Fig. 4D) and lipid peroxide adducts (Supplementary Fig. 4A), is significantly reduced in transgenic sWAT after 12 h of the Dox-HFD, indicating that transgenic mice may unleash a highly protective antioxidant response to the acute dietary challenge. Consistent with this, antioxidant enzymes that detoxify ROS are significantly increased in transgenic sWAT; namely, superoxide dismutases, glutathione peroxidases, and glutathione-S-transferases (Fig. 4E). Collectively, an efficient and protective antioxidant system is activated in transgenic fat, but only in an acute setting of dietary challenge, which is overridden in a chronic setting.
An Interorgan Cross Talk Signaling Axis Originating From Transgenic Fat Targets the Pancreas and Heart to Elicit Massive β-Cell Proliferation and Cardiac ROS Damage
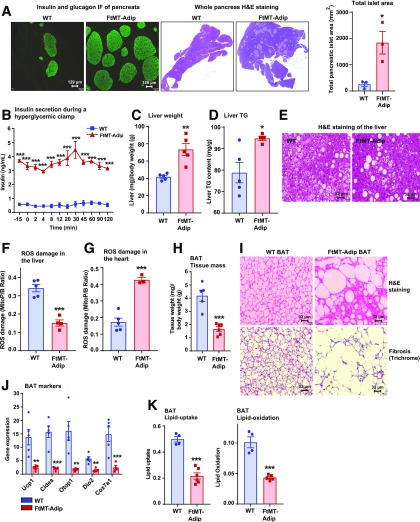
The induction of FtMT in fat produces a major impact on the whole-body signaling communication axis, which signals from fat to the pancreas, liver, and heart. With chronic Dox-HFD feeding, FtMT-Adip mice exhibit massive pancreatic β-cell hyperplasia (Fig. 5A) (more so than most genetic mouse models). Hyperglycemic clamps show highly significant glucose-stimulated hypersecretion of insulin from transgenic β-cells (Fig. 5B). Transgenic livers are also severely affected. FtMT-Adip mice exhibit increased liver mass (Fig. 5C), elevated hepatic TG content (Fig. 5D), and larger hepatic lipid droplets (Fig. 5E), collectively suggesting hepatic steatosis. Paradoxically, despite hepatic steatosis, FtMT-Adip mice exhibit lower ROS damage in the liver (Fig. 5F), and conversely, higher ROS damage in the heart (Fig. 5G). Cardiac tissue in fat-specific FtMT-Adip mice is highly susceptible to oxidative damage even though FtMT is induced exclusively in adipose tissue, with no overexpression evident in the heart (Fig. 1B).
Figure 5.
FtMT-Adip mice exhibit massive β-cell hyperplasia, ROS damage in the heart, hepatic steatosis, and BAT whitening. A: Insulin and glucagon IF staining of pancreata (left) and H&E staining of whole pancreas (center) from WT and FtMT-Adip mice after 16 weeks of Dox-HFD feeding. Scale bars = 129 μm. Right: Total pancreatic islet area (mm2). B: A hyperglycemic clamp: circulating insulin levels were measured at the indicated times during glucose infusion in WT and FtMT-Adip mice after 3 weeks of Dox-HFD (n = 3). Liver weights (mg), normalized to total body-weights (g) (C), and liver TG content (D) in WT and FtMT-Adip mice (n = 4–5). E: Representative images of H&E staining of WT and FtMT-Adip livers. Scale bars = 32 μm. ROS damage, as measured by the peak area ratio of MitoP to MitoB, in liver (F) and heart tissues (G) from WT and FtMT-Adip mice (n = 3–5). H: Tissue mass of BAT from WT and FtMT-Adip mice (n = 5–6). I: Representative images of H&E (top) and trichrome staining (bottom) of BAT from WT and FtMT-Adip mice after Dox-HFD feeding. Scale bars = 32 μm. J: BAT-marker gene expression levels (Ucp1, Cidea, Otop1, Dio2, and Cox7a1) in WT and FtMT-Adip BAT (n = 4–5). K: 3H-triolein lipid uptake and lipid oxidation in BAT from WT and FtMT-Adip mice (n = 4–6). Data are shown as mean ± SEM. *P < 0.05; **P < 0.01; ***P < 0.001.
FtMT-Adip mice also exhibit significantly reduced BAT mass (Fig. 5H), which is fibrotic and contains enlarged lipid-laden disarrayed adipocytes (Fig. 5I). Transgenic BAT also has a marked reduction in classical BAT markers (Fig. 5J), suggesting a “whitened” depot. Indeed, 3H-triolein tracer experiments show significantly impaired lipid uptake and lipid oxidation in transgenic BAT (Fig. 5K), indicating that BAT whitening elicits negative metabolic consequences on lipid homeostasis.
FtMT-Adip Fat Harbors High Ceramide and LPA Levels, With Large Increases in GDF15 and FGF21
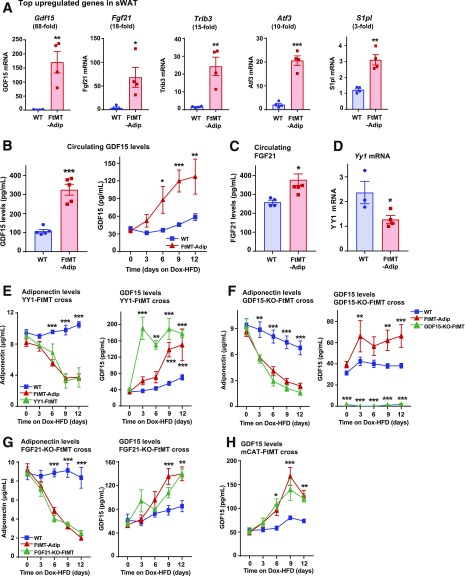
We performed transcriptional analyses to gain more mechanistic insight about how FtMT causes such a profound metabolically unhealthy phenotype. Supplementary Table 4 lists the top significantly upregulated genes in transgenic sWAT. Real-time qPCR confirmation shows significant increases in growth differentiation factor 15 (Gdf15) (88-fold) in sWAT and BAT (Fig. 6A and Supplementary Fig. 5A), Fgf21 (18-fold), Trib3 (15-fold), Atf3 (10-fold), and S1pl (3-fold) (Fig. 6A). GDF15 is a recently identified biomarker for insulin resistance and obesity (18–20). Administration of recombinant or transgenic overexpression of GDF15 reduces DIO and enhances insulin sensitivity (21–23). Here, transgenic mice exhibit significant increases in adipose Gdf15 mRNA (Fig. 6A) and circulating levels of GDF15 protein (Fig. 6B). Consistent with rodent studies of GDF15 induction, FtMT-Adip mice also gain less body weight during DIO (Fig. 2A).
Figure 6.
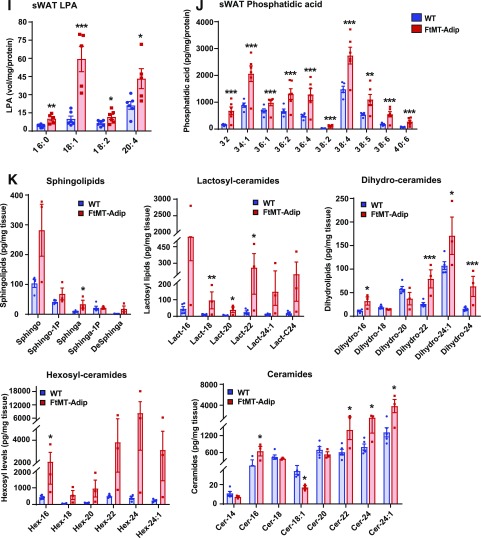
Dysfunctional transgenic fat harbors high toxic lipid species and LPA acid levels with enhanced production of GDF15 and FGF21. A: Real-time qPCR data of several of the top upregulated gene targets (as identified by Illumina microarray) (Gdf15, Fgf21, Trib3, Atf3, and S1pl) in sWAT from WT and FtMT-Adip mice after 3 weeks of Dox-HFD feeding (n = 4). B: Circulating GDF15 levels after a 3-h fast (left) (n = 5) and GDF15 levels during a Dox-HFD time course (every 3 days for up to 12 days) (right) in WT and FtMT-Adip mice (n = 9). C: Circulating FGF21 levels after a 3-h fast (n = 4–6). D: YY1 expression levels in WT and FtMT-Adip sWAT (n = 3–4). E: Circulating adiponectin levels (left) and GDF15 levels (right) in WT, FtMT-Adip, and TRE-YY1 mice crossed with FtMT-Adip mice (YY1-FtMT) during a 12-day Dox-HFD time course (n = 6–8). F: Circulating adiponectin levels (left) and GDF15 levels (right) in WT, FtMT-Adip, and global GDF15-KO mice crossed with FtMT-Adip mice (GDF15-KO-FtMT) (n = 6–8). G: Circulating adiponectin (left), GDF15 (center), and FGF21 (right) levels in WT, FtMT-Adip, and fat-specific FGF21-KO mice crossed with FtMT-Adip mice (FGF21-KO-FtMT) (n = 5–8). H: Circulating GDF15 levels in WT, FtMT-Adip, and mCAT-FtMT mice during 12-day time course of Dox-HFD feeding (n = 6–7). I: LPA levels in WT and FtMT-Adip sWAT (n = 6). J: Phosphatidic acid levels in WT and transgenic mice sWAT (n = 5–6). K: Sphingolipid (sphingosine, sphingosine-1–phopshate, sphinganine, sphinganine-phosphate, and deoxysphinganine), lactosyl-ceramide (lactosyl-16, -18,- 20, -22, -24:1, and -C24), dihydro-ceramide (dihydro-16, -18, -20, -22, -24:1, and -24), hexosyl-ceramide (hexosyl-16, -18,-20, -22, -21:4, and -C240), and ceramide (ceramide-14, -16, -18:1, -18, -20, -22, -24:1, and -24) levels in WT and FtMT-Adip mice after 3 weeks of Dox-HFD feeding (n = 3–5). Data are shown as mean ± SEM. *P < 0.05; **P < 0.01; ***P < 0.001.
Fibroblast growth factor 21 (FGF21) is a hormone that enhances insulin sensitivity (24). While FGF21 elicits positive metabolic effects, certain intracellular mitochondrial disturbances also increase the protein, and as such, FGF21 also serves as a stress-response hormone (25). For instance, mitochondrial diseases that inhibit oxidative phosphorylation display enhanced FGF21 levels (26). Despite having a metabolically unfavorable phenotype, FtMT-Adip mice have significantly upregulated Fgf21 levels in fat (Fig. 6A) and increased FGF21 protein in circulation (Fig. 6C). Given the degree of mitochondrial dysfunction in transgenic fat (Fig. 1G–I), it is likely that FGF21 is a serological marker of an FtMT-induced mitochondrial stress response.
The transcription factor Yin Yang 1 (YY1) suppresses certain proteins that activate thermogenic and uncoupling transcriptional programs: namely Fgf21, Gdf15, and Angptl6 (27). WAT- and BAT-specific YY1-null mice are protected from DIO and exhibit reduced fat-pad mass (27). Here, FtMT-Adip mice harbor a significant downregulation in adipose Yy1 levels (Fig. 6D). Given transgenic mice have increased GDF15 (Fig. 6B), FGF21 (Fig. 6C), and Angptl-6 in fat (Supplementary Fig. 5B), this coincides with the downregulation in YY1. To examine this connection, we crossed FtMT-Adip mice with TRE-YY1 mice to overexpress both FtMT and YY1 in fat. We hypothesized that the restoration of YY1 in transgenic mice could normalize GDF15 and adiponectin levels to preserve insulin sensitivity. However, simultaneous induction of YY1 and FtMT in fat did not prevent the drop in adiponectin, the increase in GDF15 (Fig. 6E), or preserve glucose tolerance (data not shown). Whereas Verdeguer et al. (27) showed YY1 to suppress Gdf15 levels in BAT, conversely, we demonstrate that fat-specific YY1 induction increases GDF15 (Fig. 6E).
We next hypothesized that the increase in GDF15 and FGF21 in transgenic mice (mitochondrial stress markers) triggers their metabolically unfavorable phenotype. We crossed FtMT-Adip mice with global constitutive GDF15 knockout (GDF15-KO) mice or fat-specific FGF21-KO mice (the latter confirmed to exhibit significantly reduced circulating levels of FGF21) (Supplementary Fig. 5C). We used circulating adiponectin and GDF15 as positive and negative readouts, respectively (as indicators for overall metabolic health). After DIO, the unhealthy phenotype of transgenic mice was not reversed by elimination of GDF15 or FGF21, as adiponectin levels were still reduced and GDF15 levels still increased in GDF15-KO mice (Fig. 6F) and FGF21-KO mice (Fig. 6G) (each crossed with FtMT-Adip mice). Of note, while constitutive expression of mCAT in FtMT-Adip mice did not prevent the decline in adiponectin (Fig. 4B), mCAT also failed to counteract the rise in GDF15 (Fig. 6H). Combined, the detrimental phenotype of FtMT-Adip mice is independent of GDF15, FGF21, or mCAT.
Supplementary Table 5 provides the top downregulated genes in transgenic sWAT. qPCR confirmed significant decreases in Grp120 (4-fold), Insig1 (4-fold), Rbp4 (12-fold), SucnR1 (8-fold), Lrg1 (10-fold), Nnat (15-fold), and Fsd2 (7-fold) (Supplementary Fig. 5D). G-protein–coupled receptors play an important role in glucose and lipid homeostasis. GPR120 exerts antidiabetic and anti-inflammatory actions that improve insulin sensitivity in obese (28) and diabetic rodents (29). Here, FtMT-Adip mice have significantly lower Gpr120 levels (Supplementary Fig. 5D). Given the known insulin-sensitization actions of GPR120, this is consistent with transgenic mice displaying severe insulin resistance (Fig. 2E).
LPA is a bioactive signaling lipid. Transgenic mice have significantly increased levels of several LPA species exclusively in fat (Fig. 6I), with no differences evident in liver or heart (Supplementary Fig. 5E) or in circulation (Supplementary Fig. 5F). Phosphatidic acid, which is generated from LPA by the enzyme AGPAT2 (30), is also significantly increased in transgenic fat (Fig. 6J). Consistent with an unhealthy phenotype, several sphingolipid and ceramide species are elevated in transgenic fat (Fig. 6K). Specifically, lactosyl- and hexosyl-ceramide levels are massively increased, more so than ever reported to date (6- to 37-fold, respectively) (Fig. 6K).
Discussion
Here, we take advantage of the unique properties of FtMT as an in vivo tool to elicit adipocyte mitochondrial dysfunction. This allows us to examine how a dysregulation in adipocyte mitochondrial homeostasis influences WAT expansion during obesity. While we hypothesized that general adipocyte mitochondrial dysfunction (caused by a fat-specific induction of FtMT) would elicit a positive “obese yet metabolically favorable” phenotype, we in fact observed the opposite: a “lean yet metabolically unhealthy” phenotype. The distinct phenotypic outcome is likely explained by the different mitochondrial perturbations that FtMT and mitoNEET trigger in the adipocyte. This is based on their differential effect on mitochondrial iron homeostasis. FtMT induction in the mitochondrial matrix increases mitochondrial iron, whereas mitoNEET overexpression in the outer mitochondrial membrane reduces mitochondrial iron. It is rather remarkable that such highly specific mitochondrial insults can trigger either a metabolically positive (mitoNEET) or negative (FtMT) compensatory mechanism.
Despite our unexpected outcome, fat-specific induction of FtMT in its own right generated a unique and extreme phenotype. Adipocyte mitochondrial impairment generated dysfunctional fat, with increases in local and circulating levels of two established beneficial factors, GDF15 and FGF21. Albeit here, they likely serve as mitochondrial stress markers. Our new model system also identifies how metabolically unhealthy fat expansion has both negative and positive effects on target tissues by signaling through a whole-body interorgan communication axis. Adipocyte mitochondrial dysfunction, while causing a local negative milieu, paradoxically triggers massive pancreatic β-cell proliferation and protects the liver from oxidative damage (the latter likely due to enhanced mitochondrial uncoupling). Conversely, this dysfunctional fat promotes ROS damage in the heart. The FtMT-induced β-cell hyperplasia is extreme; much more pronounced than typically seen in other mouse models of insulin resistance (31,32). This raises interesting questions about how the pancreas responds in such a positive manner to compensate for severely dysfunctional fat.
Locally, FtMT-induced adipocyte mitochondrial impairment yields all the classical hallmarks of highly dysfunctional fat (33). After DIO, transgenic fat becomes inflamed and fibrotic and exhibits reduced insulin sensitivity, mitochondrial dysfunction, enhanced ROS damage, high levels of LPA, and increased levels of toxic lipid species (ceramides, lactosyl- and hexosyl-ceramides), with the latter further promoting insulin resistance (34). LPA is a bioactive lipid and a key extracellular signaling molecule. Administration of LPA to obese glucose-intolerant mice diminishes insulin secretion to further promote hyperglycemia (35). LPA administration generates ROS through NADPH oxidase 4 (36), protein kinase C (37), mitogen-activated protein kinase (38), and epidermal growth factor receptor–mediated mechanisms (39), and vice versa, ROS is a second messenger for LPA-mediated signaling (40). Here, transgenic mice exhibit large increases in several LPA species exclusively in fat, suggesting that these signaling lipids contribute to their metabolically unfavorable phenotype.
GDF15 is a recently discovered biomarker for insulin resistance, obesity, and cardiovascular disease (20). In humans, increased circulating levels of GDF15 correlate with weight loss (41). In rodents, administration of recombinant GDF15 or transgenic overexpression reduces body weight and fat mass to enhance insulin sensitivity (21,22). While GDF15 is associated with a positive metabolic milieu, the protein is also secreted as a mitochondrial stress-responsive cytokine after mitochondrial dysfunction (42). Here, transcriptional analyses reveals GDF15 and the metabolic hormone FGF21 as two of the top most upregulated genes in transgenic fat. This also translates systemically, with increased levels of both in circulation, and also suggests that fat-derived FGF21 leads to an upregulation of circulating FGF21 levels, a notion unrecognized to date. FGF21 is also a factor that promotes weight loss and insulin sensitivity (24). Similar to GDF15, intracellular disturbances enhance FGF21 levels. Here, mitochondria-induced fat dysfunction produces a metabolically unfavorable phenotype in mice that exhibit increased levels of FGF21 and GDF15, which act as serological markers of a mitochondrial stress response.
Adipose tissue health and insulin responsiveness are critical for the metabolic flexibility of other organs. Here, transgenic mice exhibit highly dysfunctional fat that triggers system-wide insulin resistance, which has detrimental effects on the heart and BAT. Paradoxically, beneficial effects are apparent for the pancreas and liver; the latter in context of reduced oxidative damage, which could be a result of enhanced mitochondrial uncoupling. The pancreas harbors one of the most striking phenotypes in the FtMT-Adip mouse: massive β-cell hyperproliferation. This β-cell hyperplasia is much more pronounced than typically observed for other mouse models of insulin resistance (31,32). Accompanying this, transgenic mice exhibit massive insulin secretion during a hyperglycemic clamp, suggesting a profound compensatory response from the β-cell rather than insufficient production of insulin or defective insulin secretion. Combined, this points to a fat-to-pancreas signaling axis that initiates massive expansion of β-cell mass. One hypothesis of how this may occur is through the adipokine adipsin, which signals from the adipocyte to the pancreas to positively impact β-cell function (43). However, as transgenic fat displays a reduction in adipsin expression (data not shown), it is unlikely that adipsin is the primary mediator here. Alternatively, the high degree of ROS damage in transgenic fat may modify lipid intermediates or proteins that are released in exosomal vesicles. These vesicles (containing ROS-modified material) could potentially travel in circulation from the fat to the pancreas.
Type 2 diabetes is associated with reduced β-cell mass and function, resulting in inadequate insulin production. Conversely, in diet-induced (32,44) and genetic mouse models (45) of nondiabetic obesity, particularly in the C57BL/6 ob/ob mouse, an expansion of β-cell mass (partly due to β-cell proliferation) occurs before insulin resistance (44). Human autopsy studies show that obese individuals who are not diabetic have a 50% greater β-cell mass compared with lean individuals (46). As such, the ability to expand functional β-cell mass in response to insulin resistance is crucial in the prevention of diabetes. Here, the induction of mitochondrial dysfunction in fat produces a lean insulin-resistant mouse that exhibits massive β-cell hyperplasia. Given that β-cell expansion typically occurs as a compensatory response to nondiabetic obesity (47), this suggests the FtMT-Adip mouse is a unique model that promotes β-cell proliferation in a lean setting.
When excessively produced, ROS disrupts cellular signaling and inflicts damage to DNA, lipids, and proteins. The heart is extremely susceptible to oxidative damage from intraorgan ROS or circulating ROS-inducing factors (48); as such, oxidative stress contributes to the development of cardiovascular disease (48). Here, fat-specific FtMT-Adip mice exhibit ROS damage in the heart, despite FtMT only being induced exclusively in fat, with no overexpression in the heart. This suggests that an external source of ROS (likely originating from dysfunctional fat) has detrimental effects on the heart and is thus responsible for the oxidative stress inflicted on cardiac tissue.
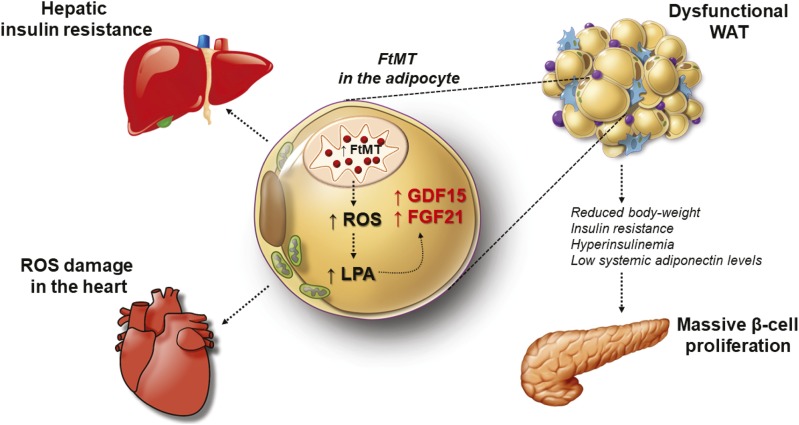
In conclusion, Fig. 7 highlights the proposed mechanism by which mitochondrial dysfunction in the adipocyte, in this particular case, alters local WAT function to elicit unique system-wide negative and positive effects on other organs. Specifically, FtMT induction in the adipocyte promotes local ROS damage, with an increase in LPA and ceramide production. This activates a mitochondrial stress response from the adipocyte, which increases GDF15 and FGF21. Such local effects exert a profound impact globally, as fat-specific FtMT-Adip mice harbor a lean phenotype yet are metabolically unhealthy. While the heart exhibits the negative effects of oxidative damage, the pancreas responds in a positive manner through massive β-cell proliferation.
Figure 7.
The impact of mitochondrial dysfunction in the adipocyte during obesity. The proposed mechanism of how FtMT-induced mitochondrial dysfunction specifically in the mature adipocyte impacts local adipose tissue function, which consequently inflicts unique system-wide negative and positive effects on other organs. Within the adipocyte, triggering mitochondrial impairment elicits oxidative damage and LPA production, which unleashes a mitochondrial stress response to increase the production of GDF15 and FGF21. In turn, this produces a lean yet metabolically unfavorable phenotype. The liver and heart harbor negative consequences that entail insulin resistance and ROS damage, respectively. The pancreas, however, acquires beneficial consequences, namely, massive β-cell hyperproliferation in response this unique FtMT-based perturbation of adipocyte mitochondria.
Supplementary Material
Article Information
Acknowledgments. The authors kindly thank J. Song and S. Connell (Touchstone Diabetes Center, Department of Internal Medicine, The University of Texas Southwestern Medical Center, Dallas, TX) for technical assistance in addition to the rest of the Scherer laboratory for helpful discussions. The authors also thank R. Hammer and The University of Texas Southwestern Medical Center Transgenic Core Facility for the generation of mouse models as well as the Metabolic Core Facility. The authors also thank L. Jackson of the Iron and Heme Core Facility at the University of Utah for additional confirmatory iron and heme measurements and G. Milne and S. Sanchez (Eicosanoid Core Laboratory, Vanderbilt University Medical Center, Nashville, TN) for F2-isoprostane measurements. Floxed FGF21-KO mice were kindly provided by the D. Mangelsdorf and S. Kliewer laboratory (Department of Pharmacology, The University of Texas Southwestern Medical Center, Dallas, TX). mCAT mice were kindly provided by Dr. Peter Rabinovitch (Department of Pathology, University of Washington).
Funding. The authors were supported by the National Institutes of Health, National Institute of Diabetes and Digestive and Kidney Diseases grants R01-DK-55758, R01-DK-099110, and P01-DK-088761 (to P.E.S.).
Duality of Interest. R.J.S. and A.C.A. are affiliated with Eli Lilly Research Laboratories. This does not alter the authors’ adherence to Diabetes policies on sharing data and materials. No other potential conflicts of interest relevant to this article were reported.
Author Contributions. C.M.K. conducted all experiments and wrote the manuscript, except the portions indicated below. A.L.G. and T.S.M. performed and analyzed the triolein experiments. R.J.S. and A.C.A. performed the FGF21 measurements. Y.A. and J.A.J. assisted in the ROS measurements. J.A.J. and W.L.H. performed the 2-DG and clamp experiments. N.J. and C.C. assisted in mouse experiments. R.G. performed the ceramide and sphingolipid experiments. P.E.S. was involved in experimental design, experiments, data analysis and interpretation, and in writing the manuscript. All authors approved the final version of the manuscript. P.E.S. is the guarantor of this work and, as such, had full access to all the data in the study and takes responsibility for the integrity of the data and the accuracy of the data analysis.
Footnotes
This article contains Supplementary Data online at https://diabetes.diabetesjournals.org/lookup/suppl/doi:10.2337/db19-0327/-/DC1.
References
- 1.Kusminski CM, Scherer PE. Mitochondrial dysfunction in white adipose tissue. Trends Endocrinol Metab 2012;23:435–443 [DOI] [PMC free article] [PubMed] [Google Scholar]
- 2.Kusminski CM, Holland WL, Sun K, et al. MitoNEET-driven alterations in adipocyte mitochondrial activity reveal a crucial adaptive process that preserves insulin sensitivity in obesity. Nat Med 2012;18:1539–1549 [DOI] [PMC free article] [PubMed] [Google Scholar]
- 3.Corsi B, Cozzi A, Arosio P, et al. Human mitochondrial ferritin expressed in HeLa cells incorporates iron and affects cellular iron metabolism. J Biol Chem 2002;277:22430–22437 [DOI] [PubMed] [Google Scholar]
- 4.Wu WS, Zhao YS, Shi ZH, et al. Mitochondrial ferritin attenuates β-amyloid-induced neurotoxicity: reduction in oxidative damage through the Erk/P38 mitogen-activated protein kinase pathways. Antioxid Redox Signal 2013;18:158–169 [DOI] [PubMed] [Google Scholar]
- 5.Drysdale J, Arosio P, Invernizzi R, et al. Mitochondrial ferritin: a new player in iron metabolism. Blood Cells Mol Dis 2002;29:376–383 [DOI] [PubMed] [Google Scholar]
- 6.Kusminski CM, Gallardo-Montejano VI, Wang ZV, et al. E4orf1 induction in adipose tissue promotes insulin-independent signaling in the adipocyte. Mol Metab 2015;4:653–664 [DOI] [PMC free article] [PubMed] [Google Scholar]
- 7.Livak KJ, Schmittgen TD. Analysis of relative gene expression data using real-time quantitative PCR and the 2(-Delta Delta C(T)) Method. Methods 2001;25:402–408 [DOI] [PubMed] [Google Scholar]
- 8.Chen Z, Holland W, Shelton JM, et al. Mutation of mouse Samd4 causes leanness, myopathy, uncoupled mitochondrial respiration, and dysregulated mTORC1 signaling. Proc Natl Acad Sci U S A 2014;111:7367–7372 [DOI] [PMC free article] [PubMed] [Google Scholar]
- 9.Holland WL, Miller RA, Wang ZV, et al. Receptor-mediated activation of ceramidase activity initiates the pleiotropic actions of adiponectin. Nat Med 2011;17:55–63 [DOI] [PMC free article] [PubMed] [Google Scholar]
- 10.Levi S, Arosio P. Mitochondrial ferritin. Int J Biochem Cell Biol 2004;36:1887–1889 [DOI] [PubMed] [Google Scholar]
- 11.Kusminski CM, Scherer PE. The road from discovery to clinic: adiponectin as a biomarker of metabolic status. Clin Pharmacol Ther 2009;86:592–595 [DOI] [PubMed] [Google Scholar]
- 12.Ye R, Scherer PE. Adiponectin, driver or passenger on the road to insulin sensitivity? Mol Metab 2013;2:133–141 [DOI] [PMC free article] [PubMed] [Google Scholar]
- 13.Kersten S. Physiological regulation of lipoprotein lipase. Biochim Biophys Acta 2014;1841:919–933 [DOI] [PubMed] [Google Scholar]
- 14.Zhang R. The ANGPTL3-4-8 model, a molecular mechanism for triglyceride trafficking. Open Biol 2016;6:150272. [DOI] [PMC free article] [PubMed] [Google Scholar]
- 15.Turer AT, Scherer PE. Adiponectin: mechanistic insights and clinical implications. Diabetologia 2012;55:2319–2326 [DOI] [PubMed] [Google Scholar]
- 16.Kim JY, van de Wall E, Laplante M, et al. Obesity-associated improvements in metabolic profile through expansion of adipose tissue. J Clin Invest 2007;117:2621–2637 [DOI] [PMC free article] [PubMed] [Google Scholar]
- 17.Loh K, Deng H, Fukushima A, et al. Reactive oxygen species enhance insulin sensitivity. Cell Metab 2009;10:260–272 [DOI] [PMC free article] [PubMed] [Google Scholar]
- 18.Brown DA, Breit SN, Buring J, et al. Concentration in plasma of macrophage inhibitory cytokine-1 and risk of cardiovascular events in women: a nested case-control study. Lancet 2002;359:2159–2163 [DOI] [PubMed] [Google Scholar]
- 19.Kempf T, Björklund E, Olofsson S, et al. Growth-differentiation factor-15 improves risk stratification in ST-segment elevation myocardial infarction. Eur Heart J 2007;28:2858–2865 [DOI] [PubMed] [Google Scholar]
- 20.Kempf T, Guba-Quint A, Torgerson J, et al. Growth differentiation factor 15 predicts future insulin resistance and impaired glucose control in obese nondiabetic individuals: results from the XENDOS trial. Eur J Endocrinol 2012;167:671–678 [DOI] [PubMed] [Google Scholar]
- 21.Johnen H, Lin S, Kuffner T, et al. Tumor-induced anorexia and weight loss are mediated by the TGF-beta superfamily cytokine MIC-1. Nat Med 2007;13:1333–1340 [DOI] [PubMed] [Google Scholar]
- 22.Macia L, Tsai VW, Nguyen AD, et al. Macrophage inhibitory cytokine 1 (MIC-1/GDF15) decreases food intake, body weight and improves glucose tolerance in mice on normal & obesogenic diets. PLoS One 2012;7:e34868. [DOI] [PMC free article] [PubMed] [Google Scholar]
- 23.Chrysovergis K, Wang X, Kosak J, et al. NAG-1/GDF-15 prevents obesity by increasing thermogenesis, lipolysis and oxidative metabolism. Int J Obes 2014;38:1555–1564 [DOI] [PMC free article] [PubMed] [Google Scholar]
- 24.Owen BM, Mangelsdorf DJ, Kliewer SA. Tissue-specific actions of the metabolic hormones FGF15/19 and FGF21. Trends Endocrinol Metab 2015;26:22–29 [DOI] [PMC free article] [PubMed] [Google Scholar]
- 25.Gómez-Sámano MA, Grajales-Gómez M, Zuarth-Vázquez JM, et al. Fibroblast growth factor 21 and its novel association with oxidative stress. Redox Biol 2017;11:335–341 [DOI] [PMC free article] [PubMed] [Google Scholar]
- 26.Suomalainen A. Fibroblast growth factor 21: a novel biomarker for human muscle-manifesting mitochondrial disorders. Expert Opin Med Diagn 2013;7:313–317 [DOI] [PubMed] [Google Scholar]
- 27.Verdeguer F, Soustek MS, Hatting M, et al. Brown adipose YY1 deficiency activates expression of secreted proteins linked to energy expenditure and prevents diet-induced obesity. Mol Cell Biol 2015;36:184–196 [DOI] [PMC free article] [PubMed] [Google Scholar]
- 28.Oh DY, Walenta E, Akiyama TE, et al. A Gpr120-selective agonist improves insulin resistance and chronic inflammation in obese mice. Nat Med 2014;20:942–947 [DOI] [PMC free article] [PubMed] [Google Scholar]
- 29.Satapati S, Qian Y, Wu MS, et al. GPR120 suppresses adipose tissue lipolysis and synergizes with GPR40 in antidiabetic efficacy. J Lipid Res 2017;58:1561–1578 [DOI] [PMC free article] [PubMed] [Google Scholar]
- 30.Cortés VA, Curtis DE, Sukumaran S, et al. Molecular mechanisms of hepatic steatosis and insulin resistance in the AGPAT2-deficient mouse model of congenital generalized lipodystrophy. Cell Metab 2009;9:165–176 [DOI] [PMC free article] [PubMed] [Google Scholar]
- 31.Ogino J, Sakurai K, Yoshiwara K, et al. Insulin resistance and increased pancreatic beta-cell proliferation in mice expressing a mutant insulin receptor (P1195L). J Endocrinol 2006;190:739–747 [DOI] [PubMed] [Google Scholar]
- 32.Mosser RE, Maulis MF, Moullé VS, et al. High-fat diet-induced β-cell proliferation occurs prior to insulin resistance in C57Bl/6J male mice. Am J Physiol Endocrinol Metab 2015;308:E573–E582 [DOI] [PMC free article] [PubMed] [Google Scholar]
- 33.Sun K, Kusminski CM, Scherer PE. Adipose tissue remodeling and obesity. J Clin Invest 2011;121:2094–2101 [DOI] [PMC free article] [PubMed] [Google Scholar]
- 34.Holland WL, Knotts TA, Chavez JA, Wang LP, Hoehn KL, Summers SA. Lipid mediators of insulin resistance. Nutr Rev 2007;65:S39–S46 [DOI] [PubMed] [Google Scholar]
- 35.Rancoule C, Attané C, Grès S, et al. Lysophosphatidic acid impairs glucose homeostasis and inhibits insulin secretion in high-fat diet obese mice. Diabetologia 2013;56:1394–1402 [DOI] [PubMed] [Google Scholar]
- 36.Kang S, Han J, Song SY, et al. Lysophosphatidic acid increases the proliferation and migration of adipose-derived stem cells via the generation of reactive oxygen species. Mol Med Rep 2015;12:5203–5210 [DOI] [PubMed] [Google Scholar]
- 37.Lin CC, Lin CE, Lin YC, et al. Lysophosphatidic acid induces reactive oxygen species generation by activating protein kinase C in PC-3 human prostate cancer cells. Biochem Biophys Res Commun 2013;440:564–569 [DOI] [PubMed] [Google Scholar]
- 38.Chen Q, Olashaw N, Wu J. Participation of reactive oxygen species in the lysophosphatidic acid-stimulated mitogen-activated protein kinase kinase activation pathway. J Biol Chem 1995;270:28499–28502 [DOI] [PubMed] [Google Scholar]
- 39.Cunnick JM, Dorsey JF, Standley T, et al. Role of tyrosine kinase activity of epidermal growth factor receptor in the lysophosphatidic acid-stimulated mitogen-activated protein kinase pathway. J Biol Chem 1998;273:14468–14475 [DOI] [PubMed] [Google Scholar]
- 40.Saunders JA, Rogers LC, Klomsiri C, Poole LB, Daniel LW. Reactive oxygen species mediate lysophosphatidic acid induced signaling in ovarian cancer cells. Free Radic Biol Med 2010;49:2058–2067 [DOI] [PMC free article] [PubMed] [Google Scholar]
- 41.Tsai VW, Macia L, Feinle-Bisset C, et al. Serum levels of human MIC-1/GDF15 vary in a diurnal pattern, do not display a profile suggestive of a satiety factor and are related to BMI. PLoS One 2015;10:e0133362. [DOI] [PMC free article] [PubMed] [Google Scholar]
- 42.Fujita Y, Taniguchi Y, Shinkai S, Tanaka M, Ito M. Secreted growth differentiation factor 15 as a potential biomarker for mitochondrial dysfunctions in aging and age-related disorders. Geriatr Gerontol Int 2016;16(Suppl. 1):17–29 [DOI] [PubMed] [Google Scholar]
- 43.Lo JC, Ljubicic S, Leibiger B, et al. Adipsin is an adipokine that improves β cell function in diabetes. Cell 2014;158:41–53 [DOI] [PMC free article] [PubMed] [Google Scholar]
- 44.Hull RL, Kodama K, Utzschneider KM, Carr DB, Prigeon RL, Kahn SE. Dietary-fat-induced obesity in mice results in beta cell hyperplasia but not increased insulin release: evidence for specificity of impaired beta cell adaptation. Diabetologia 2005;48:1350–1358 [DOI] [PubMed] [Google Scholar]
- 45.Keller MP, Choi Y, Wang P, et al. A gene expression network model of type 2 diabetes links cell cycle regulation in islets with diabetes susceptibility. Genome Res 2008;18:706–716 [DOI] [PMC free article] [PubMed] [Google Scholar]
- 46.Butler AE, Janson J, Bonner-Weir S, Ritzel R, Rizza RA, Butler PC. Beta-cell deficit and increased beta-cell apoptosis in humans with type 2 diabetes. Diabetes 2003;52:102–110 [DOI] [PubMed] [Google Scholar]
- 47.Linnemann AK, Baan M, Davis DB. Pancreatic β-cell proliferation in obesity. Adv Nutr 2014;5:278–288 [DOI] [PMC free article] [PubMed] [Google Scholar]
- 48.Taverne YJ, Bogers AJ, Duncker DJ, Merkus D. Reactive oxygen species and the cardiovascular system. Oxid Med Cell Longev 2013;2013:862423. [DOI] [PMC free article] [PubMed] [Google Scholar]
Associated Data
This section collects any data citations, data availability statements, or supplementary materials included in this article.


