Figure 4.
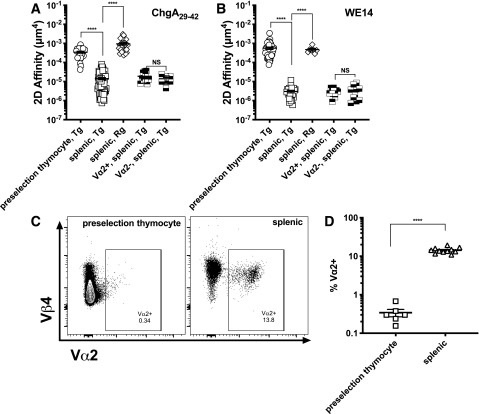
Splenic BDC2.5 Tg T cells recognize the ChgA29–42 and the WE14 epitopes with lower 2D affinity than preselection thymocytes. A and B: 2D affinity of DP (CD4+CD8+) preselection, splenic SP (CD4+CD8−), splenic SP Vα2+ and Vα2− BDC2.5 Tg, and splenic SP BDC2.5 Rg T cells for the ChgA29–42 (A) and WE14 (B) epitopes. Each point in panels A and B represents one cell. For each condition, data were pooled from multiple experiments, with each experiment corresponding to one mouse (WE14, Tg DP, experiment number n = 6; WE14, Tg SP, n = 6; WE14, Rg SP, n = 2; ChgA29–42, Tg DP, n = 6; ChgA29–42, Tg SP, n = 14; ChgA29–42, Rg SP, n = 3). C: Representative flow plots of Vα2 (plotted with Vβ4) expression in the preselection and splenic BDC2.5 Tg T cells from panel D. D: Vα2 expression is much higher on splenic Tg BDC2.5 T cells than preselection thymocytes. Each point in panel D represents one mouse. The lines and error bars in panels A, B, and D represent mean and SEM. ****P < 0.0001.

